The Daily Brief
The Oil That Wasn't Supposed to Flow: More Crude Is Leaving the Persian Gulf Than Before the War
Attacks are at a record pace, tanker rates are the highest ever recorded, and Iran's exports have hit zero. Yet total Gulf flows just passed their pre-war level — because the tanker trade rebuilt the map. The numbers behind the most improbable flow in energy.
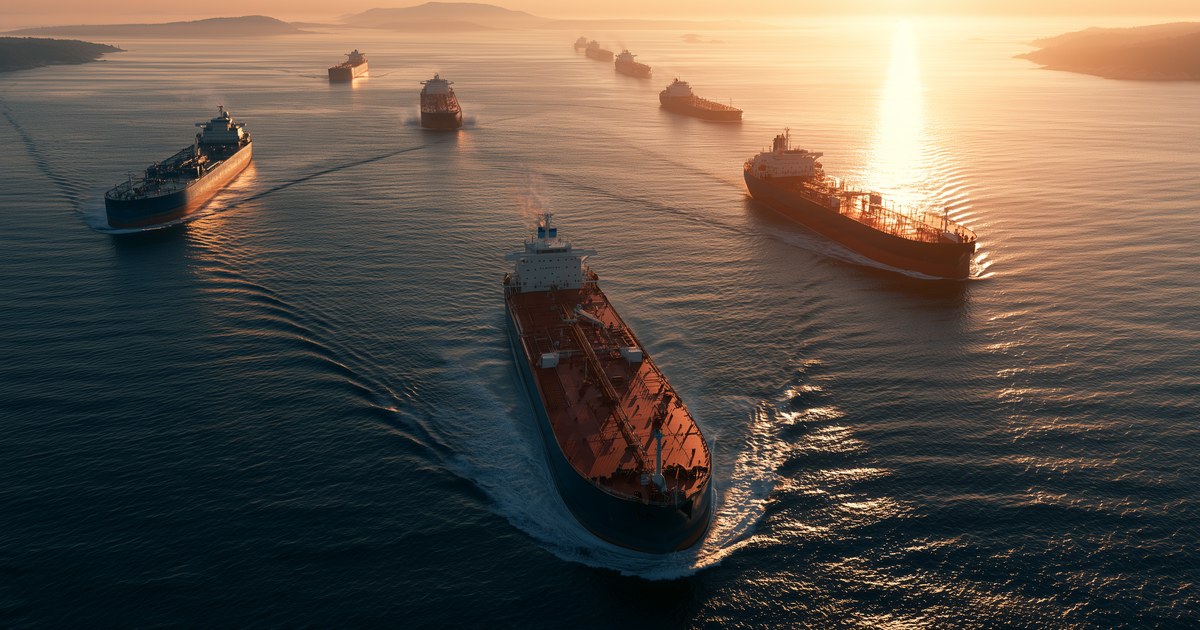
Eight months into a war that was supposed to strangle Gulf oil, the strangest number in energy just printed: more oil is leaving the region than before the fighting started. Total Middle East oil flows averaged over 24 million barrels a day in the week through October 18 — above the 23.3 million the region moved before the war (Kpler, via the Wall Street Journal). Yesterday we reported Brent crude touching $111.75 on claimed strikes against Saudi energy (see The $110 Oil Bid Went Live). Today's story is the flow underneath that price — and it runs in the opposite direction to the fear.
The squeeze is real — it is just not the whole map#
Start with what is genuinely shut. Iran's crude exports were zero in September — the first zero month since Kpler began tracking in 2013 — and stayed at zero into October under the US blockade, with some 83 million barrels of Iranian crude sitting on water, 43 million of it trapped west of Hormuz (Kpler and Vortexa, via Reuters). The Strait itself is a shadow of its old self: Hormuz flows ran near 14 million barrels a day last week, 82% of pre-war, and closer to 11 million on the latest days — down roughly a third from an early-October peak near 17 million (Kpler). Transit counts have touched seven commodity vessels in a single day, against roughly 125 large commercial ships a day before the war. Aramco chief executive Amin Nasser put the cumulative cost at almost 3 billion barrels lost since the war began on February 28 — one billion of it covered by drawing down stocks, with replenishment likely to take up to two years (Reuters).
The detour that became a highway#
The oil did not stop. It moved. Bypass routes around Hormuz — Gulf of Oman loadings and Red Sea outlets — carried 6.7 million barrels a day in early October, more than double their pre-war volume (Reuters). That rerouting survived its own war: Saudi Arabia's East-West pipeline, which can move crude to Yanbu on the Red Sea, was shut on September 11 by drone attacks before restarting, and the Houthi blockade of the Bab el-Mandeb forced Saudi barrels back toward Hormuz for a stretch (Reuters). The result is a two-map market: production across Saudi Arabia, the UAE, Iraq and Kuwait is expected near 17.3 million barrels a day in October, well below roughly 21 million pre-war (Energy Aspects) — yet Saudi exports of about 7.3 million barrels a day over the past three weeks run close to pre-war levels, and UAE exports near 3.3 million match them. The Gulf is producing less and shipping nearly all of it smarter.
The new map: where it flows, where it was redirected, where it stopped#
Still flowing through Hormuz — barely. The strait that carried roughly 17 million barrels a day before the war moved near 14 million last week and closer to 11 million on the latest days (Kpler). The traffic that remains runs a gauntlet: shuttle routes along the Omani coast, transponders dark, ship-to-ship transfers in the Gulf of Oman — a system now itself under attack.
Redirected around it. The bypass network — Gulf of Oman loadings, anchored by Fujairah on the strait's ocean side, and Red Sea outlets fed by Saudi Arabia's East-West pipeline to Yanbu — carried 6.7 million barrels a day in early October, more than double pre-war, and roughly 40% of non-Iranian Gulf crude in September against 17% before the war (Kpler). Both detours have already been hit: the East-West line was shut by drones on September 11 before restarting, and the Houthi blockade of the Bab el-Mandeb — control of that coast is contested as of this week — periodically closes the Red Sea end of the route.
Stopped. Iran: zero exports since September, 83 million barrels stranded on the water. Qatar's LNG: Ras Laffan lost roughly 17% of its export capacity to missile damage, with repairs measured in years. And the margin itself: regional production near 17.3 million barrels a day against roughly 21 million pre-war means the Gulf is shipping a near-normal share of a smaller pie.
Tankers: the highest-paid detour in shipping history#
None of this moves without hulls willing to sail into a missile range — and hulls, right now, are the best-paid asset in energy. A very large crude carrier on the Persian Gulf to East Asia run earned nearly $1.4 million a day in early October, an all-time record, up roughly 540% since before the war (Bloomberg). Round-trip earnings reached $1.3 million a day against a 2025 average near $55,000 (Signal Ocean, via Reuters). Freight on Gulf-to-China crude is running around $36 to $37 a barrel, more than five times pre-war levels, and war-risk insurance now costs up to 10% of a ship's hull value per transit, against under 3% before the war (Windward, via WSJ). Rates eased slightly from the records on October 16 — to levels that would still have been unthinkable a year ago (Baltic Exchange, via Reuters).
The risk is not theoretical. Attacks on shipping hit their highest weekly level of the war in early October, with 12 reported in a single week (UKMTO) and at least 18 across two weeks (Kpler). The VLCC Kazimah III, carrying 2 million barrels of Kuwaiti crude, was hit on October 1; the supertanker Loyalty, with 2 million barrels of Iraqi crude, took an RPG strike on October 16 (Vanguard, via WSJ). Attacks now reach into the Gulf of Oman, threatening the ship-to-ship transfer zones the bypass system depends on (LSEG, via Reuters). Owners are answering with money and method: crews earn two to three times normal pay, up to $25,000 per round trip (WSJ), while shuttle runs hug the Omani coast with tracking transponders dark, under US air cover. Qatar's LNG trade remains the war's structural casualty — missile damage at Ras Laffan knocked out roughly 17% of export capacity, with repairs measured in years (Reuters).
From freight rates to interest rates#
The detour is not free, and its bill arrives through the oldest channel in macro: energy into inflation into the cost of money. Freight at $36 to $37 a barrel and insurance at up to 10% of hull value are not shipping trivia — they are delivered energy costs, and they are already showing up where Reuters found them on October 15: at the pump and in grocery prices. Brent sits some 40% above pre-war, above $100 for all of October, one week before the Federal Reserve meets on October 28. Every month the premium holds is a month headline inflation carries an energy floor — and a month the Fed's room to cut stays narrow, with the 10-year Treasury near 5.10%.
That is where this story stops being about ships. A higher-for-longer rate path is a higher cost of capital for everything financed with debt — and nothing in this economy is financed with more debt than the AI buildout. It is the argument running through our own coverage this week: Niraj Neupane's The Cost of Capital Came for AI on what expensive money did to tech valuations, and our credit-market report, The Credit Market Is Pricing AI Default Risk, on protection costs at record wides for the builders borrowing the most. The chain is mechanical: a missile range in the Gulf raises freight, freight raises delivered energy costs, energy props up inflation, inflation pins interest rates, and pinned rates reprice every leveraged balance sheet on earth — starting with the ones building AI. The tankers are, indirectly, setting the discount rate.
Our take#
Brent changed hands near $110 on Wednesday morning, some 40% above pre-war, above $100 for all of October (Reuters). The market is pricing two truths at once. The flow map has been rebuilt — around a closed strait, around a blockaded Iran, around a missile range — and it works, at a price: record freight, record insurance and a 3-billion-barrel hole in the world's stock cushion. What the premium is really buying is the fragility of the workaround. The detour runs on tanker captains willing to sail dark along the Omani coast and on bypass terminals that have already been attacked once. The oil flows. The margin for error is what hit zero.
Figures are as reported by the cited sources on the dates shown; flow data from Kpler and Vortexa are preliminary and exclude some transits made with tracking transponders off. Iranian and Houthi strike claims that Saudi authorities have not confirmed are reported as claims. This article is reporting and analysis, not financial advice.
Where this came from
- WSJ — More Oil Is Now Coming Out of the Persian Gulf Than Before the Iran War (Oct 20-21, 2026)
- Reuters — Hormuz transits lowest in over two months after attacks, data shows (Oct 8, 2026)
- Reuters — Replenishing crude, fuel supplies could take two years, Saudi Aramco CEO says (Oct 5, 2026)
- Reuters — Saudi energy minister says oil pumped through East-West pipeline reached 58% (Oct 6, 2026)
- Reuters — Oil shipping costs spike, lifting prices at the pump and grocery store (Oct 15, 2026)
- Reuters — Supertanker rates fall from record highs (Oct 16, 2026)
- Reuters — Iran ships some LPG, jet fuel despite US blockade, data shows (Oct 16, 2026)
- Reuters Open Interest — Energy Watch: Hormuz flows and the latest-days decline (Oct 19, 2026)
- Reuters — Oil rises on Middle East supply worries (Oct 21, 2026)
- Bloomberg — Supertankers Racing to Middle East Worsen Global Ships Crunch (Oct 8, 2026)
Plain-English explainers, not advice. Nothing here tells you to buy, sell, or hold anything.