Disclaimer: This article is for educational purposes only and is not investment advice. Trading and investing are subject to volatility and market risk, including partial or entire loss of capital. Please consult your financial advisor before making investment decisions. Financial Gurkha and its writers are not liable for your losses, nor do we take credit for your gains. FinancialGurkha.com and its authors assume no liability for financial outcomes.
Author disclosure Financial Gurkha / Kanchan Sharma does not hold a equity/ option position in any of the mentioned stocks / indexes / tickers in this article at the time of writing.
Tanker Stocks in 2026: Record Profits, Record Rates, and Whether It Is Too Late to Buy#
For six months, some of the most profitable ships in the world have been the ones carrying crude oil the long way around.
In the second quarter of 2026, six US-listed tanker companies reported combined net income of $1.83 billion, up from $330 million a year earlier. Frontline Plc.(NYSE: FRO) alone earned $659 million in one quarter. DHT (NYSE:DHT) Holdings said its first-half profit had already beaten the best full year in its history. Teekay Tankers (NYSE: TNK) now holds $1.2 billion of cash and short-term investments against essentially no debt.
Five-fold profit growth in a year is a number we are used to seeing from AI hardware, not from ships. This report does three things - explains what is actually driving the surge in earnings, reads the latest filings from six supertanker companies, namelu, Frontline, Scorpio Tankers, International Seaways, Teekay Tankers, DHT, and Nordic American. Finally, it asks the question every reader has: with the stocks at or near 52-week highs, is it too late to buy?
The 60-Second Version#↑ Contents
Here is the whole story on one screen. Prices are from Yahoo Finance, about 9:55 a.m. ET on September 21, 2026.
| Company (ticker) | Q2 2026 net income | Q2 2025 net income | Change | Current Stock Price | Below 52-week high |
|---|---|---|---|---|---|
| Frontline (FRO) | $659.2M | $77.5M | 8.5× | $52.25 | 4.8% |
| Scorpio Tankers (STNG) | $387.5M | $73.5M | 5.3× | $88.76 | 1.4% |
| International Seaways (INSW) | $294.9M | $61.6M | 4.8× | $112.47 | 0.6% |
| Teekay Tankers (TNK) | $225.9M | $62.6M | 3.6× | $101.20 | 1.9% |
| DHT Holdings (DHT) | $198.3M | $56.0M | 3.5× | $23.46 | 0.2% |
| Nordic American Tankers (NAT) | $68.3M | −$0.9M | loss to profit | $8.24 | 1.1% |
| Combined | $1,834.2M | $330.4M | 5.6× |
The eight things that matter:
- This is an inefficiency boom, not a demand boom. With the Strait of Hormuz disrupted, crude is moving through ship-to-ship transfers, around Africa and through bypass pipelines. That ties up ships. Global VLCC loadings are down 27% year over year while the VLCC rate index is up 7.1×, according to Lloyd's List.
- Headline rates are absurd. The Oman-to-China VLCC index Oman-China VLCCThe cost of transmitting a Very Large Crude Carrier (VLCC) From Oman to China printed $870,947 a day in the latest data in our research file, and one ship was placed on subjects at $912,864 a day. A year ago, Frontline's VLCCs earned $37,200 a day.
- Reported earnings sit on a far lower number. Frontline's VLCCs earned $152,700 a day in Q2 and are 86% booked for Q3 at $156,900. That is still four times last year, and it is what pays the dividends. The $900,000 headlines are thin, single-route prints.
- The profits are mostly real cash. Excluding vessel-sale gains, Q2 net income was roughly $1.55 billion. Cash from operations at Teekay, Scorpio and International Seaways ran between 84% and 126% of gain-adjusted first-half profit.
- Balance sheets have flipped. Teekay holds net cash equal to 34.5% of its market value. Scorpio holds 21.8%. Nordic American, the most leveraged of the group, still owes about 16% of its market value.
- Shareholders are being paid, sometimes all of it. Frontline, DHT and International Seaways declared Q2 dividends that, annualized, equal 18% to 21% of the share price. That is the arithmetic of Q2 repeating four times, not a forecast. Teekay and Scorpio retain, buy back stock or pay down debt instead.
- The stocks have already moved. They are +81% to +169% from their 52-week lows and five of six sit within 2% of their highs. They look cheap on Q2 earnings (2.7× to 4.4× EV/EBITDA for most). If earnings merely halve, those multiples double.
- The supply response is coming, but late. Owners have reportedly ordered a record number of VLCCs this year, and deliveries cluster in 2028 and 2029. Clarksons has VLCC earnings falling from $135,000 a day in 2026 to $117,000 in 2027 and $79,000 in 2028.
What's in this report#
- Tanker Stocks in 2026: Record Profits, Record Rates, and Whether It Is Too Late to Buy
- The 60-Second Version
- 1. Why Tankers Are Printing Money: The Hormuz Effect
- 2. Tanker Terms in Plain English
- 3. The Rate Picture: From $37,000 to Over $1 Million a Day
- 4. Q2 2026 Earnings: Six Companies, One Quarter
- 5. How Good Are the Earnings?
- 6. The Balance Sheet Transformation
- 7. Where the Cash Is Going
- 8. Valuation: Cheap, or Just Peak?
- 9. The Supply Problem: The Order Book Is the Clock
- 10. The Bull Case and the Bear Case
- 11. What We Would Do: A Framework for Investors
- 12. Signals to Watch
- Financial Gurkha Takeaways
- Frequently Asked Questions
- About This Analysis
📌 How to read this article. Terms with a small i badge have a plain-English explanation: tap or hover on them. A † in a table means the figure comes from a company press release or earnings-call summary rather than from a filing table we hold. We link every such source. Figures we calculated ourselves are labelled, with the arithmetic shown.
1. Why Tankers Are Printing Money: The Hormuz Effect#↑ Contents
Tanker earnings come down to one ratio: how many ships are available versus how many ships the oil trade needs. In 2026 the trade needs far more ship-days for every barrel it moves, because barrels can no longer take the short way.
The Strait of Hormuz Strait of HormuzA narrow waterway between Iran and Oman, and the only sea exit from the Persian Gulf. In normal times roughly a fifth of the world's oil supply passes through it. has been disrupted since late February 2026, when the US-Iran conflict began, per the timeline we reviewed. An April 8 ceasefire announcement did not restore traffic. Non-Iranian-linked transits reached 97 in the week to September 14, a three-week high, according to USNI News. That is a recovery from a very low base.
1.1 The Timeline#
| Date (2026) | What happened | Source |
|---|---|---|
| Late February | Hormuz disrupted as the conflict begins | Timeline |
| Late March | Brent peaks near $118 a barrel | Timeline |
| April 8 | US-Iran ceasefire announced; ship traffic stays far below pre-war levels | Timeline |
| April to Aug | Ship-to-ship crude flows across Hormuz rise from 603,000 to 4.6 million barrels a day; about 80% of cross-Hormuz exports now use the model | Lloyd's List |
| July 1 | Brent near $70; back above $100 by late July | Timeline |
| Sept 9 | MEG-China VLCC index (TD3C) hits $759,969 a day, 26% above the March peak | Lloyd's List |
| Sept 10 to 11 | Attacks damage pumping stations on Saudi Arabia's East-West pipeline; Saudi Arabia shuts the whole line as a precaution | Al Jazeera |
| Sept 15 | US Energy Secretary Chris Wright calls the closure a brief interruption that will last days | CNBC |
| Sept 18 | Brent closes at $103.87 | Trading Economics |
1.2 The Mechanism: Ships Are Stuck, Not Busy#
If Gulf crude cannot leave in the normal way, it finds another way, and every alternative is slower and uses more ships. A widely circulated explanation, from Biggo Finance, puts it clearly:
Large volumes of crude are no longer shipped directly to the Far East via traditional large tanker routes, but are instead being transshipped through lightering and ship-to-ship transfers. Export cargoes from Saudi Arabia's Yanbu port on the west coast are being diverted in large quantities to Ain Sokhna port at the southern end of the Suez Canal, then piped through the SUMED pipeline to Sidi Kerir port on the Mediterranean for loading. But the pipeline's capacity of 2.4 million to 2.8 million barrels per day is far below Yanbu's export potential..., leaving the remainder dependent on tankers rounding the Cape of Good Hope. — Biggo Finance News
Three terms in that quote matter:
- Ship-to-ship (STS) transfers Ship-to-ship (STS) transferMoving cargo directly between two ships anchored or drifting side by side, instead of loading at a port terminal. Also called lightering when a smaller ship takes cargo from a larger one. It is slow and it ties up both vessels. create waiting time. A VLCC waiting for a cargo to be lightered onto it is a VLCC not available to anyone else.
- The SUMED pipeline SUMED pipelineAn Egyptian pipeline running from Ain Sokhna on the Red Sea to Sidi Kerir on the Mediterranean, letting crude skip the Suez Canal. It moves roughly 2.4 to 2.8 million barrels a day, a fraction of the Gulf's export volume. is a partial bypass. It cannot take the volume, so the rest goes by sea.
- Ships routed around the Cape of Good Hope Cape of Good Hope routeThe sea route around the southern tip of Africa. It adds roughly 10 to 14 days of sailing each way compared with the Suez Canal route between Europe and Asia. spend longer at sea for the same delivery. That raises ton-mile demand Ton-mile demandThe volume of cargo multiplied by the distance it travels. Longer routes raise ton-miles even when the number of barrels stays flat, and a tanker's earning power tracks ton-miles more closely than it tracks barrels. without a single extra barrel being shipped.
1.3 The Paradox: Volumes Down, Rates Up#
The Lloyd's List data shows how strange this market is. Middle East Gulf exports are down 36% from pre-crisis levels, averaging 11.8 million barrels a day in August. Global VLCC loadings are down 27% from a year ago. Yet the VLCC rate index is up 7.1×.
That is what an inefficiency boom looks like: fewer barrels, but each barrel needs more ship time and the usable fleet is smaller. Ships are also being drawn east toward higher Gulf-of-Oman rates, which leaves Atlantic tonnage scarce. That is why West Africa-to-China and US Gulf-to-China rates rose along with Middle East rates.
Frontline's chief executive described the driver as "vessel inefficiency" on its Q2 call, according to the call summary, and did not put a duration on it.
Why this matters for investors. The earnings you are buying are a rent on a geopolitical bottleneck, not a reflection of growing oil demand. That does not make them fake. It makes them conditional. When the bottleneck eases, the excess rate disappears faster than the underlying demand would have suggested. We come back to this in the bear case.
2. Tanker Terms in Plain English#↑ Contents
Tanker filings are written in a dialect. Here is the part you need.
2.1 The Ships#
| Class | Approx. cargo size | Carries | Who owns them (from this group) |
|---|---|---|---|
| VLCC VLCCVery Large Crude Carrier. About 300,000 deadweight tonnes, carrying roughly 2 million barrels of crude. The largest ships in regular crude service and the ones behind the $900,000-a-day headlines. | about 2 million barrels | Crude oil, long-haul | FRO, DHT, INSW, TNK |
| Suezmax SuezmaxSized to transit the Suez Canal fully loaded. Carries roughly 1 million barrels of crude, and is the workhorse of Atlantic and Black Sea trades. | about 1 million barrels | Crude oil, medium-haul | NAT (pure play), FRO, INSW, TNK |
| Aframax / LR2 Aframax and LR2An Aframax carries roughly 600,000 to 750,000 barrels of crude. The LR2 (Long Range 2) is the same size class built for refined products. Frontline and Teekay report the two together. | about 600,000 to 750,000 bbl | Crude (Aframax), products (LR2) | FRO, TNK, STNG, INSW |
| MR / Handymax MR and HandymaxMR (Medium Range) tankers carry roughly 300,000 barrels of refined products such as gasoline, diesel and jet fuel. Handymax and other small product tankers are smaller still. | about 300,000 barrels and below | Refined products ("clean") | STNG, INSW |
Crude tankers are sometimes called "dirty" and product tankers "clean", after the cargo. The two markets move differently, which matters later.
2.2 How Tankers Get Paid#
| Contract | How it works | Who takes the risk |
|---|---|---|
| Spot market (voyage charter) Spot market (voyage charter)The ship is hired for one voyage at the going rate. The owner pays fuel, port fees and canal tolls, and keeps whatever is left. Spot earnings rise and fall with the market by the day. | Hired trip by trip at today's price | Owner keeps all the swing |
| Time charter Time charterThe customer hires the ship for a fixed period, often one to five years, at a fixed daily rate, and pays fuel and port costs. The owner pays crew, insurance and repairs. | Fixed daily rate for months or years | Locks in a price |
| Bareboat charter Bareboat charterThe ship is leased without a crew, like renting an empty building. The customer runs and crews it. Rates are lower and steadier. | Long lease, customer operates | Lowest owner risk |
| Tanker pool Tanker poolA group of similar ships from different owners marketed together by one manager. Earnings are shared by a formula, so no owner depends on a single voyage. International Seaways earns 55% of its revenue from pools. | Pooled earnings, shared by ship | Spread across the pool |
The mix decides how much of a rate spike reaches shareholders. Frontline earned 95% of its Q1 2026 fleet income from spot trading ($509.6 million of $536.5 million). That is why it moves the most when rates move. DHT has roughly half its Q3 VLCC days on term contracts, which cushions it in both directions.
2.3 The Numbers That Matter#
- Time charter equivalent (TCE) per day Time charter equivalent (TCE)A standard way to compare ship earnings across different trades. It is voyage revenue minus voyage costs (fuel, port fees, canal tolls), divided by days on hire. A TCE of $100,000 a day means the ship earns $100,000 a day after paying to move the cargo, before crew, insurance, interest and depreciation. is the headline. Every rate in this article is a TCE unless labelled otherwise.
- Net voyage revenue Net voyage revenueVoyage revenue less voyage expenses. Nordic American reports $104.7 million of voyage revenue and $25.4 million of voyage expenses in Q2, leaving $79.3 million of net voyage revenue. It is the same idea as TCE in dollar terms rather than per day. is the total dollar version.
- Cash breakeven Cash breakevenThe daily rate a ship must earn to cover its operating costs, interest and overhead. Frontline's 12-month average is $23,800 for a VLCC, $25,700 for a Suezmax and $22,200 for an LR2 or Aframax. Everything above it is profit or cash for shareholders. tells you how much cushion there is when rates fall.
- Vessel operating expenses (opex) Vessel operating expenses (opex)The cost of running a ship whether or not it earns anything: crew, insurance, maintenance, spares and lubricants. Scorpio's fleet averaged $8,394 a day in Q2, and Nordic American has reported costs below $10,000 a day. are small next to today's rates.
- Drydocking DrydockingA scheduled inspection and repair with the ship out of the water, needed roughly every five years. It costs money and takes the ship off hire, so it is a real cash expense that sits outside the daily operating cost. and off-hire days Off-hire daysDays when a ship earns nothing because it is in drydock, being repaired, or otherwise unavailable. Spot days are counted as available days minus off-hire days. are the other cash costs.
- Operating leverage Operating leverageThe way a fixed cost base turns a small change in revenue into a big change in profit. A tanker costs about the same to run at $30,000 a day as at $150,000 a day, so almost every extra rate dollar falls to profit. is the whole story of this sector. Using Frontline's Q1 spot days (6,212 a quarter), our calculation is that every $10,000-a-day change in fleet-wide spot rates moves quarterly income by about $62 million, or about $0.28 a share.
3. The Rate Picture: From $37,000 to Over $1 Million a Day#↑ Contents
3.1 What Frontline Actually Earned#
The cleanest primary evidence we have on how fast rates rose is Frontline's own table. This is from its Q1 2026 filing, extended with the Q2 and Q3 figures from its Q2 results release.
| Spot TCE per day | Q1 2025 | Q4 2025 | Q1 2026 | Q2 2026 † | Q3 2026, booked to date † |
|---|---|---|---|---|---|
| VLCC | $37,200 | $74,200 | $103,500 | $152,700 | $156,900 (86%) |
| Suezmax | $31,200 | $53,800 | $72,400 | $111,500 | $117,400 (79%) |
| LR2 / Aframax | $22,300 | $33,500 | $50,700 | $92,400 | $81,000 (70%) |
Frontline's VLCC earnings are up 4.1× from Q1 2025 to Q2 2026. Total fleet earnings (TCE) in Q1 2026 were $536.5 million against $241.1 million a year earlier, and the crisis only began in late February, so that quarter captured about five weeks of it.
Notice the last row. The LR2 and Aframax class is booked lower for Q3 ($81,000) than it earned in Q2 ($92,400). The smaller ships are softening while VLCCs keep climbing. We see this again in the other companies' Q3 data.
3.2 Four Ways to Count a VLCC Day#
This section is generated with Claude AI. Please write the author at contact@kanchanksharma.com for issues.
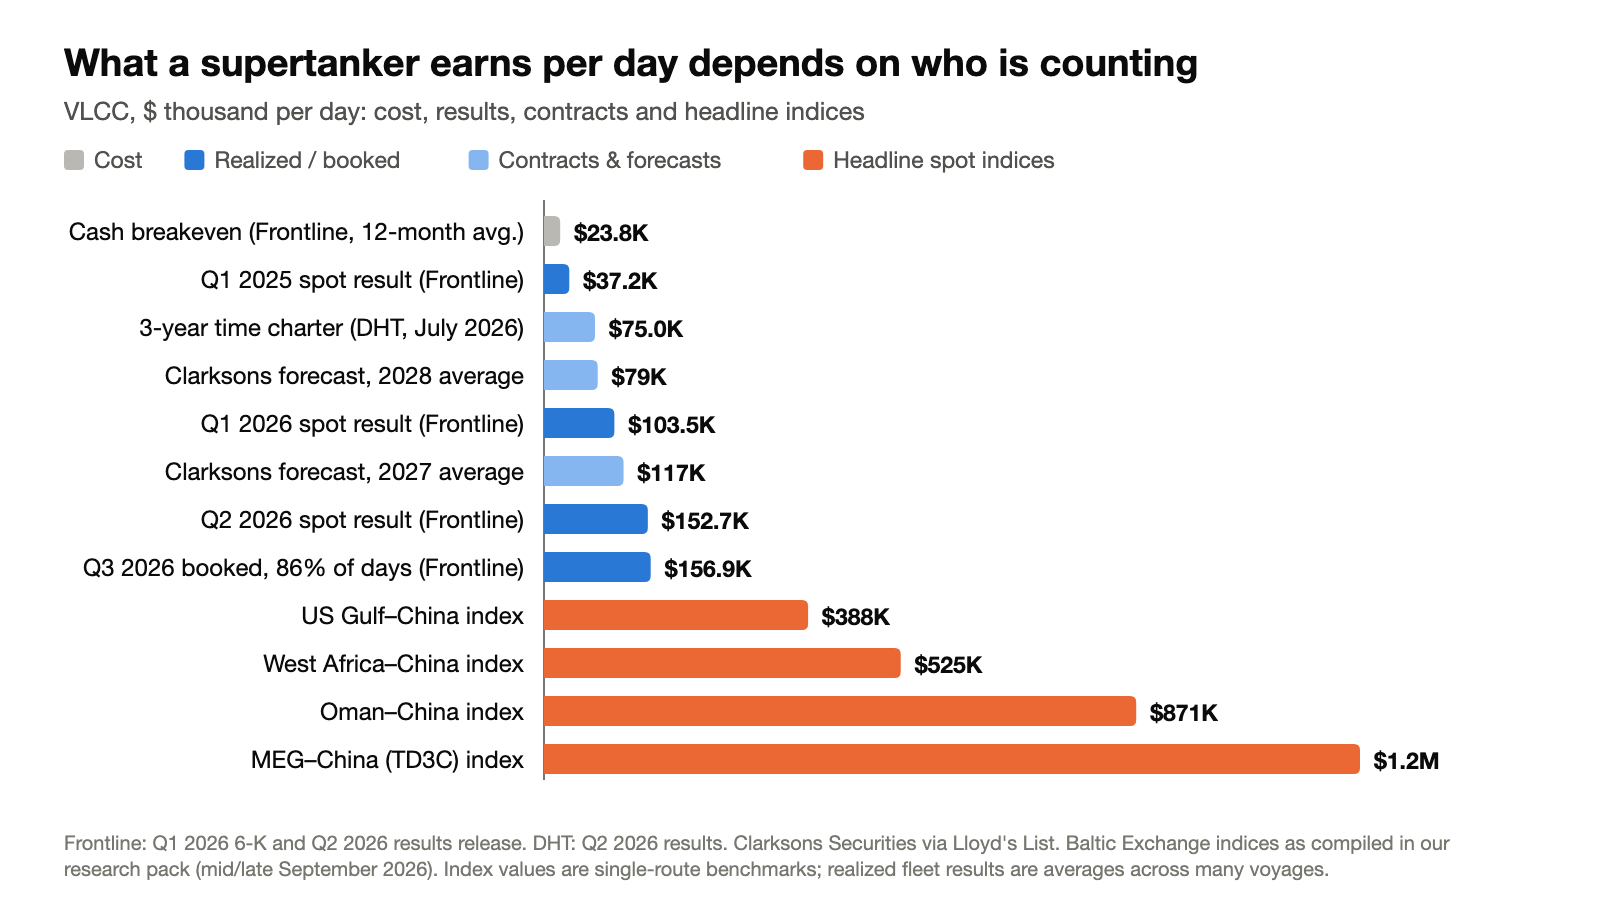
A VLCC's day rate depends on who is counting. Sources: Frontline (breakeven, spot results, Q3 bookings), DHT (three-year charter), Clarksons Securities via Lloyd's List, Baltic Exchange indices as compiled in our research file. Chart by Financial Gurkha.
The chart shows four different measures of the same ship:
- Cost (grey). What it takes to break even: about $24,000.
- Realized and booked results (blue). What Frontline's ships actually earned or have fixed: $103,500 in Q1, $152,700 in Q2, $156,900 for the booked part of Q3.
- Contracts and forecasts (light blue). A three-year charter at $75,000. Clarksons Securities forecasts of $117,000 for 2027 and $79,000 for 2028.
- Headline spot indices (orange). The Baltic Exchange Baltic ExchangeA London-based shipping market body that publishes daily route-by-route freight assessments. Its numbers are the reference prices the industry quotes. route assessments, from $388,000 (US Gulf to China) to $1.2 million (TD3C TD3CThe Baltic Exchange's benchmark route for VLCCs carrying crude from the Middle East Gulf to China. It is the most-watched number in the crude tanker market.).
Only the blue bars pay dividends. The orange bars are real, but they describe a small number of cargoes on specific routes at specific moments. When a ship is placed on subjects (subs) On subjects (subs)A fixture that has been agreed but is still subject to conditions, such as the charterer's approvals or the ship passing a vetting inspection. Most subjects are lifted, but not all, so a rate on subs is not yet a done deal. at $912,864 a day, one cargo has been priced. It has not become the fleet average.
3.3 Why the Headline Still Matters#
The headline is not noise. It tells you what the unbooked days of the quarter are worth right now.
DHT's Q2 release (the outlook table in our research file) shows the mechanics. For Q3 it has 1,029 spot VLCC days, of which 600 (58%) are booked at an average of $152,700. That leaves 429 days open. Our calculation: if those open days fix $100,000 a day above the booked rate, they add $42.9 million, or about $0.27 a share on DHT's roughly 161 million shares (Yahoo's market cap divided by price). If the open days fix at headline rates of several hundred thousand dollars, the upside is meaningful. If the market falls back to booked levels, it is zero.
3.4 What the Forward Market Is Saying#
Three forward signals point the same way, and they are more interesting than the spot number.
- Term rates are far below spot but far above history. In July, DHT agreed a three-year time charter at $75,000 a day on a 2015-built VLCC with a global energy company, starting in September. Frontline's VLCCs earned $37,200 a day in Q1 2025.
- The forward paper agrees. Frontline's CEO said on the Q2 call that the long-term market "is actually starting to price in these disruptions to last for much longer," and that US Gulf-to-Asia forward freight agreements for 2028 traded near $100,000 a day, per the call summary. This is secondary and we have not seen the underlying forward freight agreement (FFA) Forward freight agreement (FFA)A financial contract that lets traders lock in or bet on a future freight rate on a specific route without owning a ship. Its price is the market's consensus view of where rates will be. quotes.
- Analysts have re-based. Clarksons Securities raised its 2026 VLCC forecast from $75,000 to $135,000 a day, 2027 from $60,000 to $117,000, and put 2028 at $79,000, assuming Hormuz stays disrupted until mid-2027 and restocking demand carries into 2028, per Lloyd's List.
Read together: the market expects the extreme to fade, yet it does not expect a return to the $37,000 world. It is pricing a high plateau that erodes. That is a reasonable forecast. It is also exactly what the stocks now reflect.
4. Q2 2026 Earnings: Six Companies, One Quarter#↑ Contents
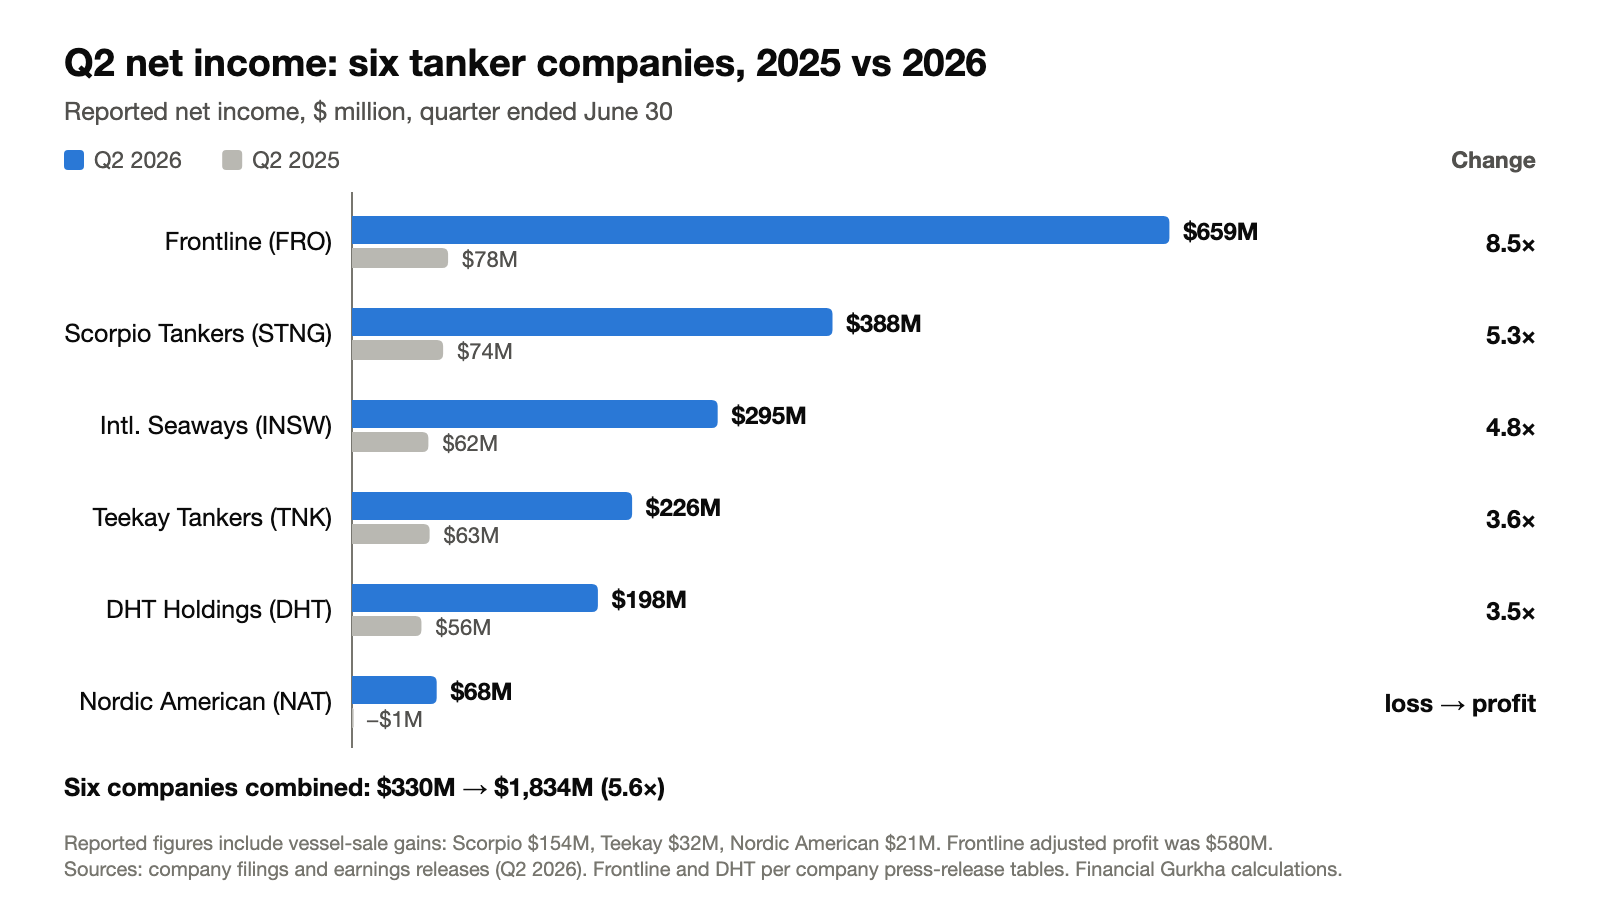
Reported net income, quarter ended June 30. Includes vessel-sale gains, which we strip out in Section 5. Chart by Financial Gurkha.
Each company below gets the same treatment: what the filing says, then what we notice.
4.1 Frontline (FRO)#
What it says (from the Q2 release):
- Reported profit $659.2 million ($2.96 a share), against $77.5 million. Adjusted profit $580.2 million ($2.61 a share).
- Revenue $943.3 million, up 96.5%.
- Q3 booked: VLCC 86% at $156,900; Suezmax 79% at $117,400; LR2 and Aframax 70% at $81,000.
- Liquidity of $1.2 billion. Weighted-average interest margin cut from 178 to 126 basis points after refinancing. No meaningful debt maturities until 2030.
- Sold two 2017-built VLCCs for $270 million in July. Declared a Q2 dividend of $2.61 plus a $0.80 special from the sale proceeds.
- Nine newbuildings still to be paid for ($601.1 million), with financing of up to $737 million secured. Fleet: 40 VLCCs, 19 Suezmaxes and 18 LR2 or Aframax ships, 6.6 years old on average.
What we notice. Frontline is the purest spot play in the group and management is open about the payout policy: on the Q2 call, its CEO described the proposition to investors as being to "pay everything out." The dividend equals adjusted earnings per share to the cent. The trade-off is that nothing is retained, so the balance sheet does not grow with the profits. We did not have Frontline's balance sheet in our research file, so we cannot give a net-debt figure. Take note of the LR2 and Aframax softening in the Q3 bookings.
4.2 Scorpio Tankers (STNG)#
What the filing says (Q2 2026 results):
- Vessel revenue $408.7 million (from $230.2 million). Net income $387.5 million (from $73.5 million), including a $154.1 million gain on vessel sales and a $13.8 million fair-value gain. Company-adjusted net income was $243.7 million †.
- Adjusted EBITDA $300.5 million, against $144.5 million.
- Fleet TCE per day $52,661, against $25,569: LR2 $58,959, MR $49,551, Handymax $47,327. Operating cost was $8,394 a day per ship.
- Average fleet 84.5 ships, against 99.0 a year ago. General and administrative cost was $46.6 million, up 57%.
- Six-month cash flow: sold vessels for $674.3 million, repaid $428.4 million of debt, raised $628.6 million from convertible notes due 2031 Convertible notesBonds that pay interest but can be swapped for company shares at a preset price. They are cheap financing for the company, but if the shares rise enough, holders convert and the share count grows, diluting existing owners., and bought back $155 million of stock. Cash rose to $1.84 billion.
Q3 update. Scorpio's September 3 6-K shows Q3 bookings of $64,900 a day for LR2 (85% booked), $30,000 for MR (79%) and $25,500 for Handymax (70%). It also shows three new three-year time charters: two LR2s at $40,188 and $42,500 a day, and one MR at $23,900.
What we notice. Scorpio is a product-tanker company and its Q3 tells a different story from the crude names. Its MR rate is down 39% from Q2 and its Handymax rate is down 46%. Only its LR2s are still rising, up 10%. The company is also fixing two LR2s for three years at $40,188 and $42,500 a day, 35% to 38% below the $64,900 it has booked for LR2s this quarter, and an MR at $23,900. Owners are choosing to lock a slice of the fleet for years at a steep discount to spot. The convertible notes add to the share count: diluted shares were 53.5 million against 45.7 million basic, a 17% gap.
4.3 International Seaways (INSW)#
What the filing says (Form 10-Q for the quarter ended June 30, 2026, in our research file):
- Shipping revenue $467.3 million (from $195.6 million). Pool revenue $255.5 million (55%), time charter $88.6 million, voyage charter $123.1 million.
- Income from vessel operations $301.3 million. Net income $294.9 million (from $61.6 million). Diluted EPS $5.91 (from $1.25). First-half net income $581.1 million.
- Vessel operating cost was lower than a year ago ($63.6 million against $67.4 million).
- First-half cash from operations $408.7 million. Dividends paid $331.8 million, against $64.1 million a year earlier. Voyage receivables rose by $128.8 million.
Per the Q2 call summary †: Q2 spot earnings were $118,900 for VLCCs, $100,500 for Suezmaxes and $69,100 for Aframaxes. A $5.05 dividend was declared, returning at least 85% of adjusted net income. Net loan-to-value is 6%, with liquidity of about $935 million. As of July 30, 48% of Q3 spot days were booked at a blended $61,000 a day, including $118,300 for VLCCs and $91,800 for Suezmaxes.
What we notice. International Seaways is the most diversified of the group, spanning crude and products, with over half its revenue from pools. That smooths its results and dampens its upside. Its booked VLCC rate ($118,300) is well below Frontline's ($156,900), but the booking date was July 30, three weeks earlier in a fast-rising market, so we would not read it as a competitive gap. Its earnings are also the most "clean": a loss of $43,000 on vessel disposals in Q2, effectively no one-off gains.
4.4 Teekay Tankers (TNK)#
What the filing says (Form 6-K, Q2 2026 statements in our research file):
- Revenue $379.5 million (from $232.9 million), 79% of it voyage charters. Income from operations $222.0 million (from $55.0 million), including a $32.3 million gain on asset sales.
- Net income $225.9 million (from $62.6 million). Diluted EPS $6.47. First-half net income $379.5 million, or $10.87 a share.
- Interest income $10.4 million in the quarter, about 4.6% of net income, earned on the cash pile.
- Balance sheet at June 30: cash $735.0 million plus short-term investments $476.6 million. Total liabilities $216.1 million against equity of $2.38 billion.
- First-half cash from operations $364.3 million. Dividends paid $52.0 million, or 14% of net income.
- Dividends declared: $1.25 a share in Q2 (against $0.25 in Q1).
Per the Q2 slides summary †: adjusted net income of $193.6 million ($5.56 a share), which reconciles with the filing (reported $225.9 million less the $32.3 million gain). Q2 spot rates were $123,200 for VLCCs, $109,200 for Suezmaxes and $74,100 for Aframax and LR2. With 44% of Q3 spot days booked, Suezmax is at $104,800 (down 4% from Q2) and Aframax and LR2 at $59,900 (down 19%).
What we notice. Teekay is the fortress balance sheet. Cash and short-term investments of $1.21 billion come to about $34.90 a share, or 34.5% of the $101.20 share price, with almost no debt. It retains most of what it earns, and the $10.4 million of quarterly interest income is now a visible line in its income statement. It has also put down $33.4 million in advances on newbuilding contracts, a small signal that even the most disciplined owner is adding to future supply.
4.5 DHT Holdings (DHT)#
What the release says (DHT's August 5 Q2 release, in our research file):
- Shipping revenue $284.8 million. Adjusted EBITDA $231.0 million. Profit after tax $198.3 million. EPS $1.23. Dividend $1.22.
- "The second quarter of 2026 was the strongest quarter in the Company's history." First-half profit, $362.8 million (our sum of $164.5 million and $198.3 million), already beat DHT's previous record full year of $266.3 million in 2020.
- Interest-bearing debt $434.8 million, cash $161.7 million, net debt $273.1 million.
| Quarter | Profit after tax | EPS | Dividend | Net debt |
|---|---|---|---|---|
| Q2 2025 | $56.0M | $0.35 | $0.24 | $220.1M |
| Q3 2025 | $44.8M | $0.28 | $0.18 | $187.3M |
| Q4 2025 | $66.1M | $0.41 | $0.41 | $349.7M |
| Q1 2026 | $164.5M | $1.02 | $0.64 | $379.1M |
| Q2 2026 | $198.3M | $1.23 | $1.22 | $273.1M |
Q3 and after. DHT expects 1,020 term days at $75,900 and 1,029 spot days, 600 booked at $152,700. It took delivery of its fourth and final 2026 VLCC newbuilding, DHT Impala, on July 24, and sold the 2007-built DHT Bauhinia for $51.0 million of net proceeds, a $34.2 million gain.
What we notice. The table shows the ramp in one glance: profit went from $44.8 million to $198.3 million in three quarters. DHT pays out nearly everything (a $1.22 dividend on $1.23 of EPS), so the dividend rose from $0.18 to $1.22 in the same period. Net debt fell by $106 million in the quarter. The term contracts are the difference between DHT and Frontline: roughly half of Q3 VLCC days are fixed at $75,900, which gives DHT less torque in a rising market and more floor in a falling one.
4.6 Nordic American Tankers (NAT)#
What the filing says (Q2 2026 statements in our research file):
- Voyage revenue $104.7 million; net voyage revenue $79.3 million (from $40.2 million, but only 2.3% above Q1's $77.5 million).
- Other income $14.6 million, loss-of-hire insurance proceeds Loss-of-hire insuranceInsurance that pays an owner the income a ship would have earned while it is out of service after an incident or a disruption. Recoveries show up as income but do not represent normal trading.. Gain on vessel disposals $21.3 million.
- Net income $68.3 million (against a $0.9 million loss). EPS $0.32. Adjusted EBITDA $67.6 million.
- Balance sheet: cash $133.3 million, debt $406.6 million ($35.4 million current plus $371.2 million long-term), equity $477.6 million. Shares outstanding: 211,750,663, unchanged.
Per company reporting †: a $0.27 dividend, its 116th consecutive payout; Q2 TCE around $63,000 a day; 75% of Q3 booked at roughly $54,000 a day.
What we notice. Nordic American is the stock most people know from the group and it is the one that looks least like the others. Net voyage revenue barely rose from Q1 to Q2, and the Q3 booked rate is about 14% below Q2's realized rate. Stripping out the $21.3 million vessel gain and the $14.6 million insurance recovery, Q2 net income is about $32.4 million, or roughly $0.15 a share. Its realized Suezmax earnings, if we take the reported $63,000 a day, are well below the $109,200 Teekay and $111,500 Frontline report for the same class, which suggests either a different trading pattern or more fixed-rate cover. We cannot tell which from the documents we hold. What we can say is that it is the highest-priced stock in the group relative to what it earns, as Section 8 shows.
5. How Good Are the Earnings?#↑ Contents
Record profit is not the same as record recurring profit. Two questions decide how much of the $1.83 billion is durable: how much came from selling ships, and did it turn into cash?
5.1 One-Off Gains#
Almost every company sold old ships at high prices during the quarter, and the gain counts as profit.
| Company | Q2 reported net income | Vessel-sale gains (Q2) | Q2 net income ex-gains |
|---|---|---|---|
| FRO | $659.2M | $79.0M of adjustments † | $580.2M † |
| STNG | $387.5M | $154.1M | $233.4M |
| INSW | $294.9M | none (a $43K loss) | $294.9M |
| TNK | $225.9M | $32.3M | $193.6M |
| DHT | $198.3M | not in our file | $198.3M |
| NAT | $68.3M | $21.3M | $47.0M |
| Total | $1,834M | about $1,547M |
Our calculation: 580.2 + 233.4 + 294.9 + 193.6 + 198.3 + 47.0 = $1,547.4 million. Frontline uses its own adjusted figure; the others are reported net income less the disclosed vessel-sale gain. Scorpio's own adjusted figure, $243.7 million, is slightly higher because it also strips out other items.
So roughly $290 million, about 16% of reported profit, is one-off. The underlying six-company total is closer to $1.55 billion, still 4.7 times last year's reported $330 million. The boom is real even after the adjustment.
5.2 Did It Turn Into Cash?#
For the three companies whose cash-flow statements are in our research file, we compared first-half cash from operations with net income after removing vessel-sale gains.
| First half 2026 | Net income | Vessel gains removed | Net income ex-gains | Cash from operations | Cash ÷ ex-gain income |
|---|---|---|---|---|---|
| Teekay (TNK) | $379.5M | $54.9M | $324.5M | $364.3M | 112% |
| Scorpio (STNG) | $603.8M | $220.1M | $383.7M | $483.5M | 126% |
| Intl. Seaways (INSW) | $581.1M | $92.0M | $489.0M | $408.7M | 84% |
Our calculation from the six-month cash-flow statements. Intl. Seaways' removed gains are its $88.1 million disposal gain plus a $3.9 million gain on a previously held equity interest.
Teekay and Scorpio converted more than 100% of underlying profit into operating cash. International Seaways converted 84% because its voyage receivables grew by $128.8 million as revenue tripled: profit it has earned but not yet collected. That is normal for a fast-growing business and it should reverse.
The earnings are real and cash-backed, and about 84% of the headline profit is not a one-off. Whether current rates last is a different question, and it is the one the market is debating.
6. The Balance Sheet Transformation#↑ Contents
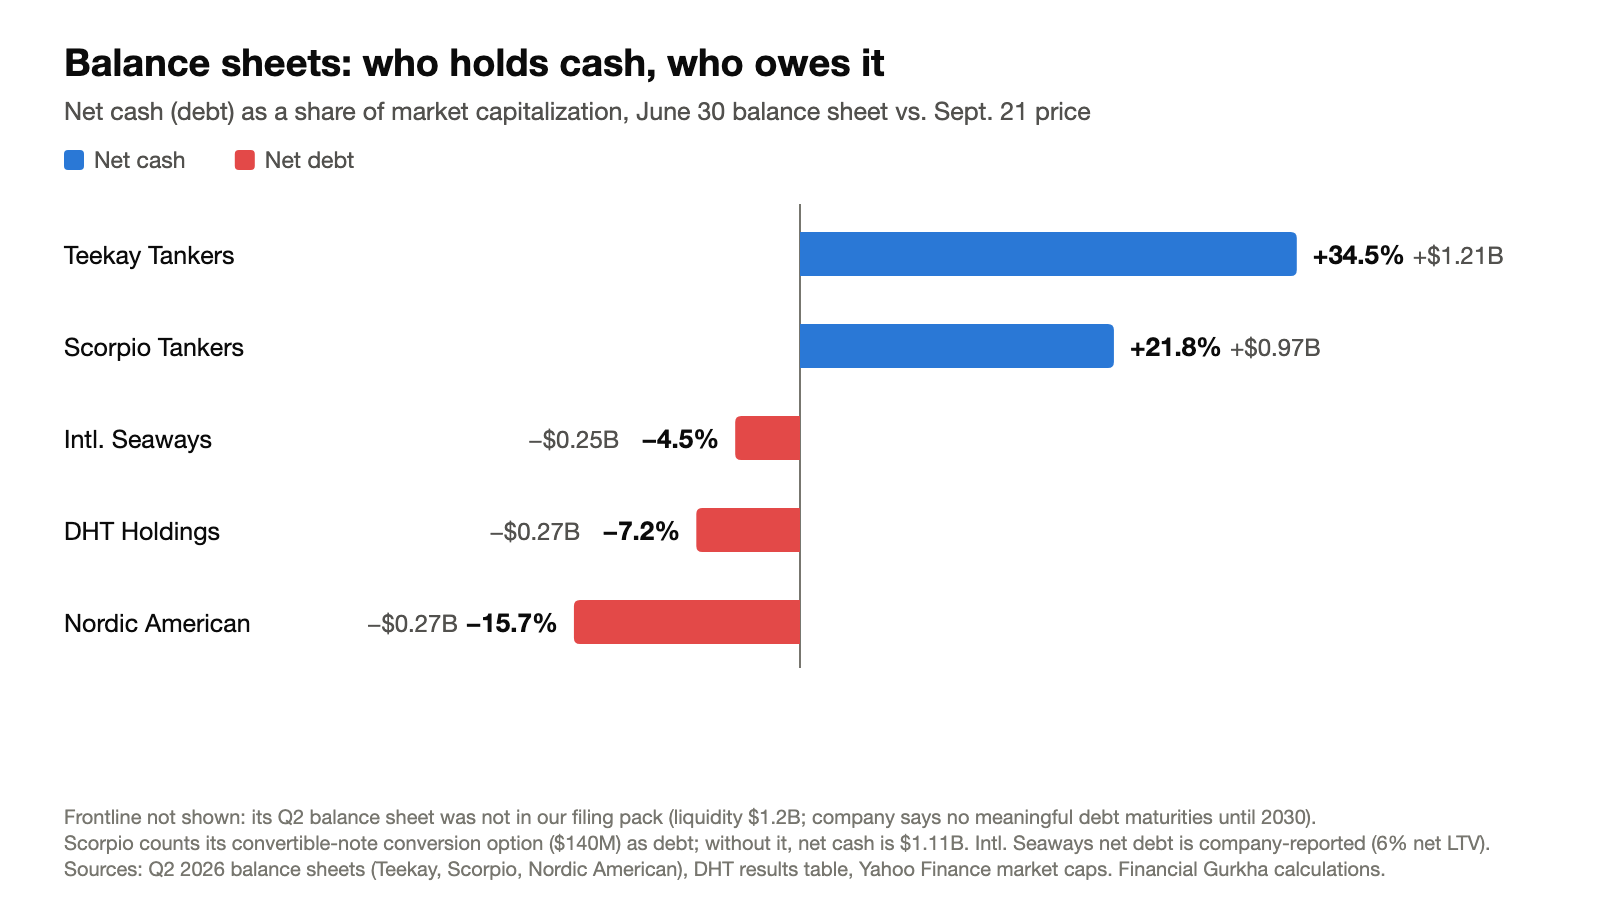
Net cash (debt) is cash and short-term investments less debt, as of June 30. Market capitalization is as of September 21. Frontline is not shown because its balance sheet was not in our filing pack. Chart by Financial Gurkha.
Shipping has a long history of booms funded with debt and busts settled with restructurings. This time, the earnings have gone into the balance sheet first.
- Teekay has no debt and holds $1.21 billion in cash and short-term investments. Its total liabilities are 9% of its equity.
- Scorpio raised cash to $1.84 billion from $752 million at year-end, an increase of $1.09 billion in six months. Against that it holds $729 million of debt plus a $140 million liability for the conversion feature in its convertible notes. Counting that liability as debt, net cash is about $0.97 billion.
- International Seaways reports a net loan-to-value Net loan-to-value (net LTV)Net debt divided by the market value of a shipping company's fleet. A low figure means lenders are well covered even if ship values fall. Many shipping loans require it to stay below a set ceiling. of 6%, with about $250 million of net debt against roughly $4 billion of vessel value †.
- DHT cut net debt from $379.1 million at Q1 to $273.1 million, about 0.3 times its annualized Q2 EBITDA.
- Nordic American owes $406.6 million, down from $424.1 million at year-end, with cash up to $133.3 million. That is still 16% of its market value.
- Frontline reports $1.2 billion of liquidity, a cut in its financing margin of 52 basis points and no meaningful maturities until 2030 †.
The point for investors: default risk, the main historical killer of tanker stocks, is almost absent at the moment. The downside in this cycle comes from earnings and multiples, not from lenders.
7. Where the Cash Is Going#↑ Contents
The six companies have six different policies. Understanding them matters more than the headline yield. Three ideas do the work: the payout ratio Payout ratioThe share of profit paid out as dividends. A 100% payout means everything earned is distributed, which leaves nothing to rebuild the balance sheet or fund new ships., whether a dividend is fixed or variable Variable dividendA dividend set as a share of each quarter's earnings rather than a fixed amount. It rises quickly in a boom and falls just as quickly in a downturn., and the alternative of buying back stock.
| Company | Latest quarterly dividend | Payout vs Q2 EPS | Annualized (Q2 × 4) | Yield at Sept 21 | How it returns cash |
|---|---|---|---|---|---|
| FRO | $2.61 (+ $0.80 special) | 100% of adjusted EPS | $10.44 | 20.0% | Pays everything out |
| DHT | $1.22 | 99% of EPS | $4.88 | 20.8% | Pays nearly everything out |
| INSW | $5.05 † | at least 85% of adjusted income | $20.20 | 18.0% | Variable payout of at least 85% |
| NAT | $0.27 † | 84% of EPS | $1.08 | 13.1% | Fixed-style quarterly dividend, raised this quarter |
| TNK | $1.25 (Q2) | 22% of adjusted EPS | $1.00 to $5.00 | 1.0% to 4.9% | $0.25 regular plus variable extras; retains cash |
| STNG | $0.45 † | about 10% of adjusted EPS | $1.80 | 2.0% | Small dividend; $155M buyback and $428M of debt repaid in H1 |
Our calculation. "Annualized" simply multiplies the latest quarterly dividend by four, and Teekay's range shows the regular $0.25 dividend against a repeat of Q2's $1.25. Yields use Sept 21 prices. Check each company's ex-dividend date before buying: a price just before a large dividend is a very different entry from a price just after it.
⚠️ Do not read a 20% yield as income. The Q2 dividends from Frontline, DHT and International Seaways are set as a share of earnings. When earnings fall, the dividend falls with them, one for one. Annualizing the best quarter in each company's history produces a number that describes a peak, not a plan. DHT's own table shows how fast it moves: $0.18 in Q3 2025, $1.22 in Q2 2026.
7.1 What Owners Are Doing With Ships#
Company behavior is a signal, and here it is consistent. Across Teekay, Scorpio and International Seaways, first-half cash flow shows:
- $1.02 billion received from selling vessels ($674.3 million Scorpio, $222.4 million International Seaways, $125.3 million Teekay).
- $0.29 billion spent on buying ships or paying newbuilding installments (our sum of the vessel-acquisition, newbuilding-advance and vessel-capex lines for the three companies).
Frontline sold two VLCCs for $270 million and DHT sold a 2007-built ship, while both keep taking delivery of newbuildings. The pattern is fleet renewal: sell old tonnage at cycle-high prices and replace it with fewer, newer ships. It is sensible, and it also means that in the three filings we hold, the people who know these assets best are net sellers of ships at the top of the market.
8. Valuation: Cheap, or Just Peak?#↑ Contents
Valuation answers one question: is the price you would pay today high or low compared with what the company earns?
For tanker stocks there is a second, harder question hiding behind it: will those earnings last? A stock can look very cheap on this quarter's profit and still be expensive if the quarter turns out to be a one-off. This section takes both questions slowly, one step at a time.
8.1 The Numbers, in Plain English#
Imagine you are buying a rental property instead of a stock. You would ask what it costs, how much rent it brings in each year, whether it comes with a mortgage or with cash in the bank, and how the price compares with the paperwork value of the building. Each number below answers one of those questions.
| Number | Plain-English meaning | Rental-property version | How to read it |
|---|---|---|---|
| Market cap Market capitalizationThe share price multiplied by the number of shares. It is the price of the whole company at the stock market's current valuation. | The price of every share added together | The asking price of the whole building | A measure of size, not of cheapness |
| P/E ratio P/E ratio (price-to-earnings)The share price divided by the profit earned per share. It tells you how many years of current profit it takes to pay back the price. Lower means cheaper, all else equal. | Share price divided by profit per share | Price divided by one year of rent after costs | Lower is cheaper. A P/E of 5 means the profit would repay your price in about 5 years |
| Net cash Net cash (or net debt)Cash and short-term investments minus borrowings. If the result is positive, the company owns more cash than it owes (net cash). If negative, it owes more than it holds (net debt). | Cash minus debt | Money in the bank minus the mortgage | Positive means more cash than debt |
| Enterprise value (EV) Enterprise value (EV)Market capitalization minus net cash (or plus net debt). It is the price of the business itself, once the cash inside it and the debt on it are counted. | Market cap, adjusted for cash and debt | The true price of the building after counting the cash inside it and the mortgage on it | What a buyer of the whole business really pays |
| EV/EBITDA EV/EBITDAEnterprise value divided by EBITDA, which is operating profit before interest, taxes and depreciation. It shows how many years of operating profit it would take to pay for the whole business. Lower means cheaper. | EV divided by a year of operating profit | Price divided by the rent before mortgage and taxes | Lower is cheaper. A 3 means about 3 years of operating profit would pay for the whole business |
| Price-to-book (P/B) Price-to-book (P/B)The company's market cap divided by shareholders' equity, which is the accounting value of its assets minus its debts. Tanker fleets are carried at depreciated cost, so book value can understate what the ships are worth. | Market cap divided by the accounting value of assets after debt | Price compared with the paperwork value of the property | Near 1 means you pay about book value. Above 1 means you pay a premium |
One what-if runs through the whole section. Every "if Q2 repeats" figure below takes the second quarter and multiplies it by four, as if that quarter happened four times in a row. That is called annualizing AnnualizingMultiplying one quarter's result by four to get a full-year figure. It assumes the quarter repeats, so it is a what-if and not a forecast. For a business at a record high, it flatters the answer.. It is not a forecast. It shows what the price looks like if the boom simply carries on at Q2's pace.
8.2 A Worked Example: Teekay Tankers#
Numbers are easier to understand once you have followed one company all the way through. Here is Teekay, step by step.
- Market cap. The share price is $101.20 and there are about 34.7 million shares. $101.20 × 34.7 million = $3.51 billion.
- P/E if Q2 repeats. Q2 profit per share, excluding one-off ship-sale gains, was $5.56. Four times that is $22.24 a year. $101.20 ÷ $22.24 = 4.6. In words: if Q2 kept repeating, Teekay's profit would repay the share price in about 4.6 years. Turned around, the stock would earn 22% of its price every year.
- Net cash. Teekay holds $1.21 billion of cash and short-term investments and has no borrowings, so its net cash is $1.21 billion. That is about a third of the $3.51 billion market cap.
- Enterprise value. $3.51 billion minus $1.21 billion = $2.30 billion. That is what you are really paying for the ships and the business once the cash is set aside.
- EV/EBITDA if Q2 repeats. Q2 operating profit before depreciation and one-off gains was about $210.5 million. This is our calculation from the income statement: $222.0 million operating income, plus $20.8 million depreciation, minus the $32.3 million ship-sale gain. Four times that is $842 million a year. $2.30 billion ÷ $842 million = 2.7. In words: about 2.7 years of Q2-pace operating profit would pay for the entire business.
- Price-to-book. Shareholders' equity is $2.38 billion, so $3.51 billion ÷ $2.38 billion = 1.48. You pay about 1.5 times the accounting value of the assets.
Why two measures, P/E and EV/EBITDA? Because they answer slightly different questions. P/E asks what the shares cost for each dollar of profit. EV/EBITDA asks what the whole business costs for each dollar of operating profit, and it treats a company with a mountain of cash (Teekay) and a company with heavy debt (Nordic American) fairly. Cash-rich companies look cheaper on EV/EBITDA than on P/E.
8.3 The Scorecard#
Here is the same six-step calculation for all six companies.
| Company | Price, Sept 21 | Market cap | P/E if Q2 repeats | EV/EBITDA if Q2 repeats | Net cash (debt) as % of market cap |
|---|---|---|---|---|---|
| Teekay Tankers (TNK) | $101.20 | $3.51B | 4.6 | 2.7 | +34.5% |
| Scorpio Tankers (STNG) | $88.76 | $4.45B | 4.9 | 2.9 | +21.8% |
| Intl. Seaways (INSW) | $112.47 | $5.57B | 4.8 | 4.2 | −4.5% |
| DHT Holdings (DHT) | $23.46 | $3.78B | 4.8 | 4.4 | −7.2% |
| Frontline (FRO) | $52.25 | $11.63B | 5.0 | n/a | n/a |
| Nordic American (NAT) | $8.24 | $1.74B | 9.3 | 7.5 | −15.7% |
Frontline's EV/EBITDA and net cash are blank because we did not have its balance sheet in our filing pack.
What jumps out:
- Five of the six sit in a tight band. If Q2 repeated all year, their shares would repay their price in 4.6 to 5.0 years.
- Teekay and Scorpio are the cheapest on EV/EBITDA (2.7 and 2.9) because a large part of their market cap is cash: 34.5% and 21.8%. The business itself costs less than the share price suggests.
- Nordic American is the outlier on every measure. Its P/E is 9.3 (about 13 if you also strip out a $14.6 million insurance payment), its EV/EBITDA is 7.5, and it owes 15.7% of its market cap.
A second table adds two cross-checks.
| Company | Yahoo's trailing P/E (last 12 months of actual profit) | Price-to-book | 52-week range |
|---|---|---|---|
| Teekay Tankers | 6.0 | 1.48 | $47.18 to $103.16 |
| Scorpio Tankers | 5.5 | 1.22 | $48.93 to $90.06 |
| Intl. Seaways | 7.2 | n/a | $42.26 to $113.14 |
| DHT Holdings | 8.0 | n/a | $10.83 to $23.51 |
| Frontline | 7.8 | n/a | $20.47 to $54.91 |
| Nordic American | 14.2 | 3.65 | $3.06 to $8.33 |
The trailing P/E is higher than the "if Q2 repeats" P/E because the last twelve months include quarters from before the boom. Book values for DHT, International Seaways and Frontline were not in our file. Nordic American's price-to-book of 3.65 means investors are paying more than three and a half times the accounting value of its ships.
How we calculated this. Prices, market caps, trailing P/Es and 52-week ranges are from Yahoo Finance, about 9:55 a.m. ET on September 21, 2026. Everything else is our calculation:
- P/E if Q2 repeats: the price divided by four times Q2 profit per share, after removing one-off vessel-sale gains. Frontline ($2.61) and Teekay ($5.56) use company-adjusted figures. Scorpio is company-adjusted net income of $243.7 million divided by 53.5 million diluted shares, or $4.55. Nordic American is $47.0 million divided by 211.75 million shares, or $0.22. International Seaways ($5.91) and DHT ($1.23) are as reported.
- Net cash: cash and short-term investments minus debt at June 30. International Seaways' $250 million net debt is company-reported †. DHT's $273.1 million is from its release. For Scorpio we count the $140 million conversion-option liability as debt.
- EBITDA: company-reported adjusted EBITDA for DHT ($231.0 million), Scorpio ($300.5 million) and Nordic American ($67.6 million, which includes the $14.6 million insurance recovery). For Teekay and International Seaways it is our calculation from the income statement. International Seaways is operating income plus depreciation plus other income, about $345 million, which matches the figure reported on its call †.
8.4 The Market Has Already Moved#
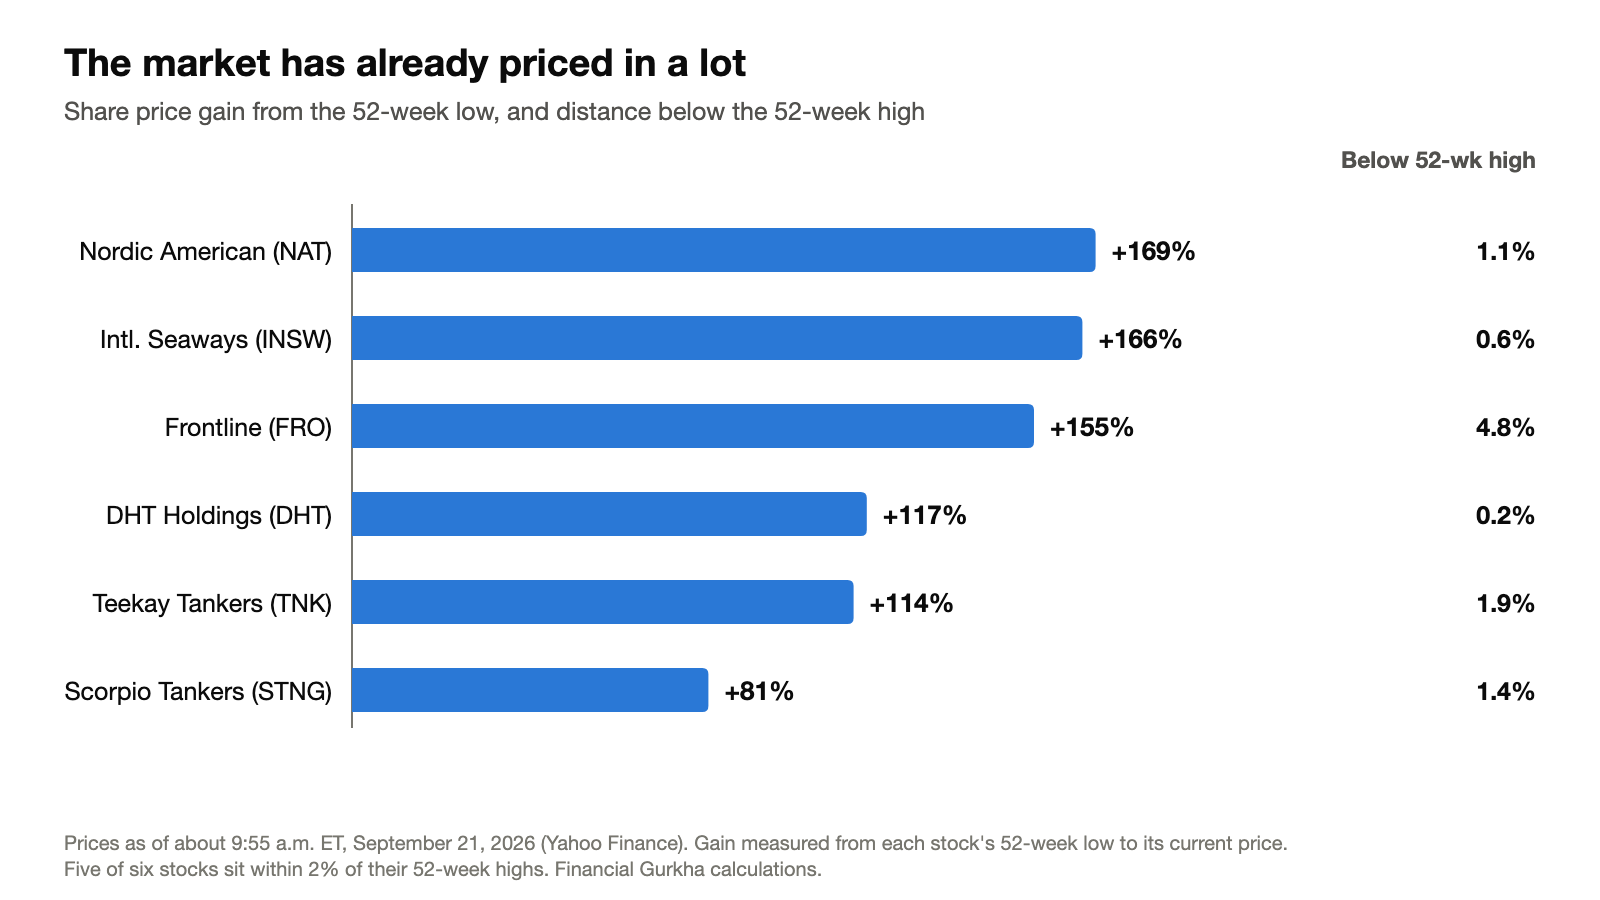
Gain from each stock's 52-week low to the September 21 price. Chart by Financial Gurkha.
If you were looking for a beaten-down sector, this is not one. The six stocks are up 81% to 169% from their lowest price of the past year, and five of six are within 2% of their highest. DHT is 0.2% below its high. Frontline is the exception at 4.8% below.
That matters because it means the low P/E numbers above are not a sign that nobody has noticed the profits. Everyone has. The market has already bid these stocks up, and it still only pays about 5 years of Q2 profit for them. The next section explains why.
8.5 Why a Cheap-Looking Number Can Be a Trap#
Picture an ice-cream stand during a July heatwave. It earns a fortune this week. Multiply this week's profit by 52 and the stand looks almost free at any reasonable asking price. But everyone knows the heatwave will end, so the real asking price is far higher than that arithmetic suggests. The low multiple is not a bargain. It is the market saying it does not expect this week to repeat.
Investors call this the cyclical P/E paradox The cyclical P/E paradoxIn cyclical industries, low price-to-earnings ratios tend to appear at the top of the cycle and high ones at the bottom. Investors pay a low multiple for peak earnings because they expect those earnings to fall, and a high multiple for trough earnings because they expect them to recover. A cheap-looking multiple on peak earnings is the market pricing in the decline.. A P/E of 4.6 on a quarter that may not repeat is not the same as a P/E of 4.6 on earnings the company can earn every year. Tanker profit is the heatwave.
So test it: what happens to the multiples if profits fall? The share price stays the same, but the profit under it shrinks, so you are paying more for each dollar of profit. If profit halves, the multiple doubles. If profit falls 75%, the multiple quadruples. For Teekay, the P/E goes from about 4.6 to about 9 to about 18.
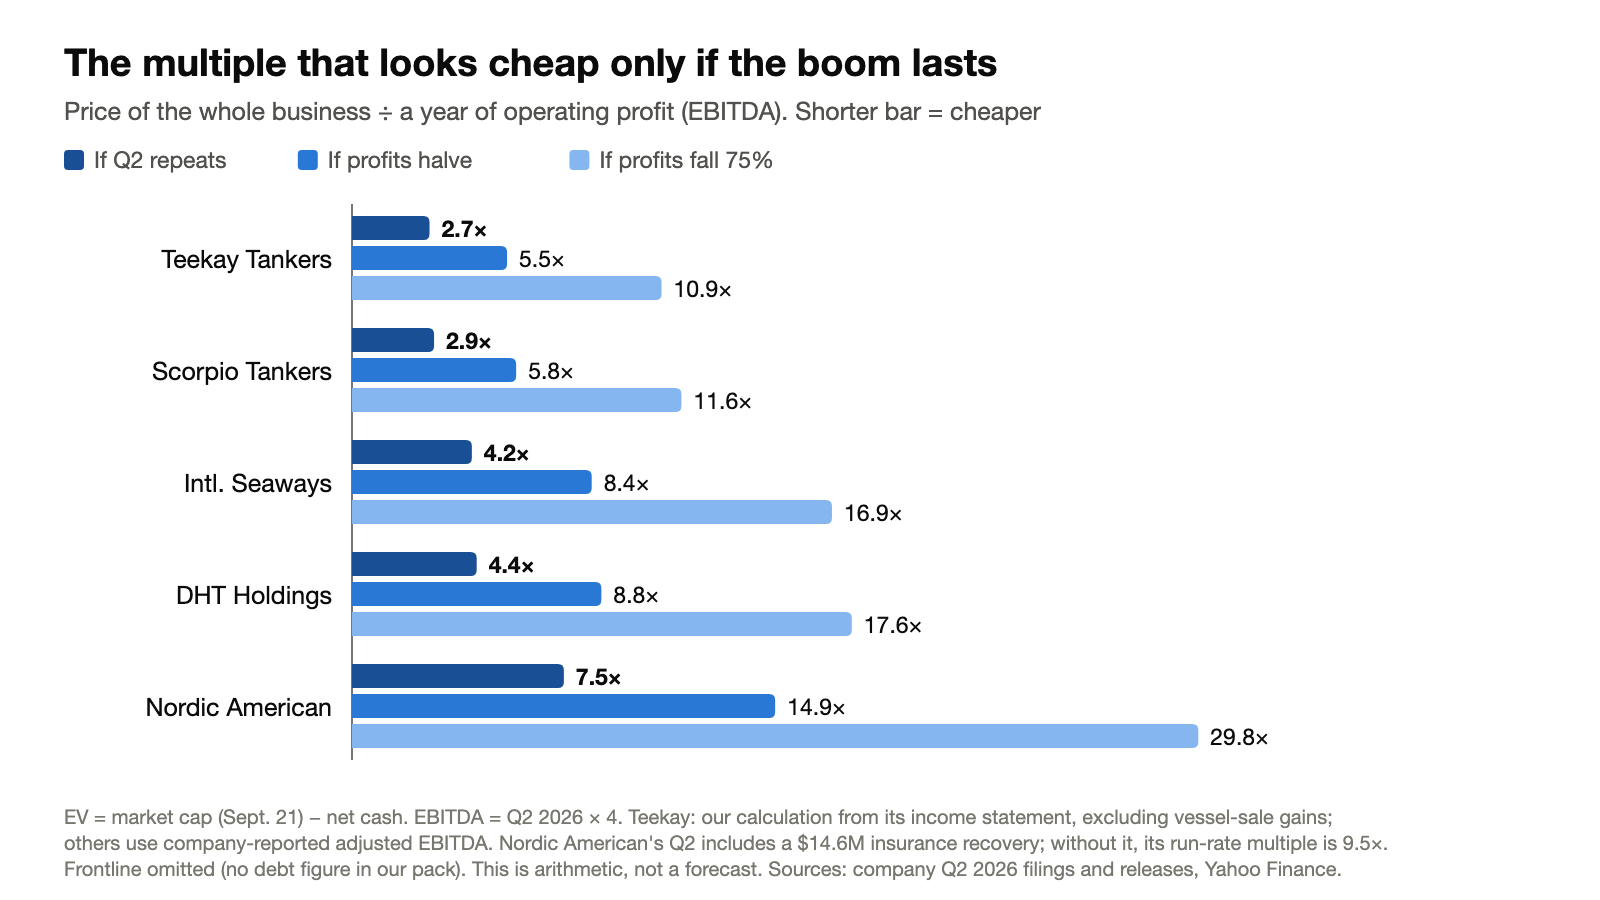
How to read it: each company has three bars. The darkest, shortest bar is EV/EBITDA if Q2 repeats. The longer bars are what you would be paying per dollar of operating profit if profits fell. A longer bar means a more expensive stock. This is arithmetic, not a forecast. Chart by Financial Gurkha.
If profits halve, Teekay and Scorpio are at 5.5 to 5.8, International Seaways and DHT at 8.4 to 8.8, and Nordic American at 14.9. If profits fall 75%, the range is 10.9 to 29.8.
What day rate would those scenarios mean for a supertanker? Using Frontline's $23,800 breakeven and its Q2 rate of $152,700 as the starting point, "profits halve" corresponds to a VLCC day rate of about $88,000, and "profits fall 75%" to about $56,000. For comparison, Frontline's VLCCs earned $37,200 a day as recently as Q1 2025.
The stocks are cheap only for as long as the boom lasts.
8.6 What Day Rate Does Frontline's Price Need?#
We can turn the question around: what supertanker day rate does the share price need to make sense?
Frontline's cash breakeven for a VLCC is $23,800 a day. Every dollar a ship earns above that is left over for shareholders. Frontline has 40 VLCCs and about 222.6 million shares (Yahoo's market cap divided by the price). So at any given day rate we can work out how much cash is left per share each year, and compare it with the $52.25 share price. This counts only the VLCCs. The Suezmaxes and Aframaxes would add more.
| VLCC day rate | Left over per ship per day | Profit compared with Q2's | Cash left per share per year | As a share of the $52.25 price |
|---|---|---|---|---|
| $37,200 (Frontline's Q1 2025 result) | $13,400 | 10% | $0.88 | 1.7% |
| $60,000 | $36,200 | 28% | $2.37 | 4.5% |
| $79,000 (Clarksons' 2028 forecast) | $55,200 | 43% | $3.62 | 6.9% |
| $117,000 (Clarksons' 2027 forecast) | $93,200 | 72% | $6.11 | 11.7% |
| $152,700 (Frontline's Q2 result) | $128,900 | 100% | $8.45 | 16.2% |
Our calculation: (day rate minus $23,800) × 40 ships × 365 days ÷ 222.6 million shares. It ignores drydocking and taxes, and the cash breakeven is management-defined, so we have not verified exactly which costs it includes. Illustrative only.
How to read it: if VLCC rates simply stay at Clarksons' 2028 forecast of $79,000, Frontline's VLCCs alone leave about 6.9% of the share price in surplus cash each year. At $60,000 it is 4.5%. At last year's rates it is only 1.7%. The Suezmaxes and Aframaxes would raise those figures, but those are the classes already softening.
Our read: the price is consistent with the plateau the market itself forecasts. It leaves little margin if the plateau erodes faster, and it is not a bargain compared with that forecast.
8.7 What We Could Not Test#
An honest valuation needs a few things that were not in our filing pack:
- Net asset value. Tanker stocks historically trade around the market value of their fleets, a figure called net asset value Net asset value (NAV)The estimated market value of a shipping company's fleet, plus its cash, minus its debt. Shipping stocks are often compared with NAV rather than with book value, because ships are carried at depreciated cost, not at what they would sell for.. We did not have appraised fleet values, so we cannot say whether the stocks trade above or below it. Secondary-market figures suggest a five-year-old VLCC is worth $151 million to $174 million, a $20 million to $40 million premium to a newbuild per Discovery Alert, which would mean asset values have already risen with the boom.
- Frontline's debt and equity, and book values for DHT and International Seaways.
- Broker estimates. We have not used analyst consensus for any company.
We would want NAV before deciding how much to own. We would not use that gap as a reason to ignore the arithmetic above.
Section 8 in one paragraph. If the second quarter keeps repeating, these stocks look cheap: about 5 years of profit to repay the price, and 2.7 to 4.4 years of operating profit to pay for the whole business (Nordic American excepted). But the stocks have already risen 81% to 169%, the market is paying a low multiple precisely because it expects profits to fall, and if they fall by half the multiples double. The cheapest-looking names, Teekay and Scorpio, are cheap partly because a third or a fifth of their price is cash. That cash is the part of the valuation that still holds in every scenario.
9. The Supply Problem: The Order Book Is the Clock#↑ Contents
Every tanker boom ends the same way: high rates pay for new ships, the ships arrive, and rates fall. The only question is when. This cycle's answer is visible in the order book, though most of the figures below come from secondary sources and should be treated as indicative.
- Ordering is at a record. Discovery Alert reports 217 VLCC orders in 2026 by early September (Signal Group), against 93 in all of 2025 and a full-year record of 108 in 2006. Clarksons Research counted 150 in the first half. Chinese yards took 89 of the 102 orders placed in the first five months.
- The order book is large. The order book Order bookThe list of ships that have been ordered from shipyards but not yet delivered, usually expressed as a percentage of the existing fleet. A large order book means a lot of new supply is coming. is measured against the existing fleet. BIMCO puts the crude tanker order book at 27% of the operating fleet. Frontline's own summary cites 33.5% for tankers overall †.
- Newbuild prices are rising. A conventional VLCC costs about $129 million to $131 million, against about $125.5 million in late 2025 and an $85 million to $90 million trough in 2016 and 2017.
- The deliveries land late. Vantage Shipbrokers' estimates, as reported, show around 20 ships arriving in 2027, then about 199 in 2028 and about 193 in 2029 (the report does not say which tanker classes). Frontline's CEO said lead times from order to delivery are moving toward 3.5 years †.
- Aging ships are not leaving. Between 15% and 20% of the active VLCC fleet is more than 20 years old but has not been scrapped, because sanctioned and shadow-fleet trades keep old ships working per the same report. The shadow fleet Shadow fleetTankers, usually old, that carry sanctioned oil outside normal insurance and regulation. They soak up demand for old ships that would otherwise be scrapped. keeps supply higher for longer than the age profile suggests.
Two readings of the same fact. The bull reading: the ships take 3.5 years to arrive, so the supply response cannot end this boom in 2026 or 2027. The bear reading: 2028 to 2029 is when nearly 400 ships arrive, and Clarksons' own forecast has VLCC earnings falling to $79,000 in 2028 even with Hormuz disrupted until mid-2027. The supply is not late by accident. It is the natural consequence of a cycle that is six months old.
Owners are not blind to it. Frontline has nine newbuildings to pay for, Scorpio has $90.2 million of vessels under construction, and Teekay has put down advances on newbuilding contracts. The group is quietly adding to the wave while it collects the profit.
10. The Bull Case and the Bear Case#↑ Contents
10.1 The Bull Case#
- Restocking demand is real. The US Strategic Petroleum Reserve has been drawn to its lowest level since 1983, as we showed in our analysis of US crude and refining, and governments elsewhere released reserves too. When the crisis eases, refilling those reserves creates a second leg of ton-mile demand. Clarksons assumes restocking supports the market into 2028.
- Supply is slow. With order-to-delivery lead times of about 3.5 years, nothing ordered today rescues the market before 2029.
- The term market is high. A three-year charter at $75,000 a day is roughly double Frontline's Q1 2025 result and more than three times its cash breakeven. Forward agreements for 2028 reportedly sit near $100,000.
- Balance sheets are clean. Teekay and Scorpio hold billions in net cash, Frontline has no meaningful maturities until 2030, and interest margins are falling. The failure mode of past cycles is absent.
- The multiples give room. At 4.6× to 5.0× Q2 earnings, even a 50% earnings drop leaves the group (excluding Nordic American) at roughly 9× to 10× earnings, not an extreme level.
10.2 The Bear Case#
- A settlement takes the premium out fast. The rate spike is a bottleneck premium. If Hormuz traffic normalizes, STS queues shrink, ships are released, and rates can fall toward the $37,000 of early 2025 quickly, because global VLCC loadings are 27% lower than a year ago. Volumes down and rates up is not a market with strong fundamentals under it.
- Demand is being destroyed. Gulf exports are down 36%, Brent is above $100 and the Federal Reserve raised rates 25 basis points on September 16. Higher prices and tighter money are how oil demand contracts.
- The order wave arrives in 2028 and 2029. Reportedly 217 VLCCs ordered in eight months, against 93 in all of 2025, suggests a large share is a bet on Hormuz staying shut.
- The stocks are at the top. Five of six are within 2% of their 52-week highs. Buyers today are paying for a continuation, not a recovery.
- The earnings have soft spots. Vessel-sale gains, Nordic American's insurance income, Scorpio's 57% rise in general and administrative costs, and a convertible note that adds 17% to the diluted share count.
- The product-tanker leg is already cooling. Scorpio's MR rate is booked 39% below Q2, Frontline's LR2 and Aframax rate is booked 12% below, Teekay's Aframax and LR2 19% below, and Nordic American's Q3 rate is about 14% below its Q2.
- Variable dividends move with earnings. A 20% yield can become a 5% yield in two quarters with no change in the company's health.
- The ships are physically exposed. Nordic American's $14.6 million of loss-of-hire insurance proceeds show vessels were disrupted. Attacks, war-risk premiums and sanctions rules can change the economics overnight.
11. What We Would Do: A Framework for Investors#↑ Contents
We are not registered investment advisers and this is not personal advice. What follows is how we would think about it, laid out so you can disagree with it.
11.1 Start With What Nobody Can Forecast#
Nobody has an edge on whether Hormuz reopens in three months, twelve months or never. So the question is not "what will happen?" but "how do I own this if I am wrong either way?" Here are three regimes and what each would likely mean. They are illustrations, not predictions.
| Regime | What it looks like | VLCC earnings vs Q2 (excess over breakeven) | What we would expect from the stocks |
|---|---|---|---|
| Long disruption (Clarksons base case) | Hormuz impaired into mid-2027, gradual recovery, restocking | 2027 at $117,000: about 72% of Q2 | Dividends still large, multiples not far from today's. Returns come mostly from cash paid out, with limited upside from price |
| Negotiated reopening | Traffic normalizes within months, STS queues clear, order-wave and volume weakness show through | $60,000 to $79,000: about 28% to 43% of Q2 | Equities re-rate lower before the earnings do. Multiples of 8× to 15× on falling earnings. The most painful outcome for the highest-priced names |
| Escalation | Pipeline outage persists, more chokepoints affected, restocking demand deferred | Above $150,000 | Earnings and dividends rise further, but the stocks are already priced for a lot of this |
The first regime is roughly what the stocks already price. The second is the one that hurts. The third is the one that pays, but it pays less than it appears because the starting prices are already at highs.
11.2 The Principles#
- Own the cash, not the yield. Prefer companies where the balance sheet does the protecting, because that is the part of the story that survives every regime.
- Treat each dividend as a partial return of capital. If you buy at $52.25 and Frontline pays $2.61, you have not earned 5%. You have been handed 5% of your own money back, and the next payment could be a fraction of it.
- Size for the outcome you cannot forecast. A position you can hold through a 40% to 50% drop, if the cycle turns, is sized correctly. One you could not is not.
- Decide the exit before you enter. See Section 12 for what we would watch.
- Do not chase the most extended name. The stock with the biggest run and the thinnest earnings support is where the pain concentrates.
11.3 Where That Leaves Each Company#
| Company | Exposure | P/E if Q2 repeats | EV/EBITDA if Q2 repeats | Balance sheet | Our read |
|---|---|---|---|---|---|
| TNK | Suezmax, Aframax, LR2, VLCC; mostly spot | 4.6× | 2.7× | Net cash 34.5% of market cap | Best margin of safety. Cash is about $35 of a $101 share. Low regular dividend but the most cushion if the cycle turns |
| STNG | Product tankers (LR2, MR, Handymax) | 4.9× | 2.9× | Net cash 21.8% of market cap | Strong balance sheet, cooling market. MR and Handymax rates are falling. Buybacks are supportive, the convertible is a dilution risk |
| INSW | Crude and products; pools and term | 4.8× | 4.2× | Net LTV 6% † | Balanced. Diversified, clean earnings, a formula dividend of at least 85%. Its price is 0.6% below its 52-week high |
| DHT | Pure-play VLCC, about half of Q3 days on term | 4.8× | 4.4× | Net debt $273M, about 0.3× EBITDA | Best "floor" among the VLCC pure plays. The $75,900 term book cushions a fall. At its 52-week high |
| FRO | VLCC and Suezmax; 95% spot | 5.0× | n/a | $1.2B liquidity, no maturities to 2030 † | A leveraged bet on Hormuz staying shut. Highest torque, pays everything out, and the LR2 and Aframax leg is softening |
| NAT | Suezmax pure play | 9.3× | 7.5× | Net debt 15.7% of market cap | Avoid at this price. Highest multiples (13× on gain- and insurance-adjusted earnings), 3.65× book, +169% in a year, Q3 booked below Q2 |
Our summary: the sector is not a screaming bargain, and it is not a bubble either. It is a well-funded cyclical at the top of its earnings with a supply response building. Selective, income-aware exposure through the balance-sheet leaders is defensible. Buying the whole group for the yield is not.
12. Signals to Watch#↑ Contents
| Signal | Why it matters | Where to look |
|---|---|---|
| Strait of Hormuz transit counts | The direct measure of how much of the bottleneck remains. Non-Iranian-linked transits were 97 in the week to Sept 14 | USNI News weekly updates |
| Saudi East-West pipeline restart | Its closure adds to the Yanbu disruption. A quick restart removes some support for rates | News coverage; Saudi Aramco statements |
| TD3C and Oman-China indices | If headline rates converge down toward the $150,000 that fleets actually earn, the upside on open days disappears | Baltic Exchange, Lloyd's List |
| Q4 bookings in the November updates | Whether owners can book Q4 above $100,000 a day is the test of the plateau | Company quarterly results |
| Three-year time charter rates | DHT's $75,000 is a benchmark. A fall below it means the term market has stopped believing in the plateau | Company releases; broker reports |
| Secondhand VLCC prices vs newbuild prices | Secondhand ships trade above newbuild parity now ($151M to $174M against about $130M). When that flips, the cycle has turned | Broker reports |
| New VLCC orders | Continued ordering at this pace confirms a 2028 to 2029 supply wave | Clarksons, Signal Group, BIMCO |
| Product-tanker rates (MR, Handymax) | They led the deceleration. If they keep falling, crude follows | Scorpio's booking updates |
| Brent and the US SPR refill | Demand-side pressure and restocking support | EIA weekly data |
| Q3 earnings | In Q2 the group reported between August 3 and August 28; expect the next round in early to late November | Company filings |
Financial Gurkha Takeaways#↑ Contents
- The boom is real and it is cash. Six companies earned $1.83 billion in Q2, about $1.55 billion after stripping out vessel-sale gains, up from $330 million a year earlier. Teekay, Scorpio and International Seaways converted 84% to 126% of underlying profit into operating cash.
- It is a bottleneck boom. VLCC loadings are down 27% while rates are up 7.1×. The excess rate is a rent on the Hormuz disruption and can disappear faster than the demand it rests on.
- Realized rates are not headline rates. Frontline's VLCCs earned $152,700 a day in Q2, not $900,000. The headline matters only for what it says about unbooked days.
- Balance sheets are the strongest they have been. Teekay holds net cash equal to 34.5% of its market value and Scorpio 21.8%. Default risk is not the problem this cycle.
- Yields of 18% to 21% are a peak-earnings artifact. They are the arithmetic of Q2 repeated four times. Dividends will move one for one with earnings.
- The stocks have already moved. They are up 81% to 169% from their lows and mostly within 2% of their highs. Cheap-looking multiples double if earnings halve.
- The clock is the order book. Record ordering in 2026 means heavy deliveries in 2028 and 2029, exactly when Clarksons has VLCC rates falling toward $79,000.
- Own the cash, not the yield. Prefer the cash-rich balance sheets, treat dividends as return of capital, size for a 40% to 50% drawdown, and decide your exit before you buy.
Frequently Asked Questions#↑ Contents
Why are tanker rates so high in 2026? Because the Strait of Hormuz has been disrupted since late February 2026, Gulf crude moves through ship-to-ship transfers, bypass pipelines and long routes around Africa. That ties up ships without increasing the number of barrels shipped. The Baltic Exchange's Oman-to-China VLCC index reached $870,947 a day in the latest data in our research file.
How much did tanker companies earn in Q2 2026? Frontline, Scorpio Tankers, International Seaways, Teekay Tankers, DHT and Nordic American together reported $1.83 billion of net income for the quarter ended June 30, 2026, up from $330 million a year earlier. Excluding vessel-sale gains, the total is roughly $1.55 billion.
What is a VLCC? A Very Large Crude Carrier, a tanker of about 300,000 deadweight tonnes that carries roughly 2 million barrels of crude oil. VLCCs are the largest ships in regular crude service and the class behind the highest day rates in 2026.
What is TCE, or time charter equivalent? TCE is a standard measure of what a ship earns per day after paying voyage costs such as fuel, port fees and canal tolls. It lets owners compare a long-haul voyage with a short one. Frontline's VLCCs earned $152,700 a day on this basis in Q2 2026, against $37,200 in Q1 2025.
Are tanker stocks a buy right now? It depends on your time horizon and risk tolerance, and this is not personal advice. Our analysis is that earnings and balance sheets are exceptional but most stocks trade within 2% of their 52-week highs, after gains of 81% to 169%. The multiples look cheap only if Q2 earnings persist. We favor the cash-rich balance sheets, such as Teekay and Scorpio, over chasing high yields.
Which tanker stock has the highest dividend yield? Annualizing the latest quarterly dividend, DHT Holdings (about 20.8%), Frontline (about 20.0%) and International Seaways (about 18.0%) are the highest. These dividends are tied to earnings and will fall if rates fall, so the annualized yield is not a forecast.
Which tanker company has the strongest balance sheet? Teekay Tankers, which had $735.0 million of cash and $476.6 million of short-term investments at June 30, 2026, and no debt. That equals about 34.5% of its market capitalization. Scorpio Tankers is next, with net cash of about 21.8% of its market value.
What happens to tanker stocks if the Strait of Hormuz reopens? The excess rate premium would likely shrink quickly as ship-to-ship transfer queues clear and ships are released, and share prices tend to move ahead of earnings. As an illustration, the group's EV/EBITDA multiples, currently 2.7× to 7.5×, would rise to roughly 5.5× to 14.9× if earnings halve and 10.9× to 29.8× if they fall 75%.
How long will tanker rates stay high? No one knows. Clarksons Securities forecasts VLCC earnings of $135,000 a day in 2026, $117,000 in 2027 and $79,000 in 2028, assuming Hormuz stays disrupted until mid-2027. The main supply threat is a record number of VLCC orders, with deliveries concentrated in 2028 and 2029.
What is cash breakeven for a tanker? The daily rate needed to cover a ship's operating costs, interest and overhead. Frontline reports 12-month average cash breakevens of $23,800 for VLCCs, $25,700 for Suezmaxes and $22,200 for LR2 and Aframax ships. Everything above that is surplus cash for shareholders.
About This Analysis#↑ Contents
Research by Kanchan Sharma, founder of Financial Gurkha. This article was prepared on September 21, 2026, using market prices from about 9:55 a.m. ET that day.
Primary sources (figures taken directly from filings and releases in our research file):
- Frontline plc, Form 6-K, Q1 2026 exhibit: spot and time-charter TCE, spot days and per-day rates by class.
- Teekay Tankers Ltd., Form 6-K, six-month statements: income statement, balance sheet, cash flow, revenue by contract type.
- Scorpio Tankers Inc., Q2 2026 results (Nasdaq) and the September 3, 2026 6-K for Q3 bookings: income statement, balance sheet, cash flow, daily results by class.
- International Seaways, Inc., Form 10-Q for the quarter ended June 30, 2026: income statement and cash flow.
- DHT Holdings, Inc., Q2 2026 results release (August 5, 2026): financial highlights table and subsequent-events outlook.
- Nordic American Tankers Limited, Q2 2026 results: net voyage revenue and EBITDA reconciliation, income statement, balance sheet.
- Frontline plc, Q2 2026 results release.
Secondary sources (marked † or linked in the text; not independently verified against a filing): Lloyd's List and Clarksons Securities for the VLCC record and forecasts; USNI News for Hormuz transit counts; Al Jazeera, CNN, Bloomberg and CNBC for the East-West pipeline; the Frontline Q2 call summary; International Seaways, Teekay Tankers and Nordic American results summaries; Discovery Alert for the order book, newbuild and secondhand prices and fleet age; the Wikipedia 2026 Iran war fuel crisis timeline and Trading Economics for Brent; and Yahoo Finance for FRO, STNG, DHT, INSW, TNK and NAT prices, market caps, 52-week ranges and trailing P/E ratios.
What we calculated. Combined and gain-adjusted net income; cash conversion; net cash and net debt as a share of market value; annualized P/E and EV/EBITDA and their scenarios; dividend run-rates and yields; Frontline's per-share sensitivity; and DHT's open-days figure. The arithmetic is shown next to each number so you can check it. Where we combined a filing figure with a market price, the price date is stated.
What we did not have. Frontline's Q2 balance sheet and adjusted EBITDA; book values for Frontline, DHT and International Seaways; appraised fleet values (net asset value); analyst consensus estimates; and INSW's and DHT's gain-on-sale detail beyond what is shown. Where we lacked a figure, we say so rather than estimate it.
Corrections. If you find an error, write to contact@kanchanksharma.com and we will correct the article and note the change.
This analysis reflects information available on September 21, 2026. Markets, freight rates and geopolitical conditions in this sector can change within hours.