Disclaimer: This article is for educational purposes only. Trading and investments are subject to volatility, market risks, and macroeconomic shifts that could lead to partial or total loss of capital. All views expressed here and across FinancialGurkha.com are for educational and information-sharing purposes. Viewer discretion is advised. Please consult your financial advisor before making investment decisions. FinancialGurkha.com and its authors assume no liability for financial outcomes.
Introduction#
The United States produces more crude oil than any country has ever produced. The US is also running its refineries harder than at almost any point in the last decade, drawing down an emergency reserve that is smaller than it has been since Ronald Reagan's first term, and paying the highest diesel prices in its history.
This article is an attempt to lay out the whole picture in one place: what the US actually produces, what it refines, what it imports, what it exports, what it holds in storage, and why the most profitable stretch in the history of American refining is producing no new refineries at all.
The numbers below come from three sources. The first is the EIA Weekly Petroleum Status Report for the week ending August 28, 2026, released Wednesday, September 2. The second is a Bloomberg Terminal research session run against the NRGZ energy function, specifically the DOE and IEA chart packs and the EIA Table 9 imports and exports breakdown. The third is contemporaneous reporting on the industry's capital-allocation decisions, principally the September 4, 2026 Wall Street Journal piece by Collin Eaton on why owning a refinery has become more profitable than building one.
💡 TLDr: US crude production is running at 13.862 million b/d. Refiners are pulling in 17.496 million b/d of crude, which is 98.0% of operable capacity that fell to 18.2 million b/cd on January 1, 2026. That gap is why a country producing 13.9 million barrels a day still imports 6.77 million b/d of crude. Commercial crude stocks fell 4.45 million barrels on the week to 424.46 million. The SPR is at 286.6 million barrels, the lowest since 1983. Cushing sits at 22.5 million barrels, barely above the roughly 20 million barrel level at which the hub stops functioning properly. The diesel crack spread hit a record $102 a barrel. And the six largest US refiners made a combined $24.7 billion in the second quarter, nearly five times the year-ago figure, while committing to build nothing.
Table of Contents#↑ Contents
- 1. The Inventory Picture: Crude, Cushing, and the SPR
- 2. Domestic Production and Where It Comes From
- 3. Imports, Exports, and Why America Still Buys Foreign Crude
- 4. Refining: Running Flat Out on a Shrinking Capacity Base
- 5. Prices, Cracks, and Refiner Profits
- 6. Why Nobody Is Building a New Refinery
- 7. The Global Balance: IEA Supply and Demand
- 8. What to Watch Next
- Conclusion and Key Takeaways
- Methodology and Sources
1. The Inventory Picture: Crude, Cushing, and the SPR#↑ Contents
Inventories are the cleanest single read on whether an energy system is comfortable or stretched. Right now the US system is stretched in three places at once.
1.1 Commercial Crude Stocks Commercial Crude StockThese are privately owned inventories of unrefined crude oil held by businesses such as refineries, pipeline operators, and commercial traders. These exclude SPRs #
Commercial crude oil inventories, which exclude the Strategic Petroleum Reserve, fell 4.450 million barrels in the week ending August 28 to 424.460 million barrels. That draw was the single largest weekly number in the EIA release and it is the figure that moved the market on Wednesday.
| Week Ending | Commercial Crude Stocks (thousand bbl) | Weekly Change |
|---|---|---|
| 08/28/2026 | 424,460 | -4,450 |
| 08/21/2026 | 428,910 | +95 |
| 08/14/2026 | 428,815 | +4,405 |
| 08/07/2026 | 424,410 | — |
Add the SPR and total US crude holdings come to roughly 711.1 million barrels. A year ago that same combined figure was materially higher, and essentially all of the deterioration has come out of the government's half of the ledger rather than the industry's.
1.2 Cushing, Oklahoma: The Delivery Point#
Cushing is not just another tank farm. It is the physical delivery point for the NYMEX WTI contract, which means the price the entire world quotes for American crude is settled against barrels sitting in Oklahoma. When Cushing empties, the contract's physical anchor gets thin, and that shows up as violent time-spread behaviour rather than as a headline.
Cushing stocks rose 80,000 barrels on the week to 22.508 million barrels.
| Week Ending | Cushing Stocks (thousand bbl) | Note |
|---|---|---|
| 08/28/2026 | 22,508 | Latest |
| 08/21/2026 | 22,428 | — |
| 08/14/2026 | 21,252 | — |
| 08/07/2026 | 22,566 | — |
| 07/31/2026 | 20,955 | Recovering |
| 07/24/2026 | 18,599 | Below operational tank bottom |
| 07/17/2026 | 19,370 | Below operational tank bottom |
| 07/10/2026 | 20,044 | At the threshold |
According to OK Energy Today, Cushing has an estimated 90-million-barrel storage capacity but the working capacity is closer to 73 million barrel. The hub's practical operational floorFloor Level for Operation This is the minimum level required to maintain pressure, pump suction, and flow of Crude in Cushing storage tankers, is around 20 million barrels. In July of this year, Cushing spent multiple consecutive weeks below that line.
At 22.5 million barrels, Cushing is currently at roughly 30% of working capacity and only about 2.5 million barrels above the level at which the delivery hub for the world's most-traded oil benchmark begins to have mechanical problems. That is not a comfortable buffer.
1.3 The Strategic Petroleum Reserve Strategic Petroleum ReservesThe SPR were created in 1975 to migitage the impact of the Arab Oil Embargo.#
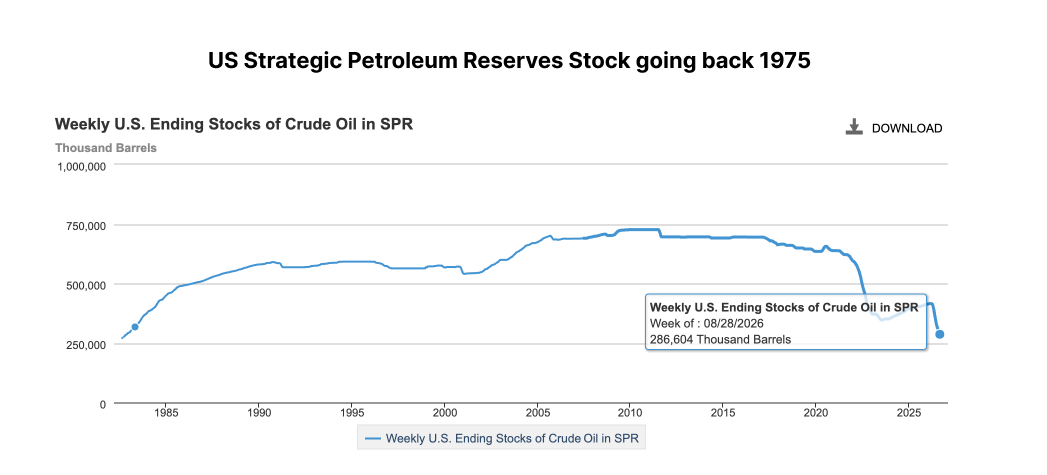
The SPR is where the stress is most visible. It stood at 286.604 million barrels on August 28, down 3.122 million barrels on the week.
| Week Ending | SPR Stocks (thousand bbl) | Weekly Change |
|---|---|---|
| 08/28/2026 | 286,604 | -3,122 |
| 08/21/2026 | 289,726 | -3,700 |
| 08/14/2026 | 293,426 | -5,268 |
| 08/07/2026 | 298,694 | -6,115 |
| 07/31/2026 | 304,809 | -2,841 |
| 07/24/2026 | 307,650 | -3,797 |
| 07/17/2026 | 311,447 | -5,057 |
| 07/10/2026 | 316,504 | -2,985 |
| 07/03/2026 | 319,489 | -6,166 |
| 06/26/2026 | 325,655 | — |
That is a 39.05 million barrel drawdown across nine weeks, an average of roughly 4.34 million barrels a week. The reserve crossed below 300 million barrels in the second week of August for the first time since it was being filled in the early 1980s, putting it at its lowest level since March 1983.
The drawdown traces back to March 2026, when the Department of Energy began a 172 million barrel emergency release in response to the war in Iran, as the American share of a coordinated 400 million barrel action agreed by the 32 member countries of the International Energy Agency. Cumulatively, roughly 352 million barrels have been withdrawn from the SPR over four years to absorb supply disruptions from the Iran conflict and Russia's invasion of Ukraine.
Read more on SPR Storage Sites here.
1.4 Products: Gasoline and Distillate What are Gasoline and Distillates?If Gasoline is for Cars, Distillates is for operating heavy-duty machinery. Think gasoline and diesel here. Both are finished products.#
| Product | Week Ending 08/28/2026 (thousand bbl) | Weekly Change | Roughly One Year Earlier |
|---|---|---|---|
| Total Gasoline | 205,669 | -1,173 | ~223,570 |
| Distillate Fuel Oil | 104,187 | +796 | ~114,242 |
Distillate is the number to watch. At 104.2 million barrels, US distillate inventory is running roughly 9% below the year-ago level heading into the fourth quarter, which is when heating demand and harvest-season diesel demand both arrive. Gasoline at 205.7 million barrels is about 8% below its year-ago level. Neither of these is a crisis on its own. Together, with refiners already at 98% utilization and no spare capacity to lean on, they mean the system has no cushion for an unplanned outage.
2. Domestic Production and Where It Comes From#↑ Contents
US field production of crude oil was 13.862 million b/d in the week ending August 28, up 19,000 b/d on the week and the high of the recent series.
| Week Ending | US Crude Production (thousand b/d) |
|---|---|
| 08/28/2026 | 13,862 |
| 08/21/2026 | 13,843 |
| 08/14/2026 | 13,830 |
| 08/07/2026 | 13,805 |
| 07/31/2026 | 13,804 |
| 07/24/2026 | 13,796 |
| 07/17/2026 | 13,798 |
| 07/10/2026 | 13,861 |
Production has been remarkably flat, moving in a band of about 66,000 b/d across two months. That stability is itself informative: at $90 WTI, the US shale complex is not responding with a supply surge the way it did in 2014 or 2018. Capital discipline, service-cost inflation, and the maturity of the core Permian acreage have flattened the price elasticity of American supply.
2.1 The State-Level Breakdown#
Pulling EIA Crude by State off the Bloomberg terminal gives lower-48 Lower 48This excludes Alaska. Think mainland production production of approximately 13.4 million barrels a day, with the balance to the national total coming from Alaska. The state and area detail recorded in the research session:
| Producing Area | Crude Production (million b/d) | Share of Named Total |
|---|---|---|
| Texas | 5.70 | 45.1% |
| New Mexico | 2.37 | 18.8% |
| Federal Offshore Gulf of Mexico | 1.998 | 15.8% |
| North Dakota | 1.16 | 9.2% |
| Rocky Mountain region (CO, MT, UT, WY) | 1.014 | 8.0% |
| Alaska | 0.40 | 3.2% |
| Total, named areas | 12.64 | 100% |
Two things stand out. First, Texas and New Mexico together account for 8.07 million b/d, or about 58% of national output. That is the Permian Basin, and it means American energy security is concentrated in a single geological formation straddling one state line. Second, federal offshore Gulf of Mexico at 1.998 million b/d is now larger than North Dakota and the entire Rocky Mountain region combined, which is a meaningful reversal of the shale-era narrative that offshore was in structural decline.
3. Imports, Exports, and Why America Still Buys Foreign Crude#↑ Contents
The United States is a net exporter of petroleum and simultaneously imports 5.8 to 6.8 million barrels of crude oil every single day.
3.1 Imports, Week Ending August 28, 2026#
Read directly off the EIA Table 9 panel in the Bloomberg NRGZ energy function, in thousands of barrels per day:
| Import Category | Current Week | Previous Week | Change |
|---|---|---|---|
| Total Crude Oil incl. SPR | 6,770 | 6,158 | +612 |
| — Commercial | 6,770 | 6,158 | +612 |
| — Imports by SPR | 0 | 0 | 0 |
| — Imports into SPR by Others | 0 | 0 | 0 |
| Total Motor Gasoline | 370 | 565 | -195 |
| Fuel Ethanol | 0 | 0 | 0 |
| Kerosene-Type Jet Fuel | 81 | 28 | +53 |
| Distillate Fuel Oil | 113 | 176 | -63 |
| Residual Fuel Oil | 85 | 166 | -81 |
| Propane / Propylene | 66 | 82 | -16 |
| Other Oils | 334 | 626 | -292 |
| Total Product Imports | 1,049 | 1,644 | -595 |
| Total Imports (incl. SPR) | 7,819 | 7,802 | +17 |
Note the zeros in the two SPR import lines. The US Strategic Petroleum Reserve refill has not begun.
3.2 Exports, Week Ending August 28, 2026#
| Export Category | Current Week | Previous Week | Change |
|---|---|---|---|
| Total Exports | 11,896 | 11,587 | +309 |
| Crude Oil | 4,483 | 3,792 | +691 |
| Total Products | 7,413 | 7,795 | -382 |
| — Finished Motor Gasoline | 934 | 890 | +44 |
| — Kerosene-Type Jet Fuel | 331 | 359 | -28 |
| — Distillate Fuel Oil | 1,735 | 1,790 | -55 |
| — Residual Fuel Oil | 105 | 128 | -23 |
| — Propane / Propylene | 2,153 | 2,018 | +135 |
| — Other Oils | 2,051 | 2,448 | -397 |
Total exports of 11.896 million b/d against total imports of 7.819 million b/d give net exports of roughly 4.08 million b/d. The US is simultaneously the world's largest crude exporter and consumer. China is the world's largest crude importer, followed by India, then the United States at No. 3.
Crude exports of 4.483 million b/d are well below the all-time weekly record of 6.438 million b/d set in the week ending April 24, 2026, during the acute phase of the price spike. The pullback is a margin signal: with the domestic diesel crack above $100, barrels are worth more inside a US refinery than on a VLCC headed to Rotterdam.
Regional export detail from the terminal session, on a monthly basis:
| Export Region | Crude Exports (million barrels/month) | Approximate b/d Equivalent |
|---|---|---|
| Gulf Coast | 138 | ~4.6 million |
| Midwest | 3.10 | ~103,000 |
| West Coast | 2.23 | ~74,000 |
These are monthly figures from a different reporting period than the weekly export table above, so the daily equivalents will not tie out exactly to the 4.483 million b/d weekly print. The proportions are the point: the Gulf Coast is not merely the largest export region, it is essentially the only one. Corpus Christi, Houston, and the Louisiana Offshore Oil Port handle the overwhelming majority of American crude leaving the country, which is why any disruption to Gulf Coast infrastructure, hurricane or otherwise, is a global event rather than a regional one.
3.3 So Why Import at All?#
Three reasons, in order of importance.
First, the arithmetic of throughput. US refiners ran 17.496 million b/d of crude last week. Domestic production was 13.862 million b/d. The gap is 3.63 million b/d, and it has to be filled by imports before you account for the 4.48 million b/d being exported. The refining system is simply bigger than the production system.
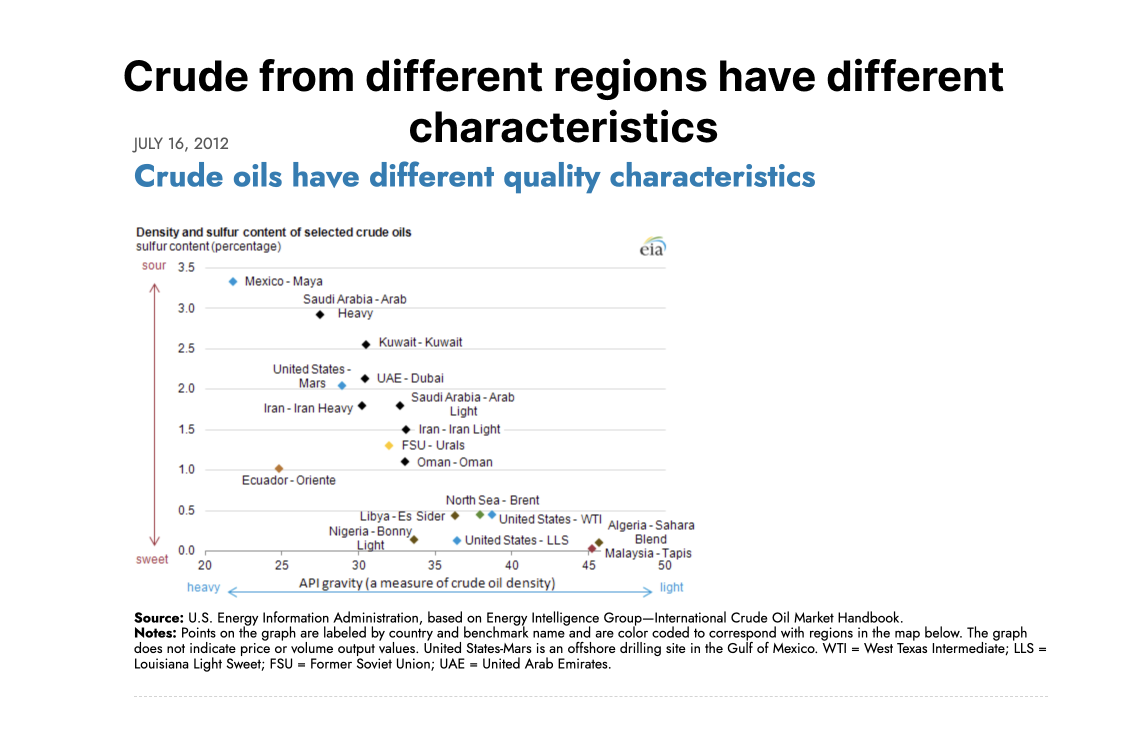
Second, and more fundamentally, quality mismatch. The American refining fleet was built over decades to run heavy sour crude from Venezuela, Mexico, Canada, and the Middle East. Gulf Coast refiners in particular invested tens of billions of dollars in coking and hydrotreating units specifically designed to break down dense, high-sulphur barrels. What the shale revolution delivered instead was light sweet crude with an API gravity American Petroleum InstituteAPI gravity is a measure of a crude oil’s density (how it flows), which was developed as a standard by the American Petroleum Institute those units cannot economically process at full rates. A Gulf Coast coker fed nothing but Permian light sweet is an expensive asset running below its design value. So the US exports light sweet crude to refineries abroad that want it, and imports heavy sour crude that its own refineries were built to consume. This is the single most misunderstood fact in American energy.
Third, geography and logistics. Midwest refineries sit at the end of pipelines running south from Alberta and are physically configured for Canadian heavy crude. Moving Permian barrels to them would require infrastructure that does not exist. East Coast refineries have historically found waterborne imports cheaper than rail from North Dakota. The map, not the balance sheet, dictates a large share of the flow.
4. Refining: Running Flat Out on a Shrinking Capacity Base#↑ Contents
4.1 Utilization at 98%#
| Week Ending | Refinery Utilization (%) | Net Crude Input (thousand b/d) |
|---|---|---|
| 08/28/2026 | 98.0 | 17,496 |
| 08/21/2026 | 97.4 | 17,393 |
| 08/14/2026 | 97.2 | 17,395 |
| 08/07/2026 | 96.2 | — |
| 08/29/2025 | — | 16,869 |
Crude runs are up 627,000 b/d year over year, an increase equivalent to adding two mid-sized refineries to the national fleet in twelve months, achieved entirely by running the existing fleet harder. The Wall Street Journal reports that US refineries have been operating at over 97% of collective capacity in recent weeks, near their highest rate in about eight years.
For context on what 98% means: refineries are not designed to run at 98% indefinitely. Normal planning assumes scheduled turnarounds, catalyst changes, and unit maintenance that pull utilization into the low 80s for weeks at a time each spring and autumn. Sustained high-90s utilization means those turnarounds are being deferred, which raises the probability of unplanned outages later.
4.2 The Capacity Base Is Shrinking#
The Bloomberg OLCAUSA index of United States crude oil refinery capacity read 18,172 thousand b/d as of December 31, 2025, a decline of 244 thousand b/d on the prior reading. The EIA's own Refinery Capacity Report corroborates this: US operable atmospheric crude distillation capacity totalled 18.2 million barrels per calendar day on January 1, 2026, down more than 250,000 b/cd, about 1%, from January 1, 2025. The decrease was driven principally by two closures: the Phillips 66 Los Angeles refinery and the Valero Benicia refinery, both in California.
4.3 Capacity and Utilization by Region#
From the terminal session, in thousands of barrels per day:
| Refining Region | Operable Capacity (thousand b/d) | Utilization (%) | Share of US Capacity |
|---|---|---|---|
| Gulf Coast | 9,888 | 98.0 | 54.9% |
| Midwest | 4,283 | 103.0 | 23.8% |
| West Coast | 2,273 | 92.8 | 12.6% |
| East Coast | 928 | 87.0 | 5.1% |
| Rocky Mountain | 653 | 99.8 | 3.6% |
| Total | 18,025 | ~98 | 100% |
Three observations.
The Midwest is running above 100%. This is not an error. Reported utilization is measured against calendar day capacity, which builds in an allowance for scheduled and unscheduled downtime. A refinery running hard with no maintenance can exceed its calendar-day rating for a period; the relevant ceiling is stream day capacity, which is higher. What a 103% print actually tells you is that PADD 2 refiners have suspended maintenance to chase the diesel crack.
The Gulf Coast is 55% of the entire national fleet. Combine that with the Gulf Coast accounting for roughly 96% of monthly US crude exports, and the concentration risk is stark. A major hurricane landfall between Corpus Christi and New Orleans is a single point of failure for over half of American refining and nearly all of American crude export capability.
The East Coast at 87% is the slack in the system, and it is only 928 thousand b/d, roughly 5% of the fleet. There is no meaningful spare capacity anywhere else.
4.4 Who Actually Owns the Fleet#
Ranked by US refining capacity, the five largest American refiners are:
| Rank | Company | Notes |
|---|---|---|
| 1 | Marathon Petroleum MPC Net IncomeMarathon Petroleum reported a net income attributable to the company of $5.65 billion (MPC) | Largest US refiner by capacity |
| 2 | Valero Energy | Heavy Gulf Coast and mid-continent concentration |
| 3 | ExxonMobil | Baytown, Beaumont, Baton Rouge |
| 4 | Phillips 66 | Closed its Los Angeles refinery during 2025 |
| 5 | Chevron | Pascagoula, El Segundo, Richmond |
According to Reuters, the top U.S. refiners made over $12.6 billion in the second quarter of 2026 alone, driven by a massive spike in fuel profit margins.
5. Prices, Cracks, and Refiner Profits#↑ Contents
5.1 Crude Benchmarks#
As of September 3, 2026, WTI opened at $90.58 a barrel and Brent at $95.22. Brent traded briefly above $100 in the first quarter during the Hormuz crisis, and renewed escalation since mid-July has kept it in an $88 to $96 range.
The $4.64 Brent-WTI spread is worth noting. A wide spread is what makes US crude exports economic; when it compresses, barrels stay home. At current levels the arbitrage is open but not spectacular, which is consistent with crude exports running well below their April record.
5.2 The Diesel Crack#
The crack spread is the difference between the price of crude going into a refinery and the price of refined product coming out. It is the refiner's gross margin, and it is quoted in dollars per barrel.
This week, the US diesel crack spread reached triple digits for the first time in history, peaking at approximately $102 per barrel on Monday before easing to around $100 on Tuesday. Diesel cracks hit records in Europe simultaneously.
To make the magnitude concrete: at a $100 diesel crack with Brent at $95, the refined product is worth roughly double the crude it was made from. In a normal market a diesel crack of $20 to $25 is considered healthy. This is four to five times a good year.
The causes are cumulative rather than singular:
- The Iran war, now six months old, has disrupted Middle Eastern middle-distillate supply and Strait of Hormuz flows.
- China has slowly stopped exporting refined products, removing a marginal supplier that had been balancing the Asian market.
- Russian refining capacity has been degraded by the conflict.
- US distillate inventories are roughly 9% below year-ago levels with winter approaching.
- Global refining capacity has been shrinking for structural reasons discussed in the next section.
5.3 What Consumers Pay#
| Fuel | Price (08/31/2026) | Week over Week | Year over Year |
|---|---|---|---|
| Regular Gasoline | $4.071/gal | -$0.014 | +$0.894 |
| On-Highway Diesel | $5.599/gal | -$0.053 | +$1.865 |
| All Grades Gasoline | $4.207/gal | -$0.011 | — |
Gasoline was around $2.98 a gallon before the conflict began, and AAA had the national average at roughly $4.10 on Tuesday. Diesel at $5.599 is up $1.87 year over year, a 50% increase, and diesel is the fuel that moves freight, runs agriculture, and powers construction. Diesel inflation is not a consumer story. It is a producer-price story that arrives in consumer prices with a lag of one to two quarters.
5.4 Refiner Earnings#
The six largest American energy companies that turn oil into refined products made a combined $24.7 billion in the second quarter of 2026, nearly five times the year-ago figure.
That is the number that prompted the White House meeting on Tuesday, and it is the number that frames everything in the next section.
6. Why Nobody Is Building a New Refinery#↑ Contents
On Tuesday, September 1, President Trump gathered oil executives at the White House and urged them to build more refineries, explicitly as part of an effort to bring gasoline prices down before the November midterms. Chevron, Valero Energy, Marathon Petroleum, and PBF Energy were among those represented. ExxonMobil did not send a representative. Some companies were reportedly wary of attending at all, given recent public criticism of the industry for not cutting pump prices faster.
The refiners' answer, in effect, was no. Here is why that answer is rational.
6.1 The Structural Picture#
The US has 128 fewer refineries today than it did in 1982. The newest large-scale American refinery was completed in 1977; many still operating were built more than a century ago. This is not a recent phenomenon or a policy failure of any single administration. It is a five-decade trend of consolidation into fewer, larger, more complex facilities.
6.2 The Five Reasons#
1. The economics do not close. A new grassroots refinery requires an investment of several billion dollars and three to five years of construction. By the time it starts up, the industry expects the market to have found its footing. As Robert Campbell of Energy Aspects put it, nobody will make a huge multibillion-dollar investment on the basis of three months of record margins, and it is hard to imagine a repeat of a situation combining attacks on Russia, a Middle East crisis, and China withdrawing from refined product exports.
2. Permitting. New refineries require permits from federal, state, and local governments. The oil industry has been trying for years to persuade Congress to overhaul the permitting process for pipelines and other energy infrastructure, without success. The permitting timeline alone can exceed the construction timeline.
3. Gasoline demand is in structural decline. Gasoline consumption is expected to fall over the long term as drivers buy more electric vehicles and internal combustion engines become more efficient. Building a forty-year asset to serve a shrinking product market is a poor use of capital regardless of what this quarter's crack spread looks like.
4. Capital allocation preferences. Chevron's chief executive Mike Wirth has been explicit that the company will keep tilting toward upstream production, saying he loves the refining business and would not rule out the right opportunity, but that Chevron has long wanted to be a more upstream-weighted company. ExxonMobil's Darren Woods told investors in late July that the current utilization levels cannot be sustained over the long term.
5. Scarcity is the asset. This is the point the WSJ headline makes and it is the correct one. Every refinery that does not get built makes the existing fleet more valuable. A refiner who builds new capacity is spending billions of dollars to compete away their own margin. The incentive structure of a consolidating industry running at 98% utilization actively punishes expansion.
6.3 What Is Actually Being Built#
Not nothing, but not refineries. Capital is going into brownfield expansion and product-slate reconfiguration:
- John Auers of Novi Labs estimates that oil companies have room to add roughly 400,000 barrels a day of refining capacity by expanding existing facilities in Texas, Louisiana, and other Gulf Coast states over the next 20 years. That is approximately the capacity of one large refinery, spread across two decades.
- ExxonMobil is expected to spend about $2 billion upgrading its Baytown, Texas refinery starting in 2028, to make more diesel and lubricant base stocks and less gasoline.
- Chevron has a similar but smaller project at its Pascagoula, Mississippi refinery.
The pattern is consistent: big oil companies are spending hundreds of millions of dollars to shift refinery production away from gasoline, the fuel most affected by the rise of EVs, and toward diesel, petrochemicals, and lubricants. This is not capacity growth. It is capacity re-aiming.
6.4 The Brownsville Question#
In March, the President announced that a startup called America First Refining would open the first new US oil refinery in 50 years, in Brownsville, Texas, describing a $300 billion deal intended to bring jobs and economic growth to South Texas.
The analytical case against it is straightforward and has three parts. The region lacks the infrastructure to get sufficient crude oil to a refinery of that scale. Financing a project of that magnitude would be a serious challenge. And securing permits would be its own multi-year undertaking. Analysts are, in the WSJ's characterisation, skeptical that the project gets off the ground.
For scale: $300 billion is more than fifteen times the announced capital cost of any refinery ever built, and roughly the combined market capitalisation of several of the largest independent refiners.
7. The Global Balance: IEA Supply and Demand#↑ Contents
The IEA chart pack recorded during the terminal session gives the global frame, in millions of barrels per day.
7.1 Demand#
| Period | Global Demand (million b/d) | OECD | Non-OECD |
|---|---|---|---|
| Q2 2026 | 99.26 | 44.69 | 54.58 |
| Q3 2026 | 103.105 | — | — |
| Q4 2027 (f) | 106.67 | 46.28 | 60.38 |
7.2 Supply#
| Period | Global Supply (million b/d) |
|---|---|
| Q4 2026 (f) | 106 |
| Q1 2027 (f) | 105 |
| Q2 2027 (f) | 104 |
7.3 Reading It#
The most important line in these tables is the composition of demand growth. Between Q2 2026 and Q4 2027, global demand is forecast to rise 7.41 million b/d. Of that, 5.80 million b/d, or 78%, comes from non-OECD countries. OECD demand grows 1.59 million b/d. Non-OECD demand goes from 55% of the global total to 57%.
This is the structural fact that sits underneath every American refining decision. The growth market for petroleum products is in Asia, Africa, and Latin America, not in the United States or Europe. A US refiner deciding whether to build capacity is deciding whether to serve a domestic market in structural decline, or to build for export into markets where local refiners have a cost and proximity advantage. That calculation loses.
Meanwhile the supply forecast declines across 2027, from 106 to 104 million b/d, while demand rises toward 106.67. A market that is forecast to be structurally short at the end of the forecast horizon is a market in which inventories, including the SPR, do not get comfortably rebuilt.
8. What to Watch Next#↑ Contents
1. The SPR floor and the refill question. At the recent pace, the reserve would fall below 270 million barrels by early October. The operative questions are whether the drawdown stops, at what level DOE declares a floor, and whether the caverns can accept a refill without capital work. The two SPR import lines in the EIA table are currently zero. When they turn positive, that is the signal that the emergency phase has ended.
2. Cushing and WTI time spreads. With Cushing at 22.5 million barrels against a roughly 20 million barrel operational floor, another sequence of draws would put the WTI delivery hub back in stress. Watch the prompt-month time spread rather than the flat price; hub stress shows up there first.
3. Autumn turnaround season. Refiners have deferred maintenance to capture record margins. October and November are when that bill comes due. Deferred turnarounds convert into unplanned outages, and an unplanned outage in a system running at 98% with no spare capacity produces a price response with no shock absorber.
4. The distillate restock. Distillate at 104.2 million barrels needs to build before winter. With cracks at $100, refiners have every incentive to maximise distillate yield, but they are already at 98% utilization. There is no throughput lever left, only yield shifting away from gasoline.
5. The next EIA release. The Weekly Petroleum Status Report is normally published Wednesday. Because of the Labor Day holiday on Monday, September 7, the next release is scheduled for Thursday, September 10, 2026.
6. Policy risk in both directions. An administration that has already released 172 million barrels from the SPR and convened refiners at the White House ahead of the midterms has demonstrated willingness to intervene. Export restrictions on refined products, which have been floated in previous price spikes, are the tail risk the refining sector is not currently pricing.
Conclusion and Key Takeaways#↑ Contents
-
The US produces 13.862 million b/d of crude and refines 17.496 million b/d. That 3.63 million b/d gap, plus a fleet configured for heavy sour crude while the shale patch produces light sweet, is the entire explanation for why the world's largest oil producer imports 6.77 million b/d.
-
Refinery utilization is 98.0% against a capacity base that shrank 250,000 b/cd in 2025 to 18.2 million b/cd. Crude runs are up 627,000 b/d year over year. Every barrel of incremental throughput has come from running harder, not from building more.
-
The Strategic Petroleum Reserve is at 286.6 million barrels, the lowest since March 1983, after a 39 million barrel drawdown in nine weeks and roughly 352 million barrels over four years. More than a quarter of what remains was not available for drawdown as of December 2025 due to cavern and construction outages, so the deliverable reserve is materially smaller than the headline.
-
Cushing at 22.5 million barrels is about 2.5 million barrels above the level at which the WTI delivery hub stops working properly, and it spent weeks below that line in July.
-
The diesel crack spread hit a record $102 a barrel. Retail diesel is $5.599 a gallon, up $1.87 year over year. The six largest US refiners earned $24.7 billion in Q2, roughly five times the year-ago figure.
-
None of that profit is buying new refining capacity. Grassroots economics do not close, permitting is prohibitive, gasoline demand is in structural decline, capital prefers upstream, and scarcity is precisely what makes the existing assets valuable. The most that is planned is about 400,000 b/d of brownfield creep over twenty years, plus product-slate shifts at Baytown and Pascagoula away from gasoline and toward diesel and lubricants.
-
The binding constraint on American energy is not oil in the ground. It is the capacity to turn it into fuel, and that constraint is getting tighter by roughly 1% a year while demand for the products, particularly middle distillates, does not.
Methodology and Sources#↑ Contents
Primary data. Inventory, production, refinery, import, export, and price series are from the US Energy Information Administration's Weekly Petroleum Status Report and associated data navigator series, for the week ending August 28, 2026, released September 2, 2026. Refinery capacity figures are from the EIA Refinery Capacity Report as of January 1, 2026.
Terminal research. Regional capacity and utilization splits, state-level production, monthly regional export volumes, the OLCAUSA refinery capacity index, and the IEA supply and demand tables were compiled during a Bloomberg Terminal session using the NRGZ energy function, including the DOE, BP, EEI, and IEA chart packs and the EIA Table 9 panel. Figures transcribed from field notes are identified as such in the text.
Reporting. Detail on the White House meeting, refiner capital allocation, the Auers capacity estimate, the Baytown and Pascagoula projects, the America First Refining proposal, and executive commentary is drawn from Collin Eaton, "Owning a Refinery Is More Profitable Than Building One," The Wall Street Journal, September 4, 2026, page B9.
A caveat on weekly data. EIA weekly figures are estimates and are revised in the monthly series, sometimes materially. Weekly production in particular is modelled rather than surveyed. Treat single-week moves as directional, not definitive.