MARKETS · RATES · U.S. FINANCIAL STABILITY
By Niraj Neupane, CA (ICAI) Quantitative Researcher, Korvane · Financial Economist, Calderyn Institute
Key takeaways
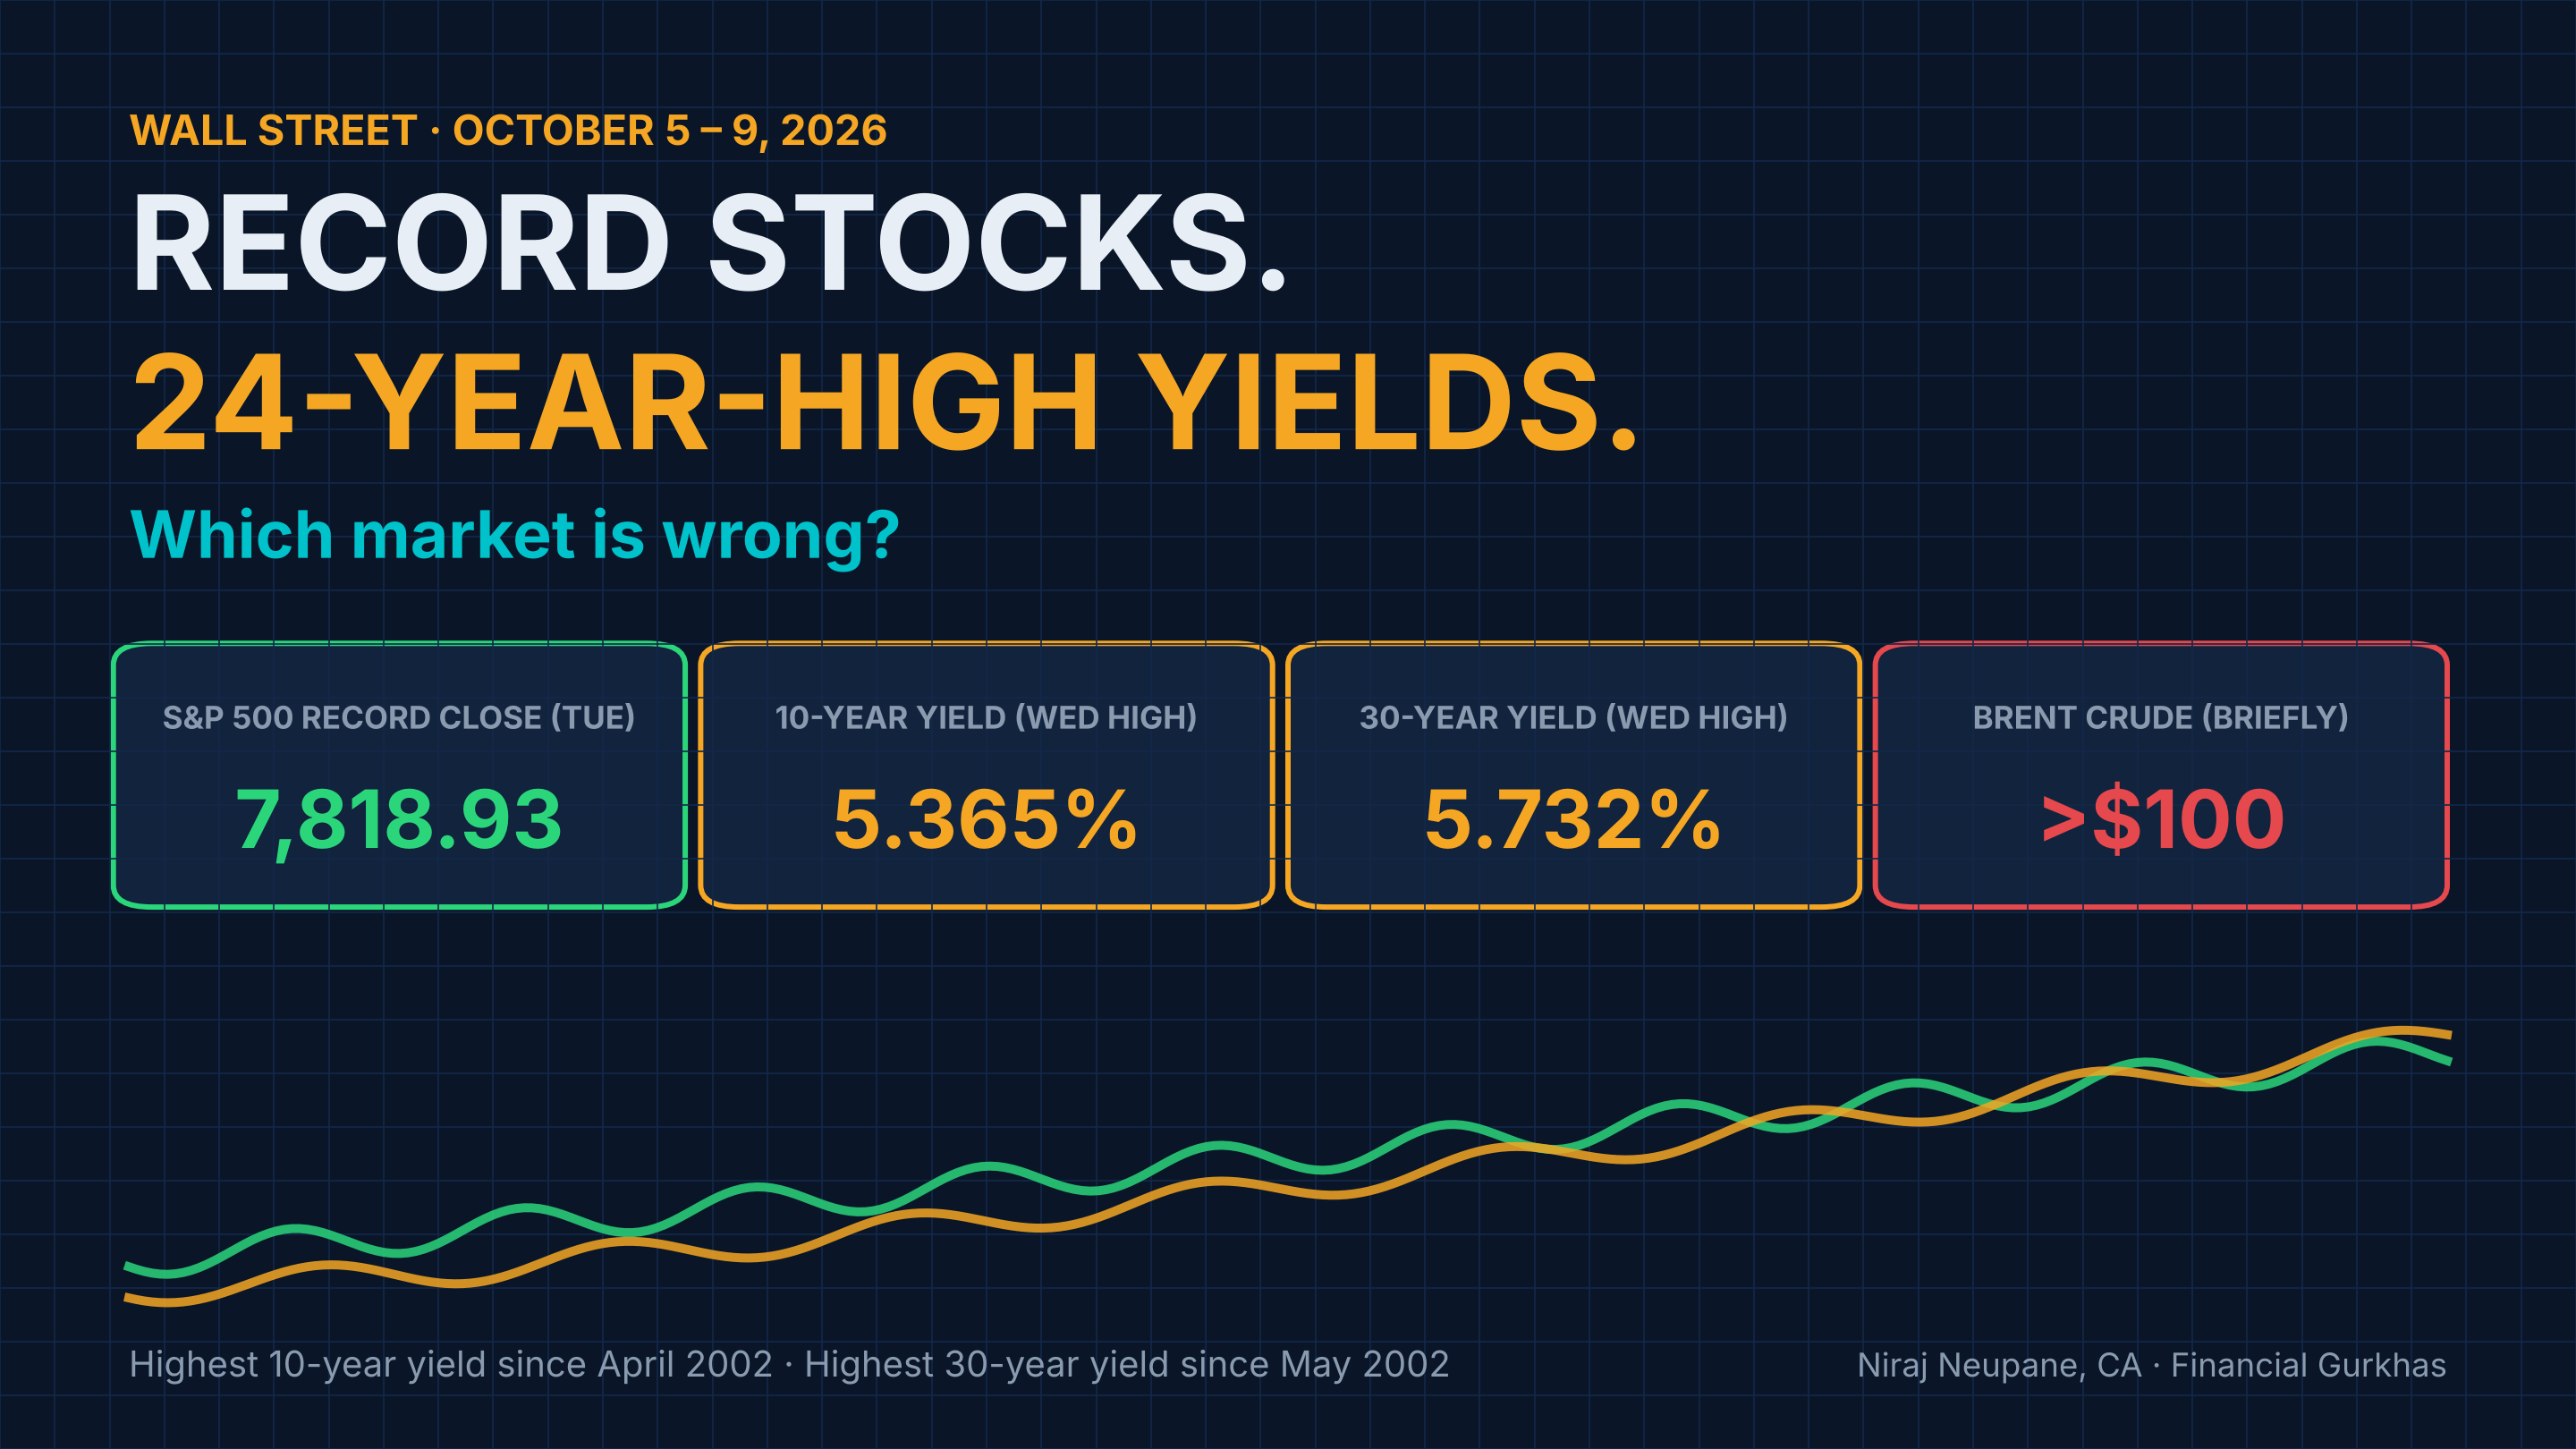
The news. On Tuesday, October 6, the S&P 500 closed at a record 7,818.93. On Wednesday, the 10-year Treasury yield spiked to 5.365%, its highest since April 2002, and the 30-year reached 5.732%, its highest since May 2002.
The puzzle. The bond market is pricing persistent inflation and high-for-longer rates High for longerThe expectation that the Federal Reserve keeps interest rates elevated for an extended period, rather than cutting soon.. The stock market is pricing strong, AI-driven earnings growth. Those are two different futures.
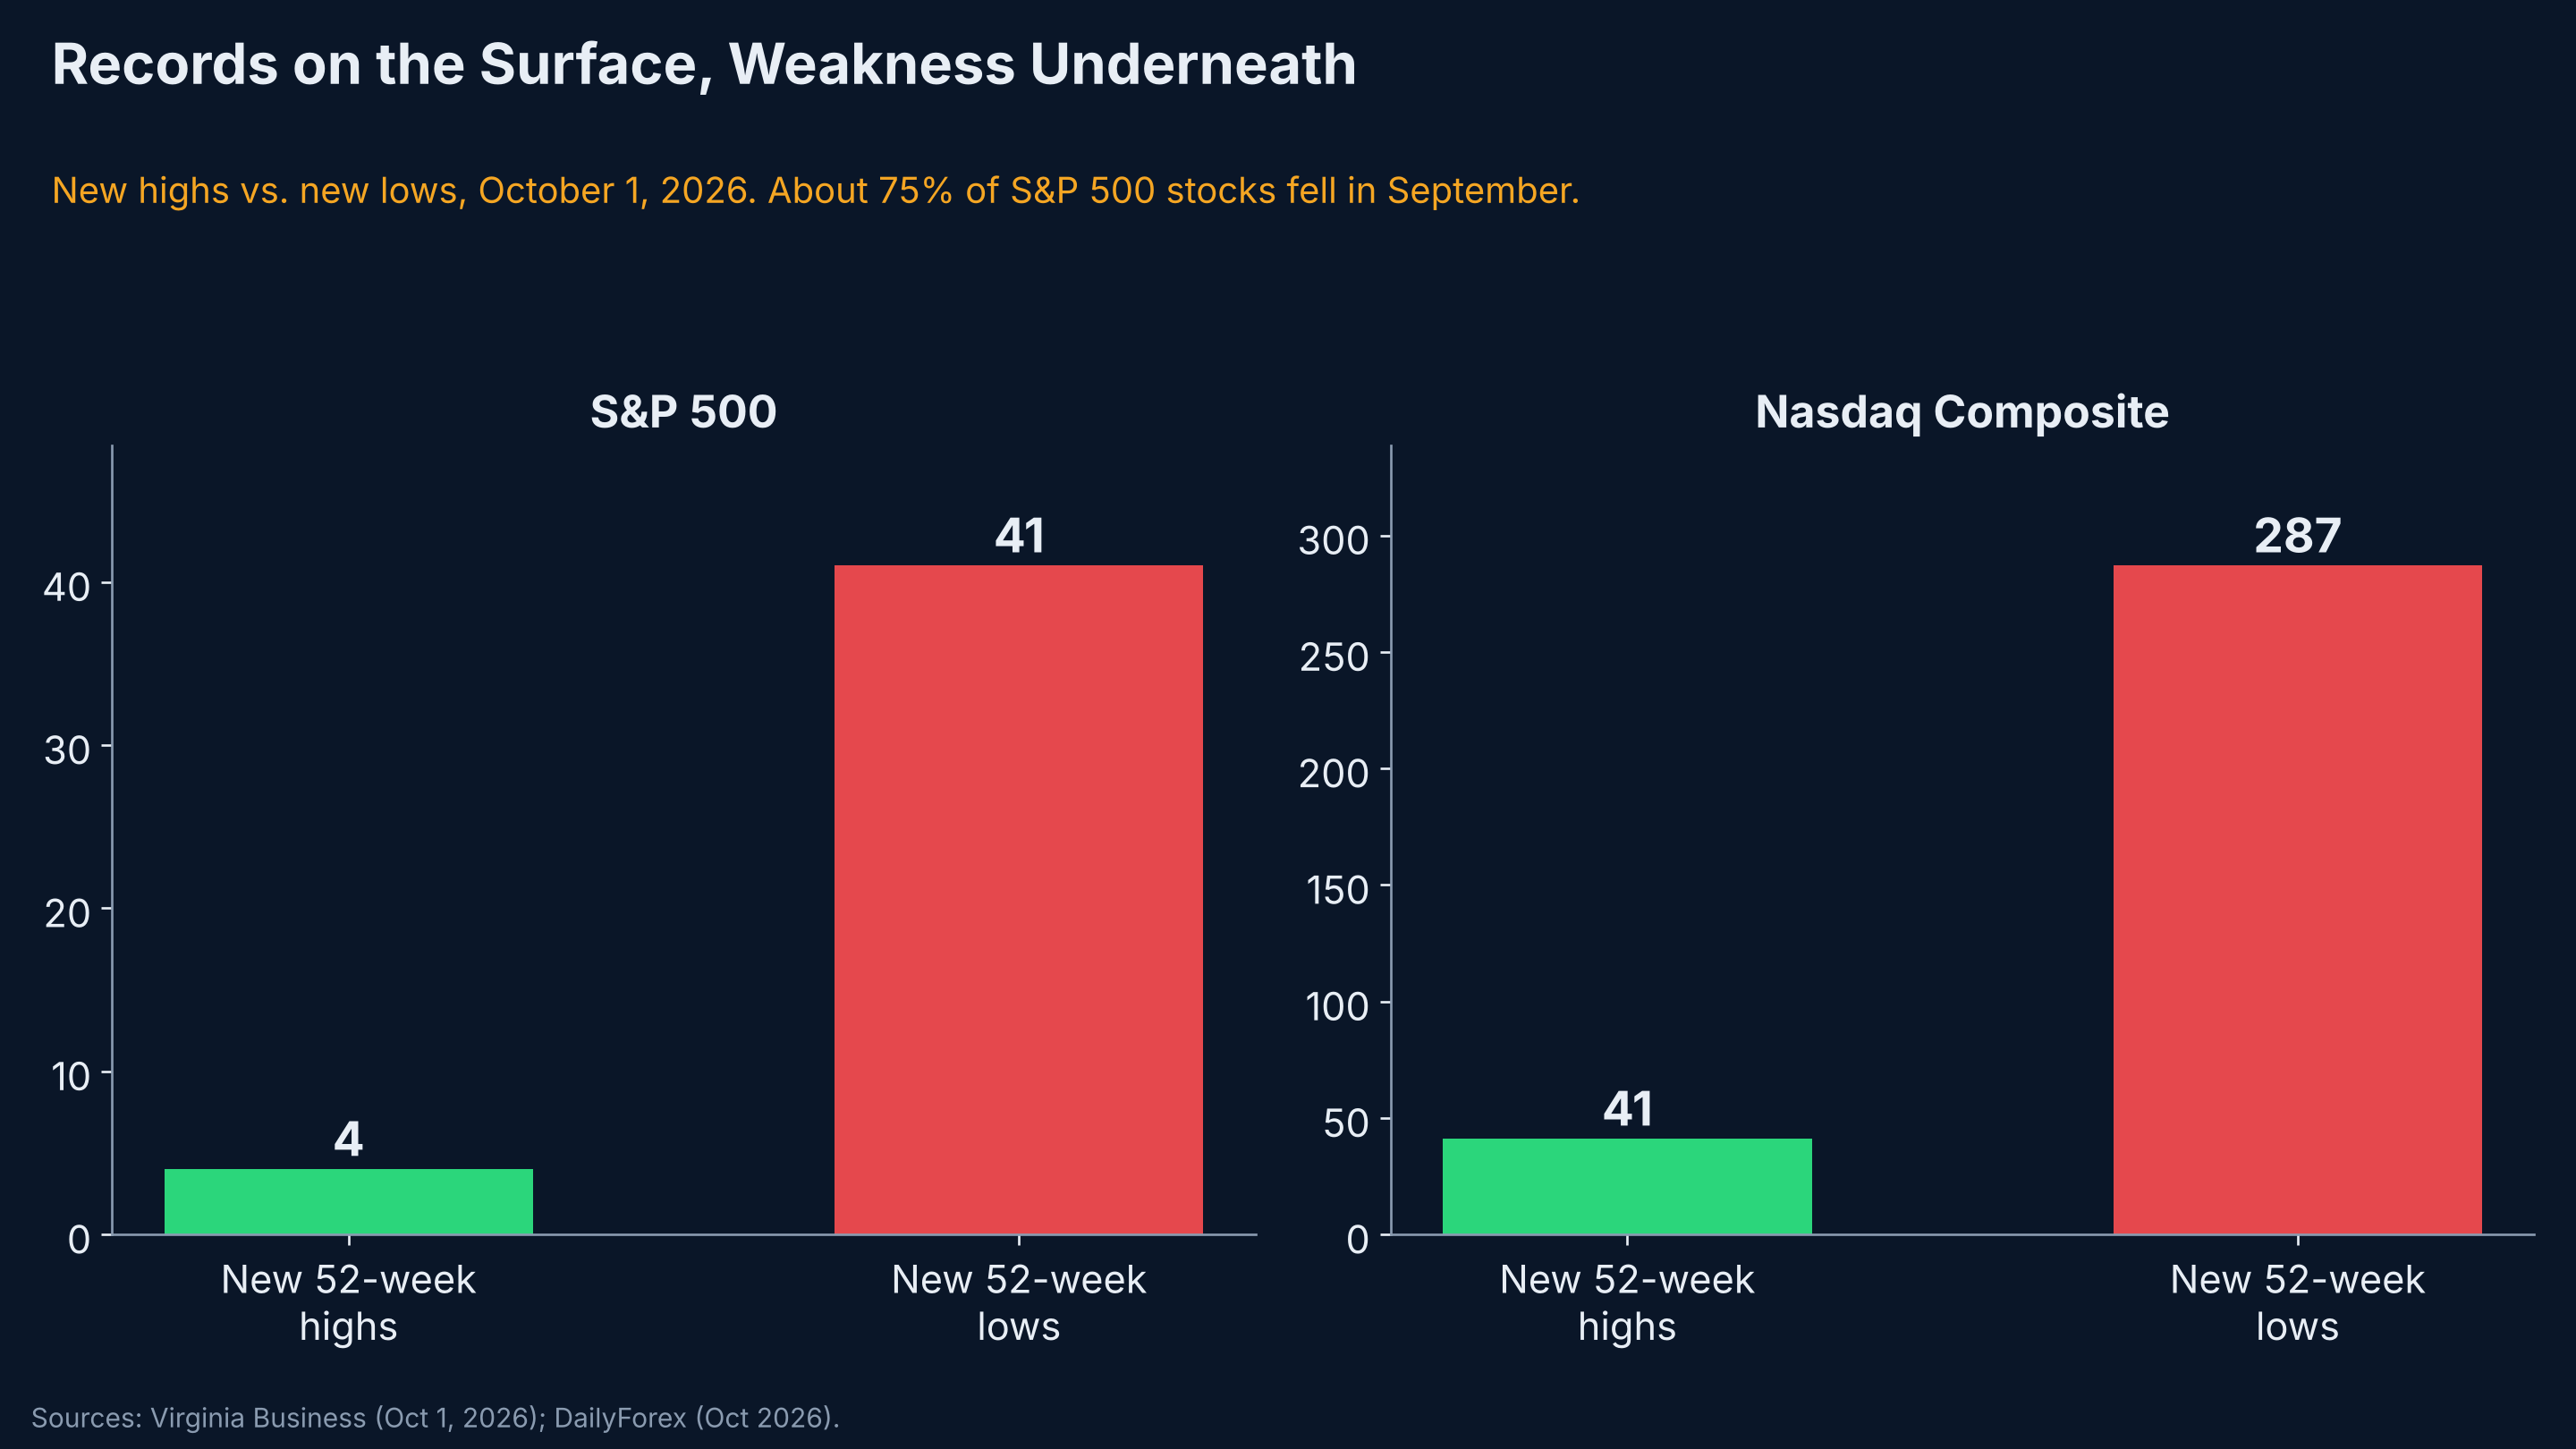
The warning signs. The records hide weak breadth Market breadthHow many stocks take part in a move. Narrow breadth means a few large companies drive the index while most stocks lag or fall.: about 75% of S&P 500 stocks fell in September, and new 52-week lows far outnumber new highs.
The risk lens. Through my Tail Episode Risk research, Treasuries are in a persistent single-market stress episode. The systemic danger begins if equities join them in their tails In its tailA market is in its tail when its daily loss exceeds an extreme threshold, such as its worst 5% of days..
What's in this report#
- 1. The week: two markets, two different stories
- 2. The bond market's story: higher for longer
- 3. The stock market's story: AI earnings will carry it
- 4. The valuation math: when bonds out-yield stocks
- 5. Four ways this resolves
- 6. The risk lens: from a bond episode to a systemic episode
- 7. Why this matters beyond Wall Street
- 8. What risk managers should watch next
- Frequently Asked Questions
- The bottom line
1. The week: two markets, two different stories#↑ Contents
Monday set the tone. The Nasdaq Composite climbed 0.71% to a fresh intraday IntradayDuring the trading day, as opposed to at the close. An intraday peak is the highest level reached at any moment, even if the market closed lower. peak near 27,400, and the S&P 500 rose 0.42%, even as 20- and 30-year Treasury yields hit fresh 24-year highs.
Tuesday brought another record. The S&P 500 climbed 0.58% to 7,818.93, extending a winning streak led by technology stocks.
Wednesday was the stress test. Long-dated yields spiked to new 24-year highs, Brent crude Brent crudeThe global benchmark price for oil, based on North Sea crude. Most of the world’s oil is priced off it. briefly crept above $100 a barrel, and the Fed's September meeting minutes FOMC minutesThe detailed record of a Federal Reserve policy meeting, released three weeks later. Markets read it for how worried officials are about inflation. revived inflation concerns. The 10-year yield touched 5.365% and the 30-year 5.732%. Stocks slipped but held up: the S&P 500 fell 0.2% to 7,801.77, the Nasdaq 100 fell 0.2%, and the Dow lost about 0.7%. One event prevented a worse day: a solid $39 billion 10-year Treasury auction Treasury auctionThe U.S. Treasury sells new debt to investors at regular auctions. Strong demand lets it borrow at a lower yield; weak demand pushes yields up across the market., which cleared at 5.30% and pulled yields back from their highs.
| Indicator | Level this week | Context |
|---|---|---|
| S&P 500 | Record close 7,818.93 (Tue) | Five-day winning streak, led by tech |
| Nasdaq Composite | Fresh intraday peak near 27,400 (Mon) | AI and chip leadership |
| 10-year Treasury yield | 5.365% (Wed high) | Highest since April 2002 |
| 30-year Treasury yield | 5.732% (Wed high) | Highest since May 2002 |
| 10-year auction | $39B at 5.30% | Solid demand eased yields intraday |
| Brent crude | Briefly above $100 | U.S.–Iran war keeps energy risk high |
| October Fed hike odds | Below 20% (CME FedWatch CME FedWatchA CME Group tool that converts fed funds futures prices into the market-implied probability of each possible Fed decision.) | Down from 37.6% a week earlier |
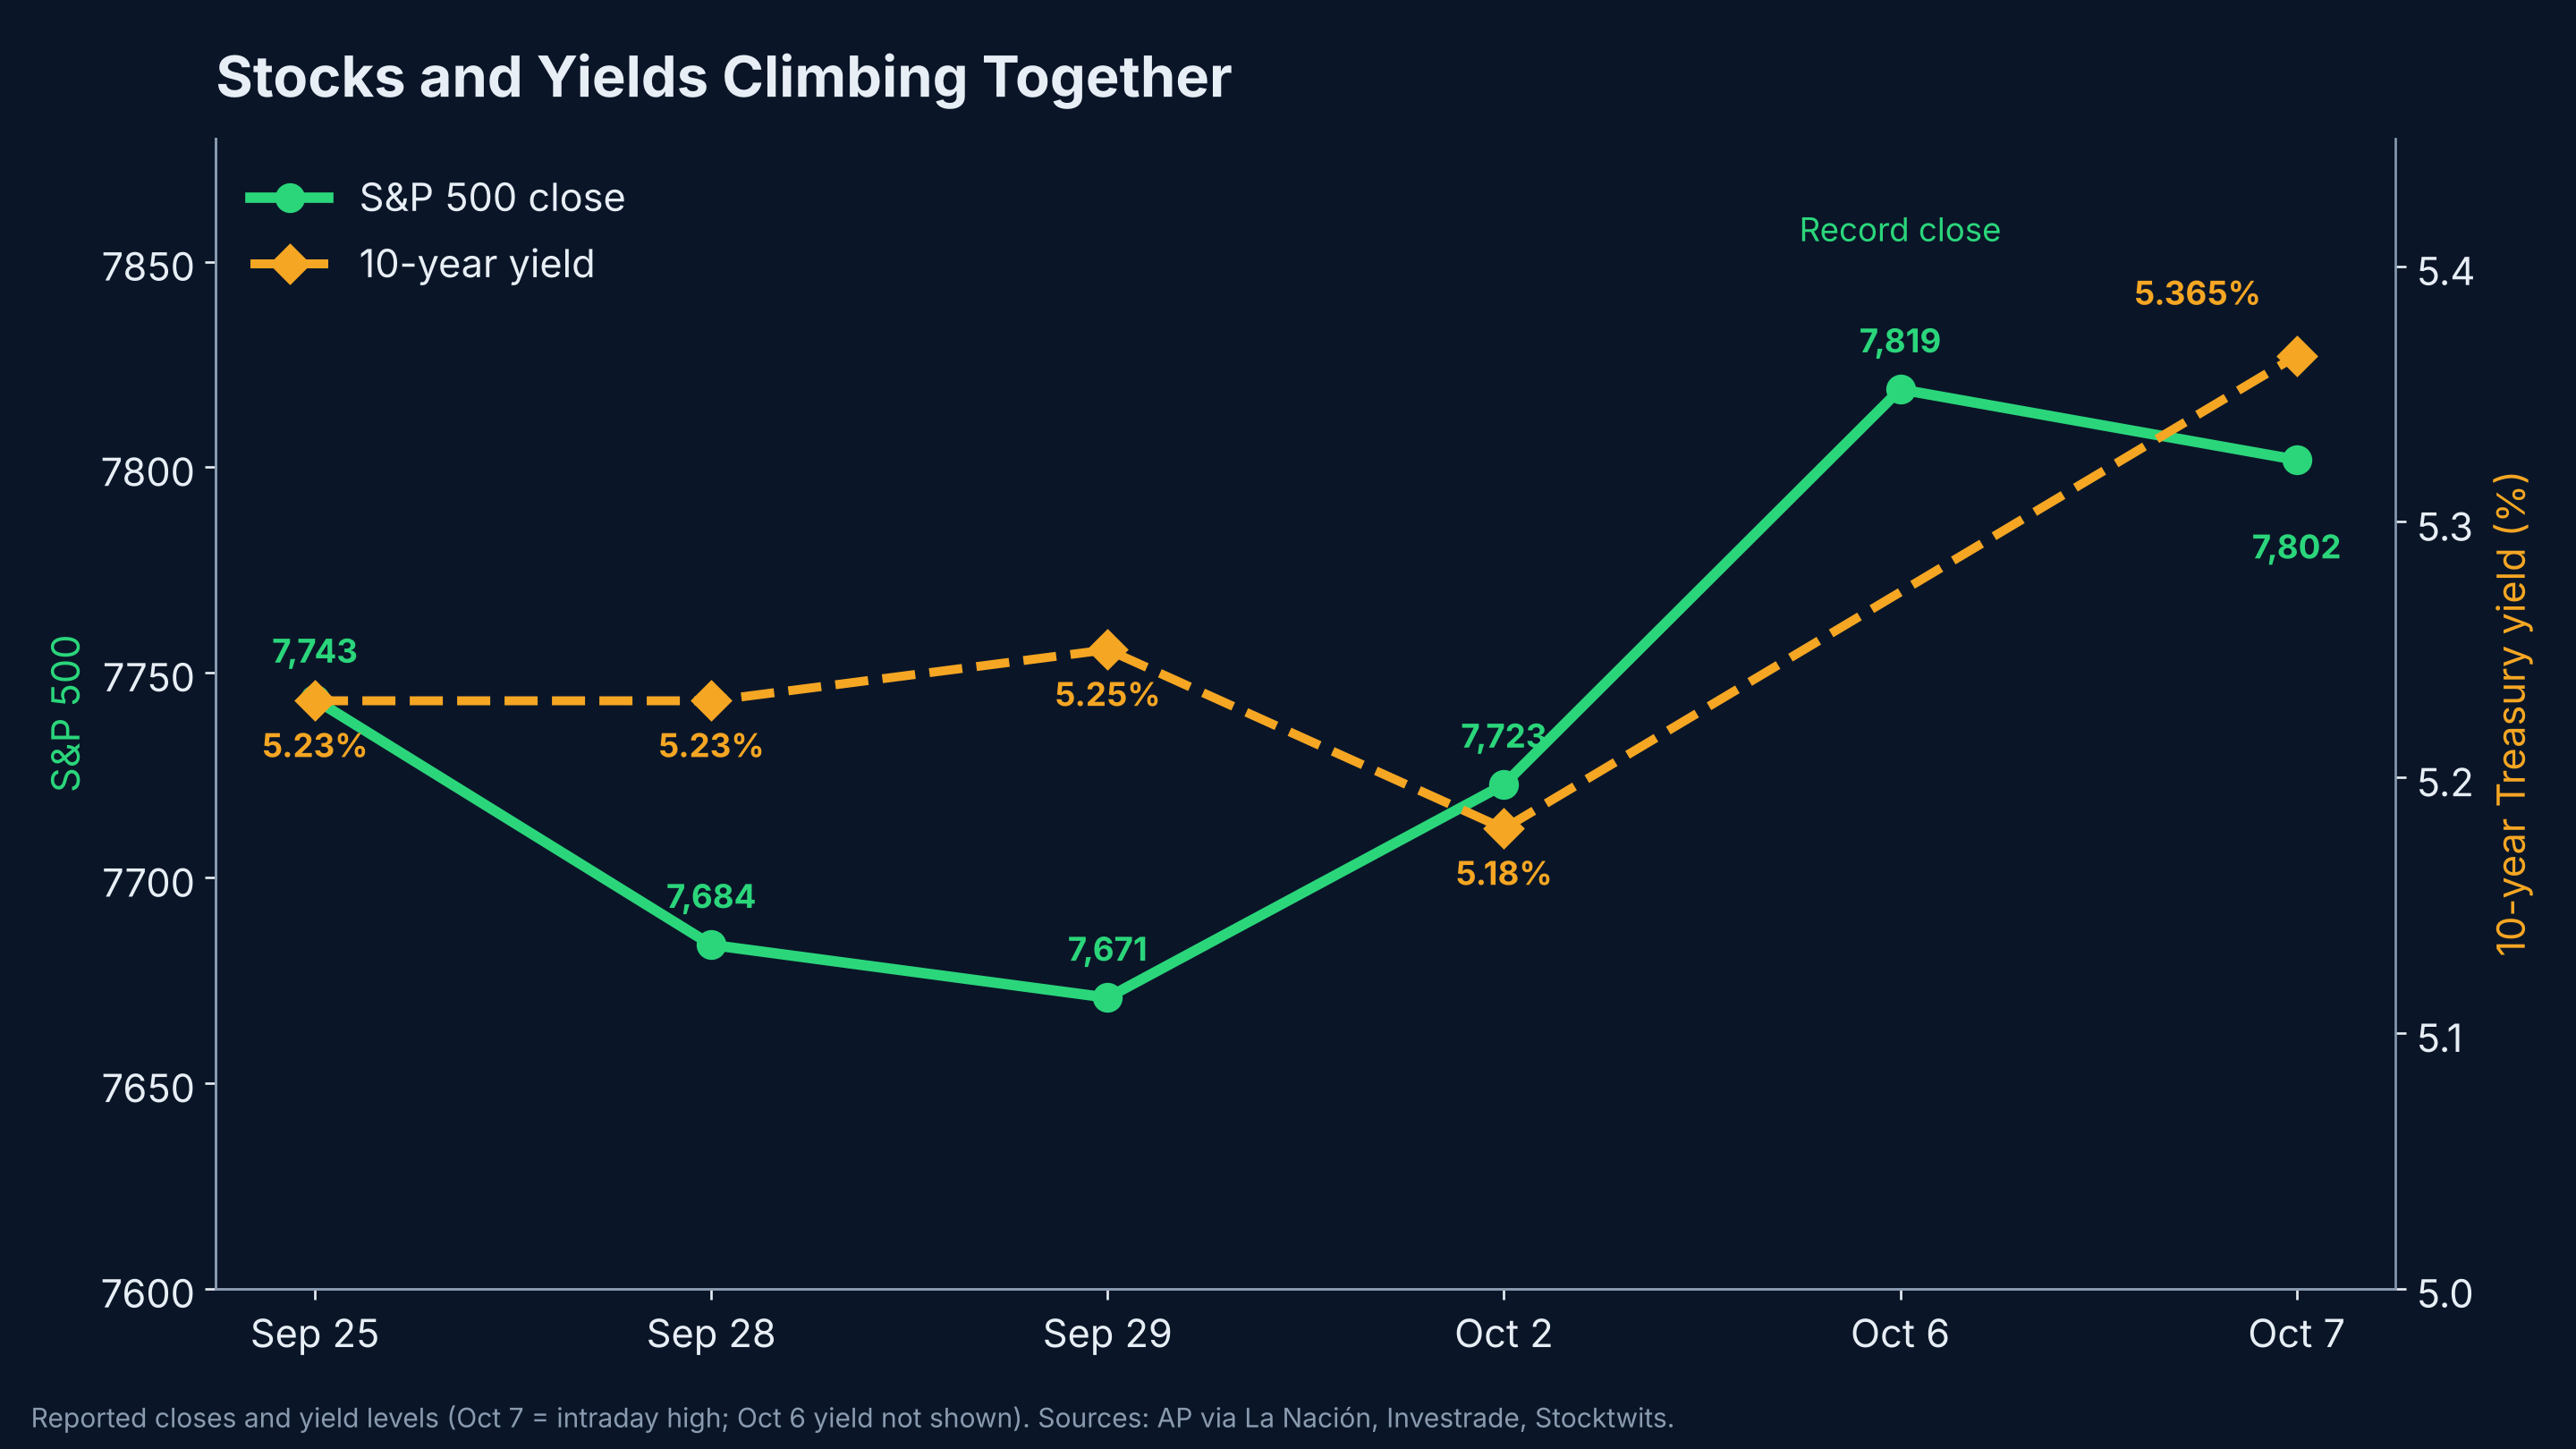
Normally, rising yields pull stock prices down, because future earnings are worth less when safe bonds pay more. This week, both rose at the same time. That is the standoff.
2. The bond market's story: higher for longer#↑ Contents
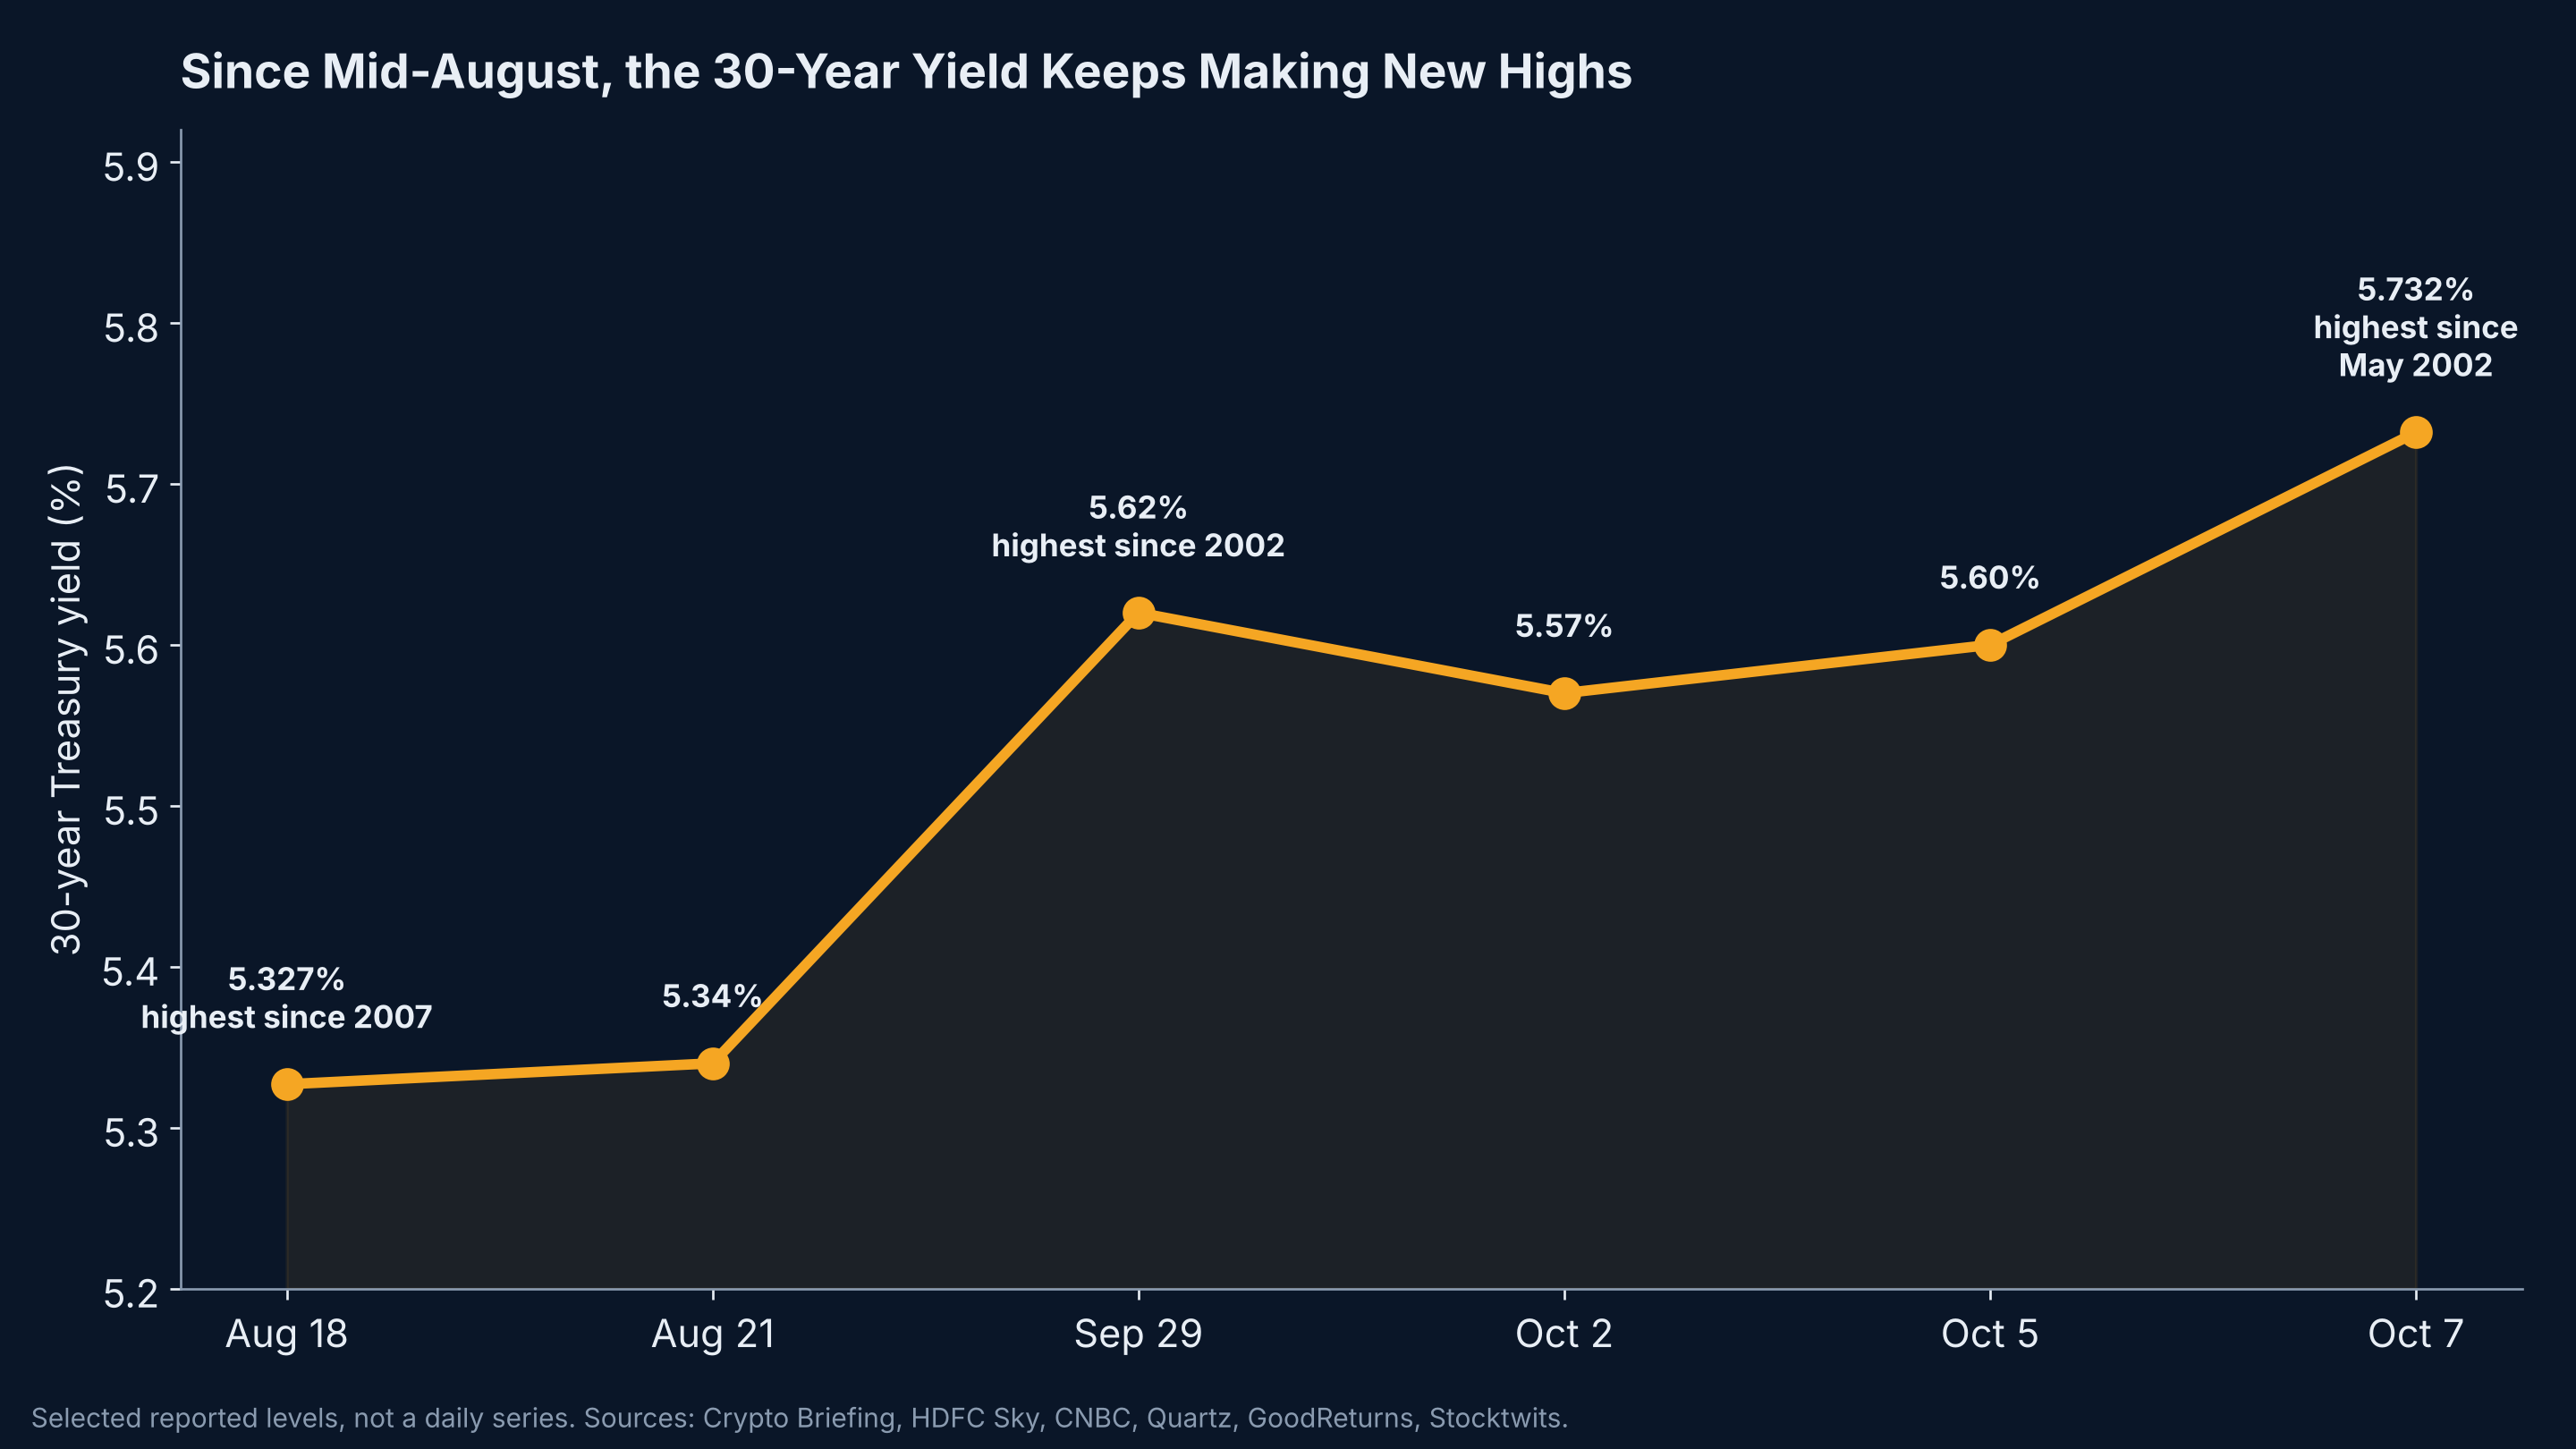
The bond market is not having a bad week. It is having a bad quarter. The 30-year yield first broke above 5.3% in mid-August, its highest since 2007. It then crossed 5.6% on September 29 and pushed to 5.73% this week. In September alone, the 10-year yield rose 11%, and the 2-year rose more than 12%.
Three forces are behind it:
| Driver | Evidence |
|---|---|
| Sticky inflation | Fed minutes highlighted persistent inflation concerns; the Fed projects PCE PCE inflationThe Personal Consumption Expenditures price index, the inflation gauge the Federal Reserve targets at 2%. inflation of 3.7% at the end of 2026 |
| Energy shock | Brent briefly above $100 as the war with Iran continues |
| Supply and positioning | Heavy Treasury issuance, with record hedge-fund holdings in the Treasury market Hedge-fund Treasury positionsHedge funds hold much of their Treasury exposure through leveraged trades financed with borrowed money. A sharp jump in yields can force them to sell, pushing yields higher still. |
Markets now expect the Fed to pause in October rather than hike. But a pause is not a cut. In one portfolio manager's words, there is still an expectation for more rate hikes, just not at every meeting.
3. The stock market's story: AI earnings will carry it#↑ Contents
Equities are telling a different story: earnings, especially from AI, will grow fast enough to absorb higher rates. The leadership is narrow. Gains have been led by technology and AI-linked names, while rate-sensitive sectors lag.
Underneath the records, the market is weaker than it looks:
| Breadth signal | Reading |
|---|---|
| S&P 500 stocks that fell in September | About 75% |
| S&P 500 new 52-week highs vs. lows 52-week highs and lowsStocks trading at their highest or lowest price of the past year. Many more new lows than new highs signals weakness beneath the index. (Oct 1) | 4 highs vs. 41 lows |
| Nasdaq new 52-week highs vs. lows (Oct 1) | 41 highs vs. 287 lows |
| Market internals Market internalsMeasures of what the typical stock is doing, such as how many rose (advancers) versus fell (decliners), rather than the index level. (Oct 7) | Decliners decisively ahead of advancers |
A record index driven by a handful of large stocks is more fragile than a record driven by the whole market. If AI leadership stumbles, there is less underneath to hold the index up.
4. The valuation math: when bonds out-yield stocks#↑ Contents
The simplest way to see the tension is to compare the earnings yield Earnings yieldAnnual earnings per share divided by the share price, the inverse of the P/E ratio. A P/E of 20 is an earnings yield of 5%. of stocks (earnings divided by price) with the yield on a risk-free 10-year Treasury.
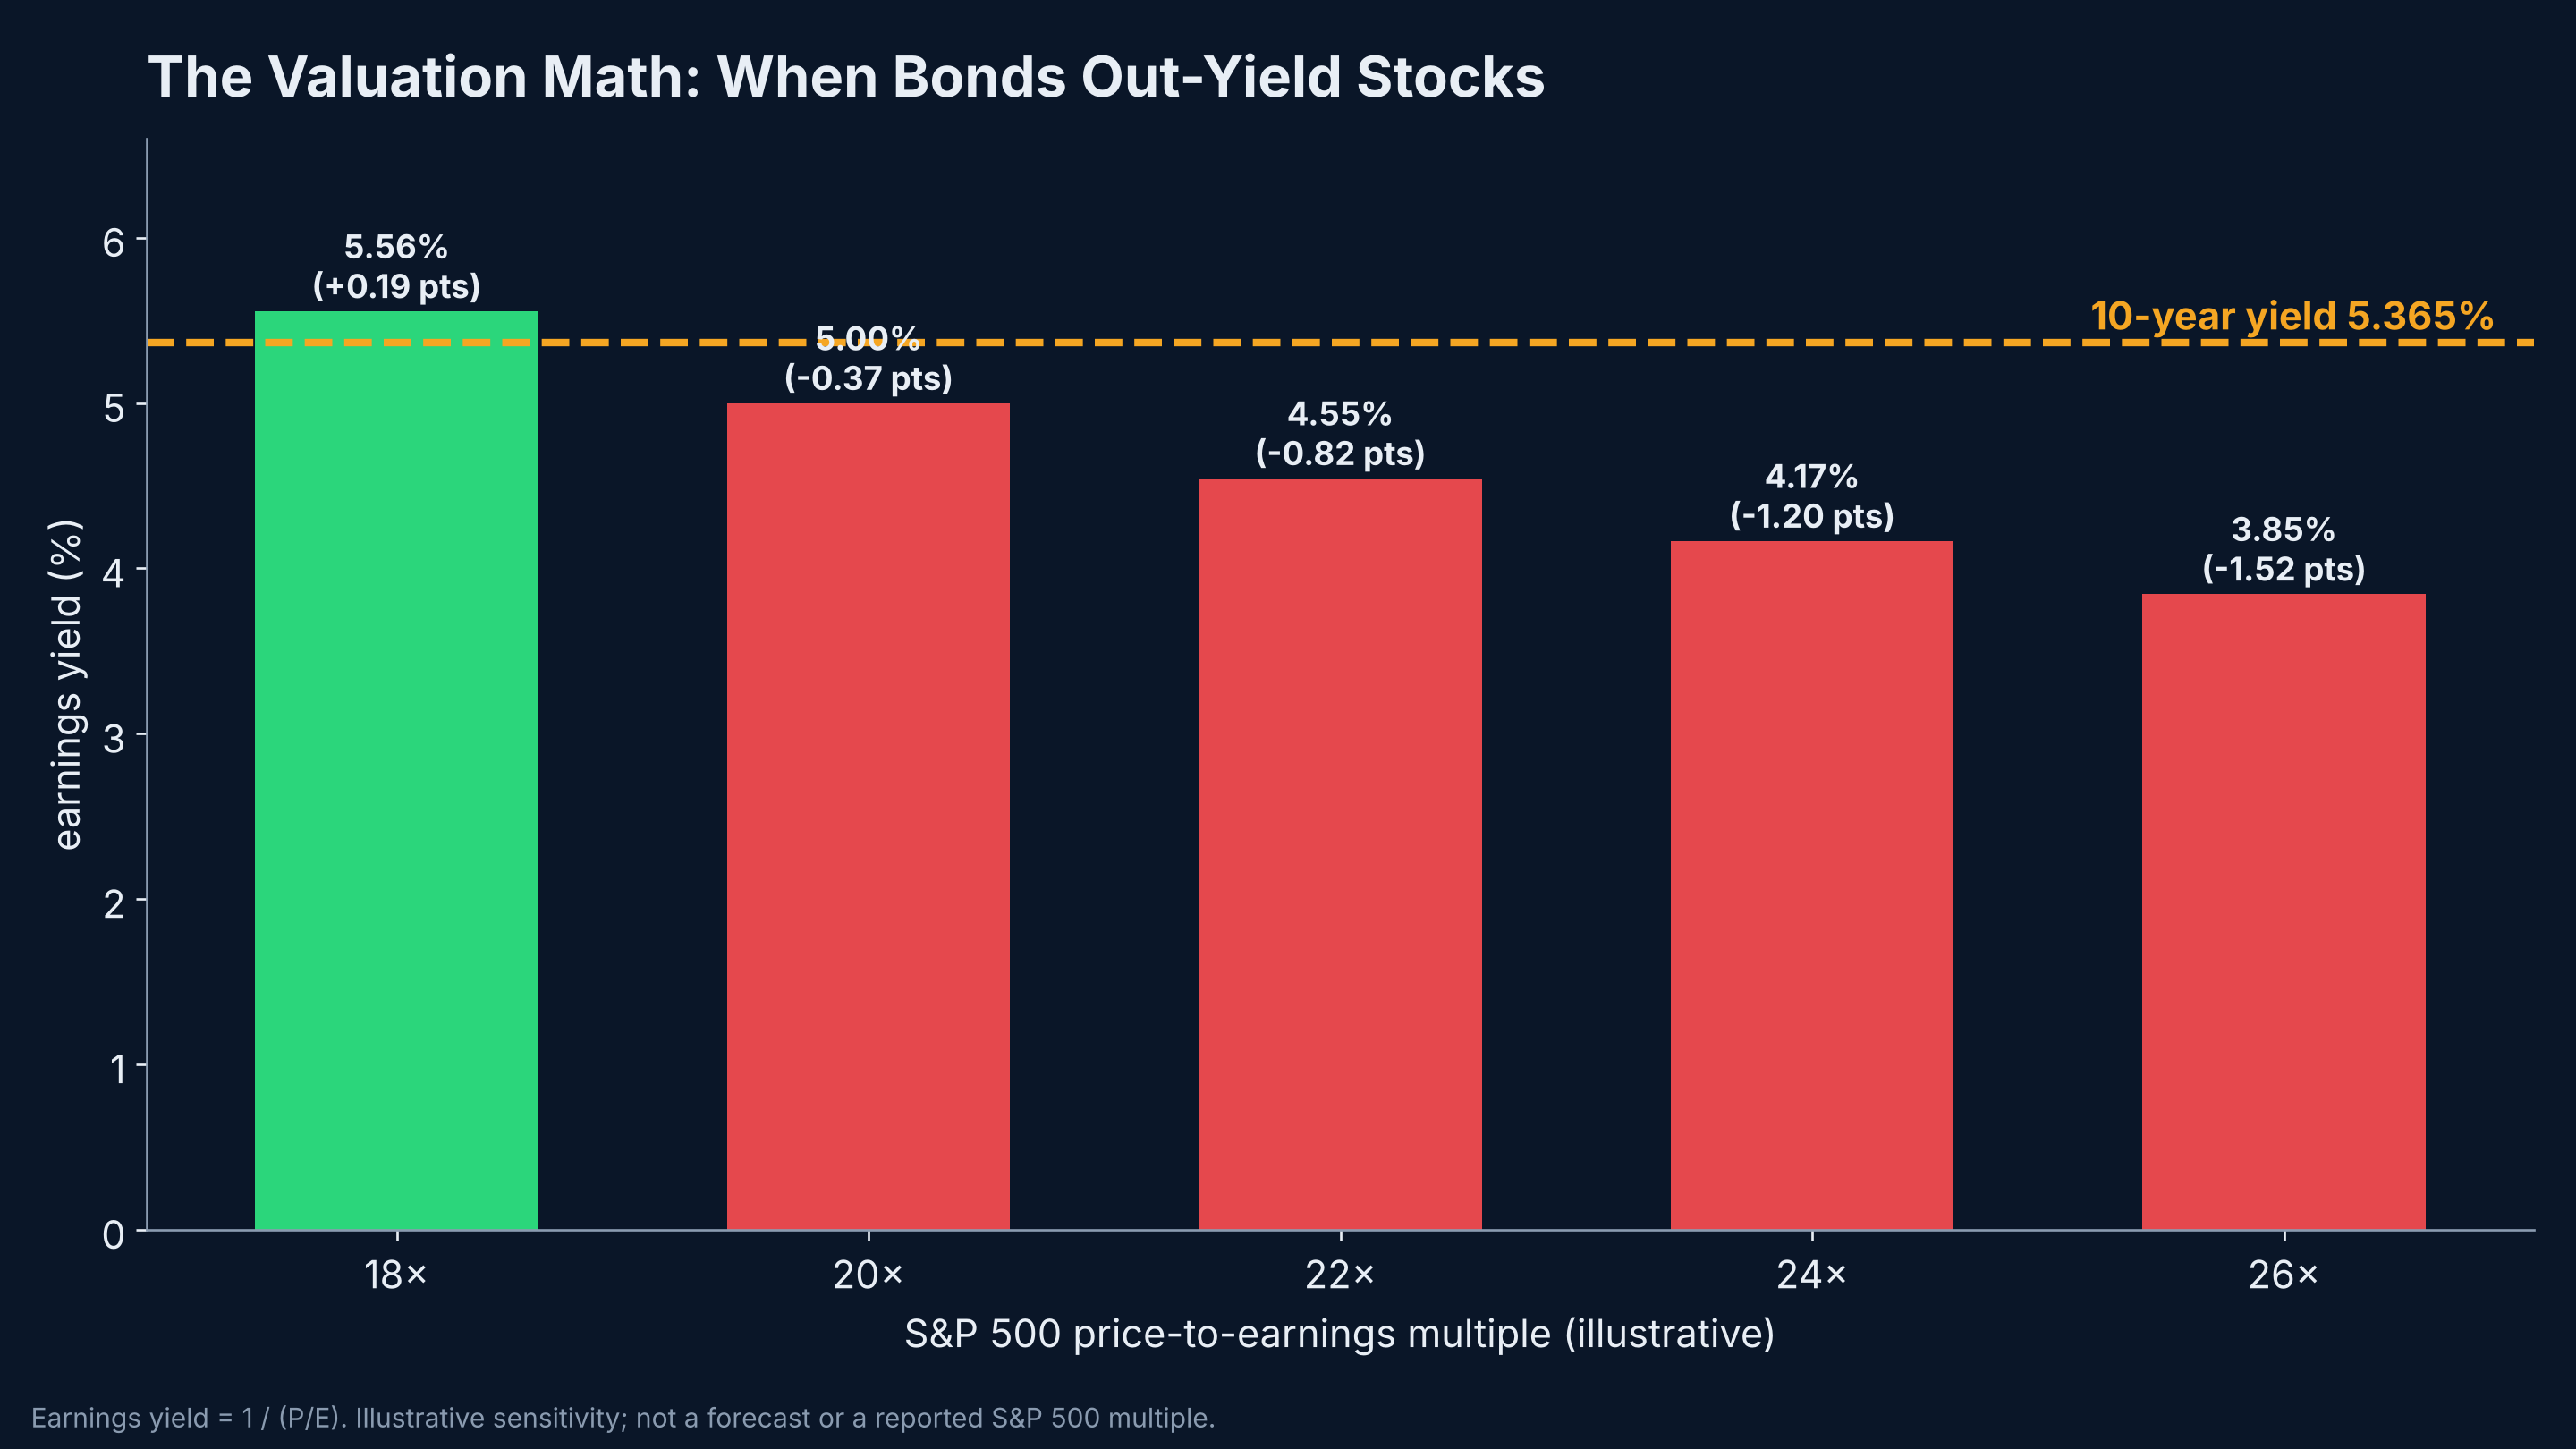
| S&P 500 P/E P/E ratioPrice-to-earnings ratio: the share price divided by annual earnings per share. It shows how many years of current earnings the price represents. (illustrative) | Earnings yield | vs. 10-year at 5.365% |
|---|---|---|
| 18× | 5.56% | +0.19 pts |
| 20× | 5.00% | −0.37 pts |
| 22× | 4.55% | −0.82 pts |
| 24× | 4.17% | −1.20 pts |
| 26× | 3.85% | −1.52 pts |
Illustrative sensitivity, not a reported S&P 500 multiple.
At most multiples a large-cap index trades at today, a riskless Treasury pays more than the stock market's current earnings yield. Investors holding stocks are betting that earnings growth will close the gap. That is the stock market's story in one number, and it is why the coming earnings season matters so much.
5. Four ways this resolves#↑ Contents
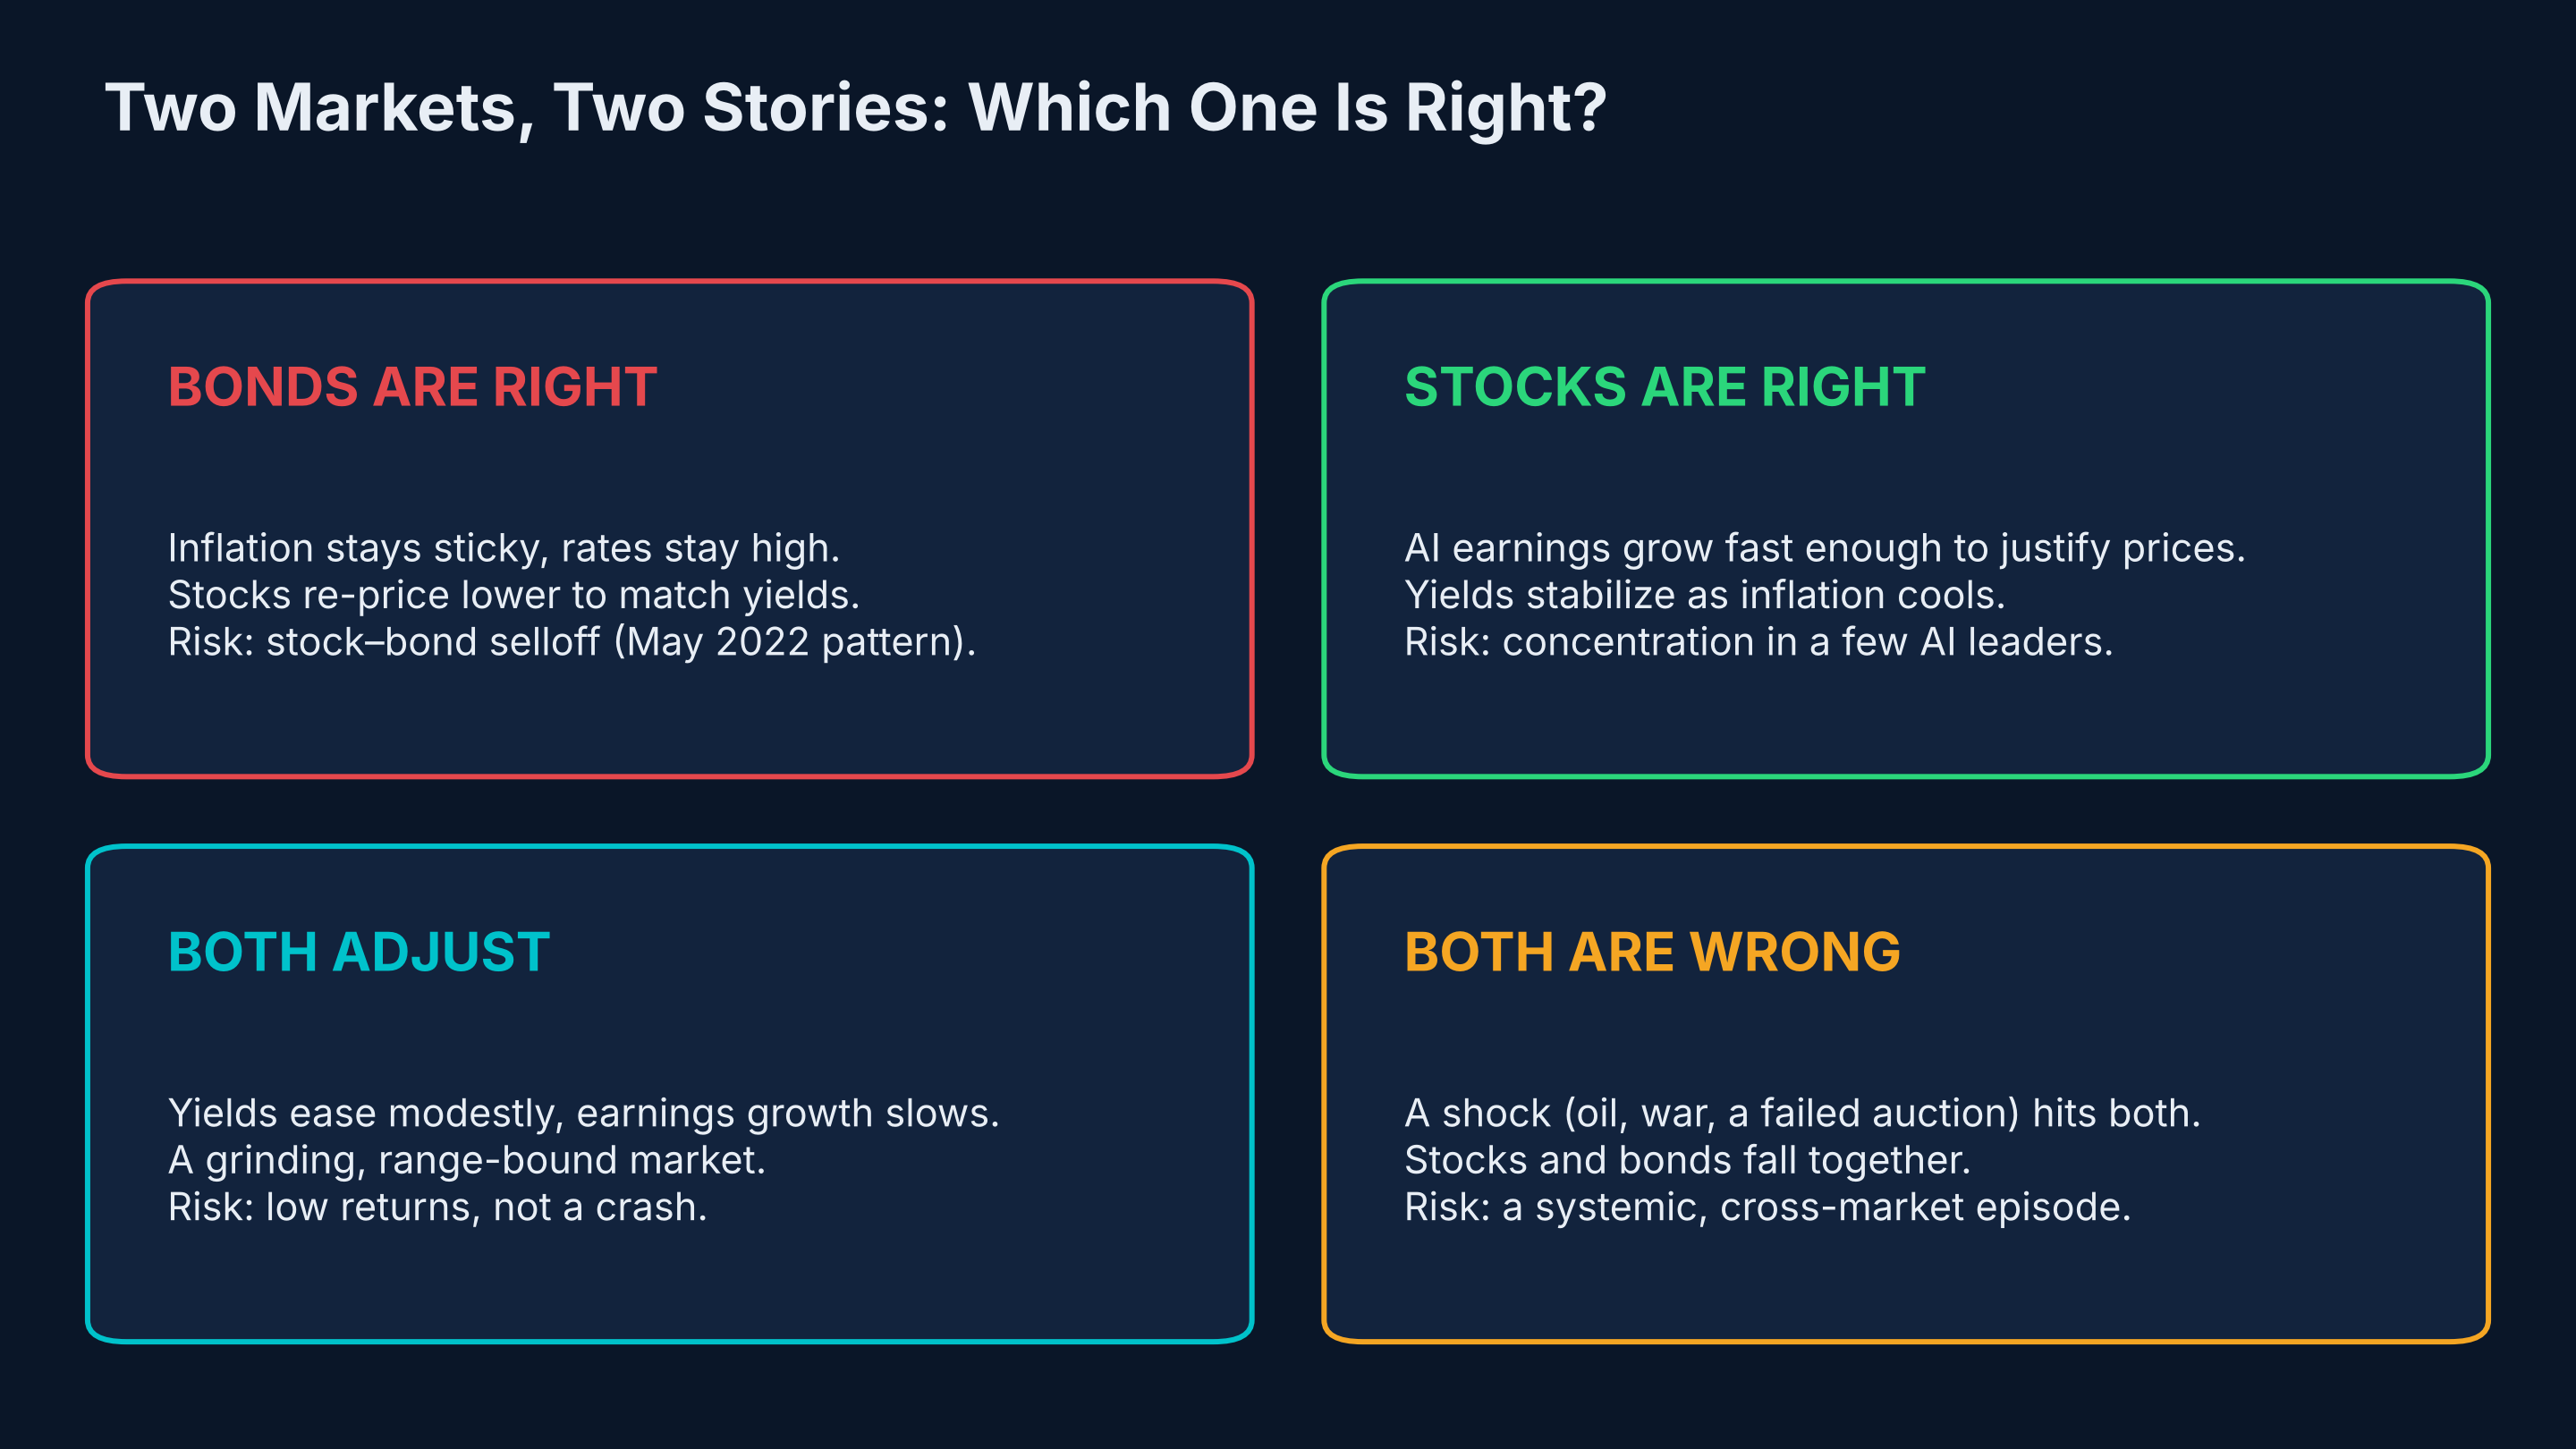
| Scenario | What happens | Main risk |
|---|---|---|
| Bonds are right | Inflation stays sticky; stocks re-price lower to match yields | A stock–bond selloff like May 2022 |
| Stocks are right | AI earnings justify prices; yields stabilize as inflation cools | Heavy concentration in a few AI leaders |
| Both adjust | Yields ease modestly, earnings growth slows | Low returns, not a crash |
| Both are wrong | A shock (oil, war, a failed auction) hits both markets | A systemic, cross-market episode |
The fourth scenario is the one risk managers should prepare for, even if it is not the most likely.
6. The risk lens: from a bond episode to a systemic episode#↑ Contents
My research studies exactly this question: when does stress in one market become stress across many?
- Conditional Tail Episode Risk (TER/CTER) Tail Episode Risk (TER/CTER)Measures the worst connected run of extreme-loss days in one market, rather than single bad days. CTER adds how likely such a run is, given current conditions. measures how severe a connected run of extreme losses becomes in a single market, rather than looking at one bad day at a time.
- Systemic Tail Episode Risk (STER) extends this across markets. It counts a stress episode as systemic only when several markets are in their tails at the same time, and measures how severe that synchronized episode becomes.
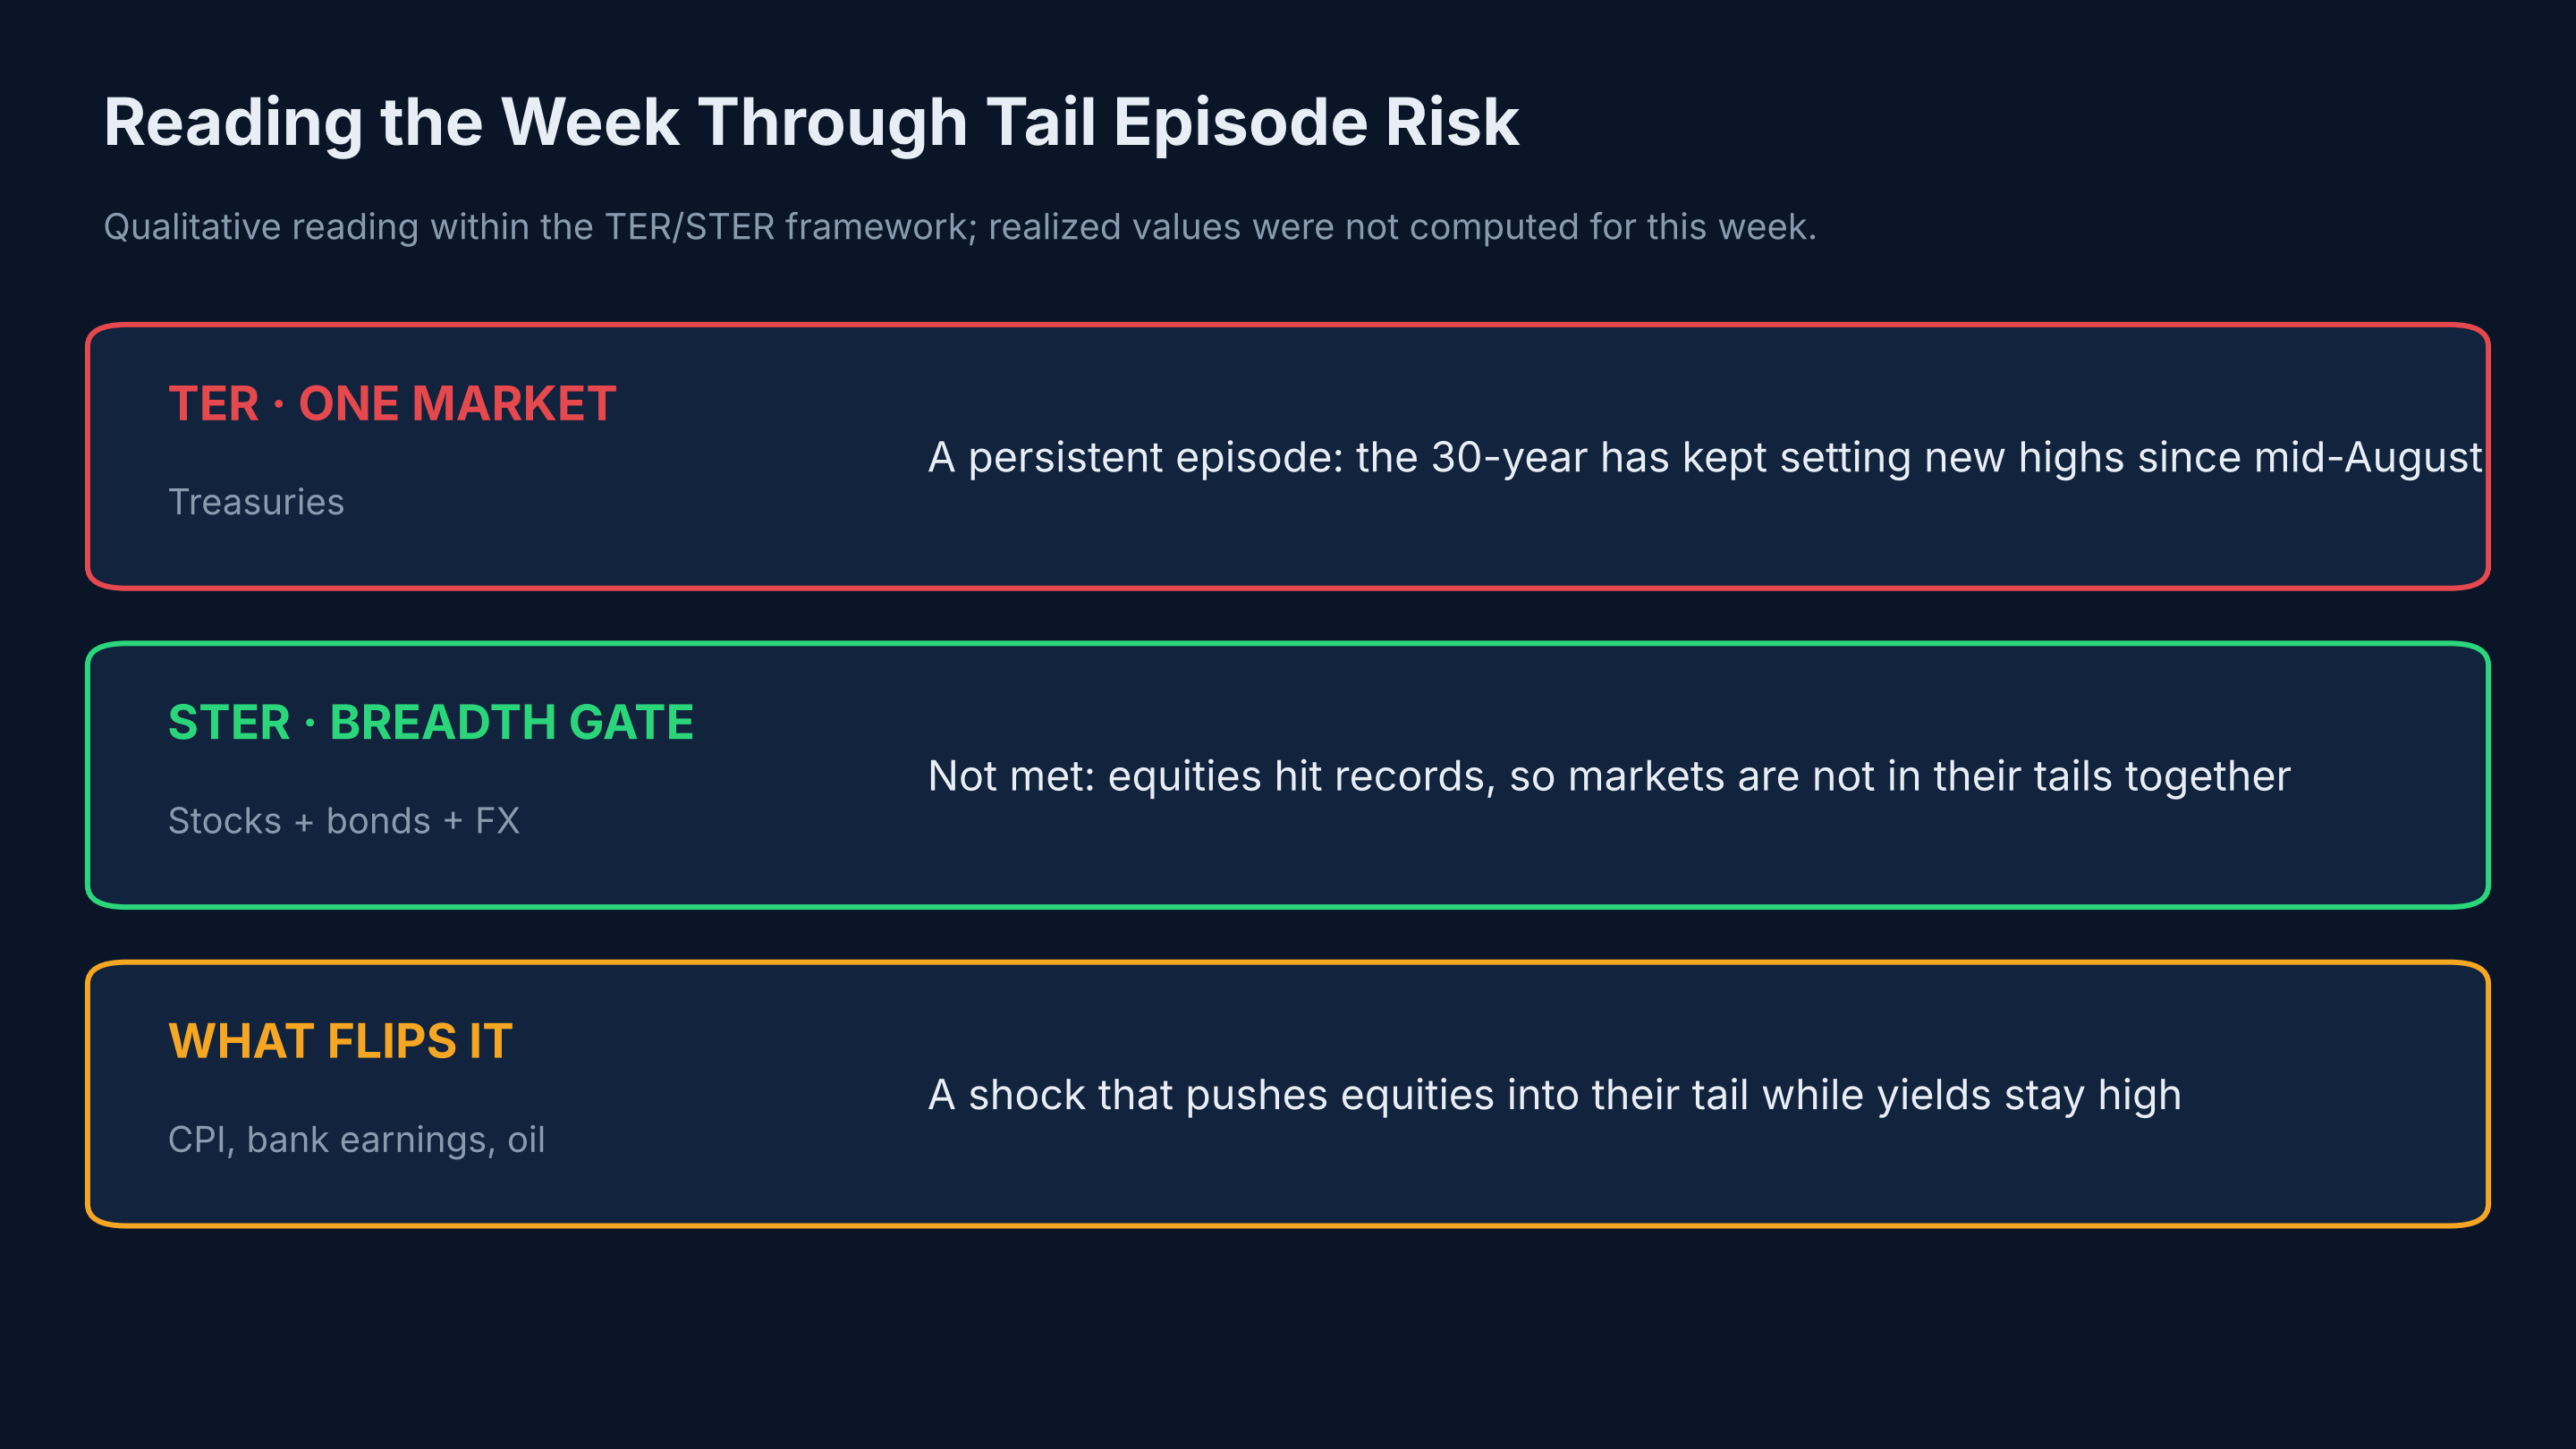
Read through that framework, this week looks like this (a qualitative reading; realized values were not computed for this week):
| Lens | This week | Interpretation |
|---|---|---|
| TER, one market | The 30-year has kept setting new highs since mid-August | A persistent single-market episode in Treasuries |
| STER, breadth gate Breadth gateSTER’s rule for what counts as systemic: a day qualifies only when enough markets are in their tails at the same time. | Equities at records; markets not in their tails together | Not met. This is not yet a systemic episode |
| What flips it | CPI, bank earnings, oil | A shock that pushes equities into their tail while yields stay high |
In last week's article, I argued the bond shock wasn't systemic because other markets didn't follow. This week sharpens that point: stocks didn't just avoid the selloff, they made records. That makes the gap between the two markets wider, and the eventual adjustment potentially larger.
In my five-market study from 2002 to 2026, the worst systemic episodes, including March 2020 (8.34%) and September 2008 (6.18%), all involved several markets breaking together, often including Treasuries. May 2022 (2.01%) is the closest precedent for today: stocks and bonds fell together as rates rose.
7. Why this matters beyond Wall Street#↑ Contents
| Who | Why this week matters |
|---|---|
| Households | The 30-year mortgage rate surged to a near three-year high as Treasury yields rose |
| Banks | Higher yields mean larger unrealized losses Unrealized lossesLosses on bonds a bank still holds. When yields rise, existing bond prices fall; the loss becomes real only if the bank has to sell, as Silicon Valley Bank did in 2023. on bond holdings, the pattern behind Silicon Valley Bank's 2023 failure; bank earnings begin next week |
| The U.S. Treasury | Each auction now moves markets; borrowing costs on the national debt keep rising |
| Retirement savers | The traditional 60/40 stock–bond portfolio 60/40 portfolioA classic allocation of 60% stocks and 40% bonds. It relies on bonds rising when stocks fall; when both fall together, the hedge fails. loses its hedge if both fall together |
8. What risk managers should watch next#↑ Contents
| # | Signal | Why it matters |
|---|---|---|
| 1 | September CPI CPIThe Consumer Price Index, the government’s headline measure of inflation in consumer prices. | A hot print could revive hike odds and push long yields higher |
| 2 | Bank earnings (Q3 season starts October 13) | The first read on how banks are absorbing 24-year-high yields |
| 3 | Treasury auction results | This week showed one strong auction can turn the market |
| 4 | Market breadth | Watch for records narrowing further, or lows spreading |
| 5 | The stock–bond correlation Stock–bond correlationWhether stocks and bonds move in the same direction. Normally bonds rally when stocks fall; a positive correlation means both can fall at once. | If stocks and bonds start falling together, the systemic risk rises sharply |
| 6 | Oil above $100 | The fastest path from geopolitics to inflation to yields |
Frequently Asked Questions#↑ Contents
Why are stocks at record highs while Treasury yields are at 24-year highs? The two markets are pricing different futures. The bond market is pricing persistent inflation and high-for-longer interest rates. The stock market is pricing strong, AI-driven earnings growth. On October 6, 2026 the S&P 500 closed at a record 7,818.93, and a day later the 10-year Treasury yield hit 5.365%, its highest since April 2002.
How high did Treasury yields go in October 2026? On Wednesday, October 7, 2026, the 10-year Treasury yield touched 5.365%, its highest since April 2002, and the 30-year reached 5.732%, its highest since May 2002. A solid $39 billion 10-year auction that cleared at 5.30% pulled yields back from those highs.
What does it mean when bonds out-yield stocks? It means a risk-free 10-year Treasury pays more than the stock market's earnings yield, which is earnings divided by price. With the 10-year at 5.365%, stocks at any multiple above about 18.6 times earnings yield less than the Treasury. Investors holding stocks are betting that earnings growth will close the gap.
Is the stock market rally broad? No. About 75% of S&P 500 stocks fell in September, and on October 1 the index had 4 new 52-week highs against 41 new lows, while the Nasdaq had 41 highs against 287 lows. The records are driven by a narrow group of technology and AI-linked stocks.
What is Systemic Tail Episode Risk (STER)? STER is a risk measure developed by Niraj Neupane that counts a stress episode as systemic only when several markets are in their tails at the same time, and measures how severe that synchronized episode becomes. Read through it, this week was a persistent stress episode in Treasuries but not yet a systemic one, because equities were at records rather than in their tails.
How could the standoff between stocks and bonds resolve? Four ways: bonds are right and stocks re-price lower; stocks are right and yields stabilize as inflation cools; both adjust, with modest returns; or a shock such as oil, war or a failed auction hits both markets at once. The last is the scenario risk managers should prepare for, even if it is not the most likely.
What should investors watch next? The September CPI report, bank earnings starting October 13, Treasury auction results, market breadth, the stock–bond correlation, and oil above $100 a barrel. A shock that pushes equities into their tail while yields stay high would turn a bond-market episode into a systemic one.
The bottom line#↑ Contents
This week, the stock market and the bond market told two different stories about the same economy. Stocks are betting that AI-driven earnings can outrun 24-year-high interest rates. Bonds are betting that inflation and rates stay high long enough to make that difficult.
Both cannot be right for long. If the adjustment is gradual, it will look like a slower, range-bound market. If it comes through a shock that hits both markets at once, it becomes the kind of synchronized, sustained episode that turns market stress into financial-system stress.
The question for the weeks ahead isn't whether yields are too high or stocks too expensive. It is whether the two markets reconcile gradually, or break together.
Read the research
Conditional Tail Episode Risk (SSRN): papers.ssrn.com/sol3/papers.cfm?abstract_id=7502499
Systemic Tail Episode Risk (working paper; code and data): github.com/nirajneupane17/systemic-tail-episode-risk
Last week in Financial Gurkha: The 30-Year Hit a 2002 High. Why Didn't Wall Street Panic?
About the author#
Niraj Neupane, CA (ICAI), is a quantitative researcher whose work develops new measures of path-dependent and systemic tail risk for financial institutions and regulators. He is the founder of Korvane, an AI-powered trade, risk and validation platform, and Calderyn Institute, which trains professionals in quantitative finance and AI engineering. His research papers are Conditional Tail Episode Risk (SSRN, 2026) and Systemic Tail Episode Risk (working paper, 2026). ORCID: 0009-0003-7026-7026.
Views expressed are the author's own and do not represent any employer.
Sources#
Market data, October 5–9, 2026
- Stocktwits, S&P 500 and Nasdaq 100 slip from record highs (Oct 7, 2026): https://stocktwits.com/news-articles/markets/equity/s-and-p-500-and-nasdaq-100-slip-from-record-highs-amid-pressure-from-soaring-treasury-yields-spcx-amd-nvda-mrvl-in-focus/cZDvp0iRBZ9
- Virginia Business, Wall Street ends lower, off record highs, as Treasury yields climb (Oct 7, 2026): https://virginiabusiness.com/wall-street-closes-lower-treasury-yields-inflation/
- Investrade, Morning Preview and Market Review (Oct 7, 2026): https://investrade.com/?p=1601 and https://investrade.com/?p=1603
- JournalArta, Stocks fall as 30-year Treasury yield hits 5.66% (Oct 8, 2026): https://journalarta.com/en/2026/10/08/stock-market-dow-sp-fall-treasury-yields/
- Digg, Nasdaq Composite fresh intraday peak (Oct 5, 2026): https://digg.com/world-business/r2fbx69g
- Virginia Business, Equities rebound as Treasury yields recede (Oct 1, 2026): https://virginiabusiness.com/us-stocks-rebound-treasury-yields-retreat/
- DailyForex, S&P 500 forecast for October 2026: https://es.dailyforex.com/stock-market-today/2026/10/sp-500-inicia-octubre-de-2026-en-maximos-historicos/250273
- GoodReturns, US stock market weekly outlook for October 5–9: https://www.goodreturns.in/news/us-stock-market-weekly-outlook-for-october-5-9-dow-jones-nasdaq-s-p-500-to-perform-bearish-bullish-1539099.html
- AP via La Nación, How major US stock indexes fared (Sep 25, Sep 28, Sep 29, Oct 2, 2026)
- Crypto Briefing and HDFC Sky, August 2026 Treasury yield highs
Research
- Neupane, N. (2026). Conditional Tail Episode Risk: A Path-Dependent Framework for Extreme-Loss Episodes Beyond Value-at-Risk and Expected Shortfall. SSRN 7502499.
- Neupane, N. (2026). Systemic Tail Episode Risk: Persistence and Cumulative Severity of Synchronized Extreme-Loss Episodes Across Markets. Working paper. https://github.com/nirajneupane17/systemic-tail-episode-risk