RESEARCH · SYSTEMIC RISK · U.S. FINANCIAL STABILITY
By Niraj Neupane, CA (ICAI) Quantitative Researcher, Korvane · Financial Economist, Calderyn Institute
Key takeaways
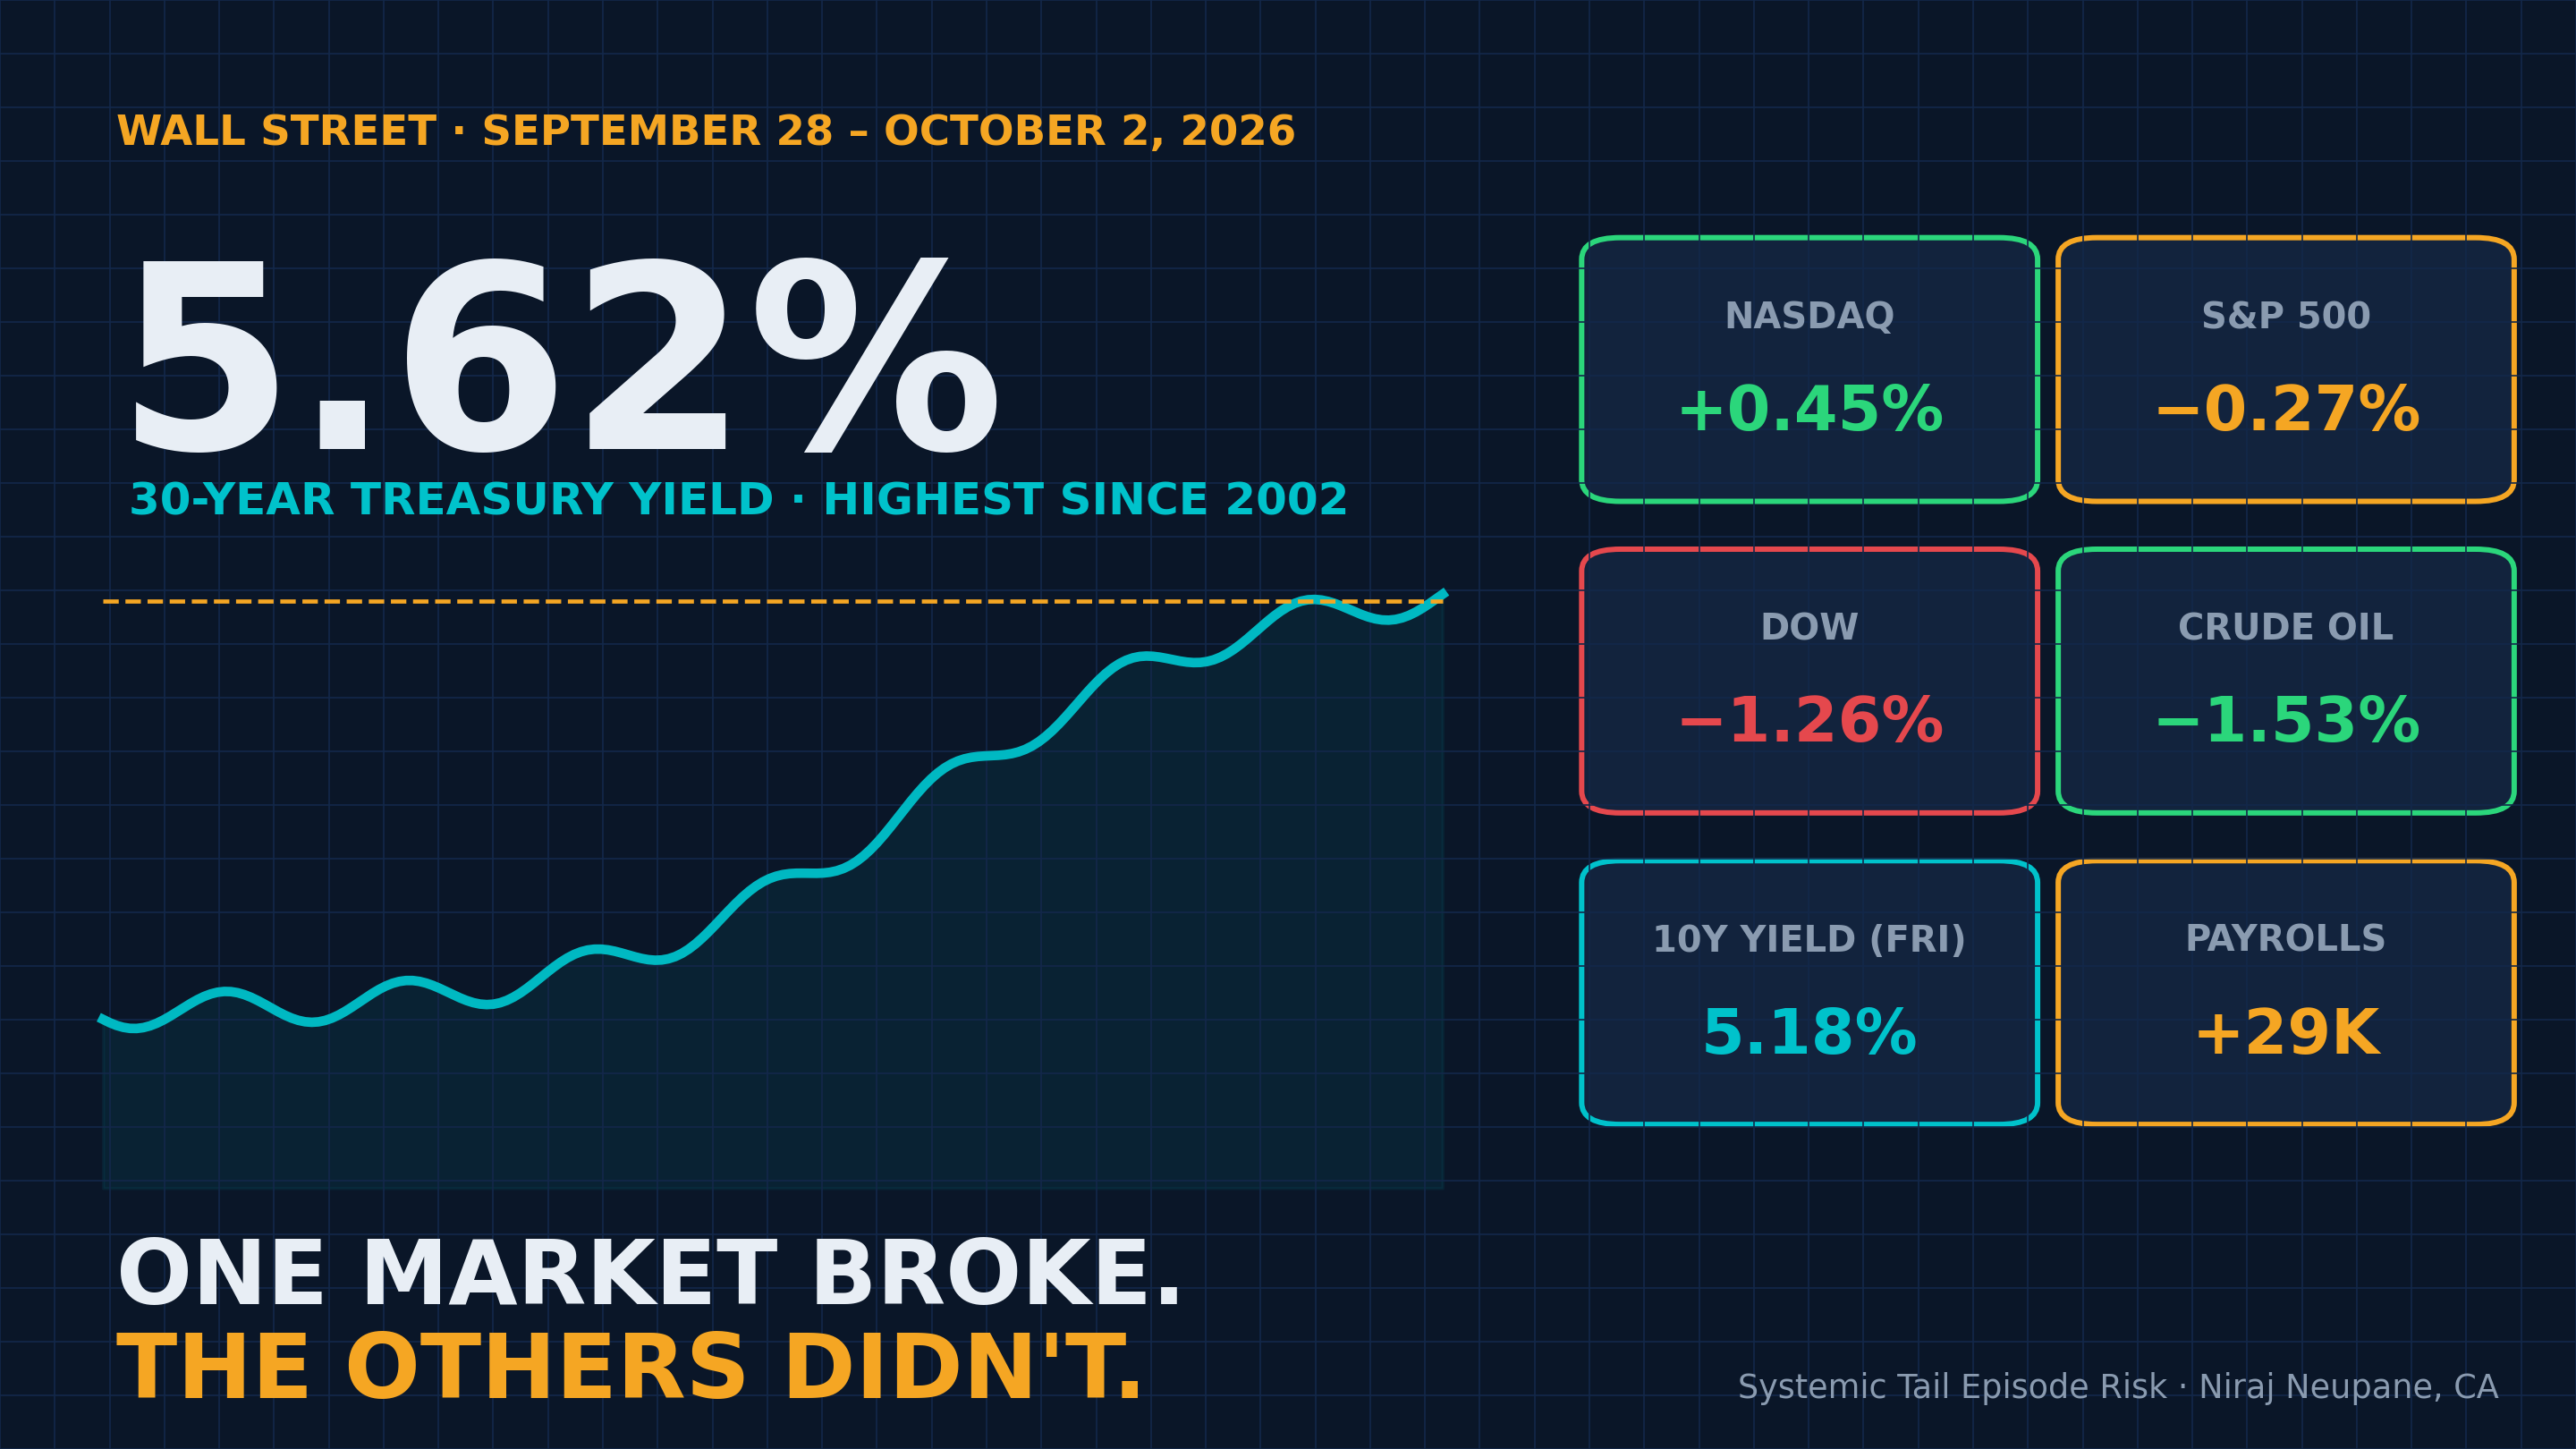
The news. The 30-year Treasury yield reached 5.62%, its highest since 2002, and the 10-year touched ~5.29%, a 2007 high. Yet the Nasdaq rose for the week, oil fell, and the S&P 500 lost only 0.3%.
The insight. Financial crises are not defined by one market breaking. They happen when several markets break together and stay broken.
The gap. The standard systemic-risk measures used by regulators and banks (CoVaR, MES, SRISK) describe stress at a single point in time. They cannot tell a sustained, synchronized collapse from the same shocks spread out over weeks.
The research. My new working paper introduces Systemic Tail Episode Risk (STER), which measures how severe the worst synchronized, sustained stress episode across markets can become. When markets become more likely to crash together, STER rises ~45% while portfolio VaR stays flat. Across 24 years of data, its largest episodes are March 2020, September 2008 and April 2025.
What's in this report#
- 1. The week: a historic bond shock that stayed contained
- 2. What makes stress systemic
- 3. The blind spot in today's systemic-risk measures
- 4. The research: Systemic Tail Episode Risk
- 5. What the research found
- 6. From bond shock to systemic episode: three pathways
- 7. Why this matters for U.S. financial stability
- 8. What risk managers can do now
- The bottom line
1. The week: a historic bond shock that stayed contained#↑ Contents
On Tuesday, September 29, the 30-year Treasury yield crossed 5.6%, a level last seen in June 2002, and the 10-year reached a fresh 2007 high near 5.3%. On Wednesday, Treasury yields closed the third quarter with their biggest quarterly increase in decades.
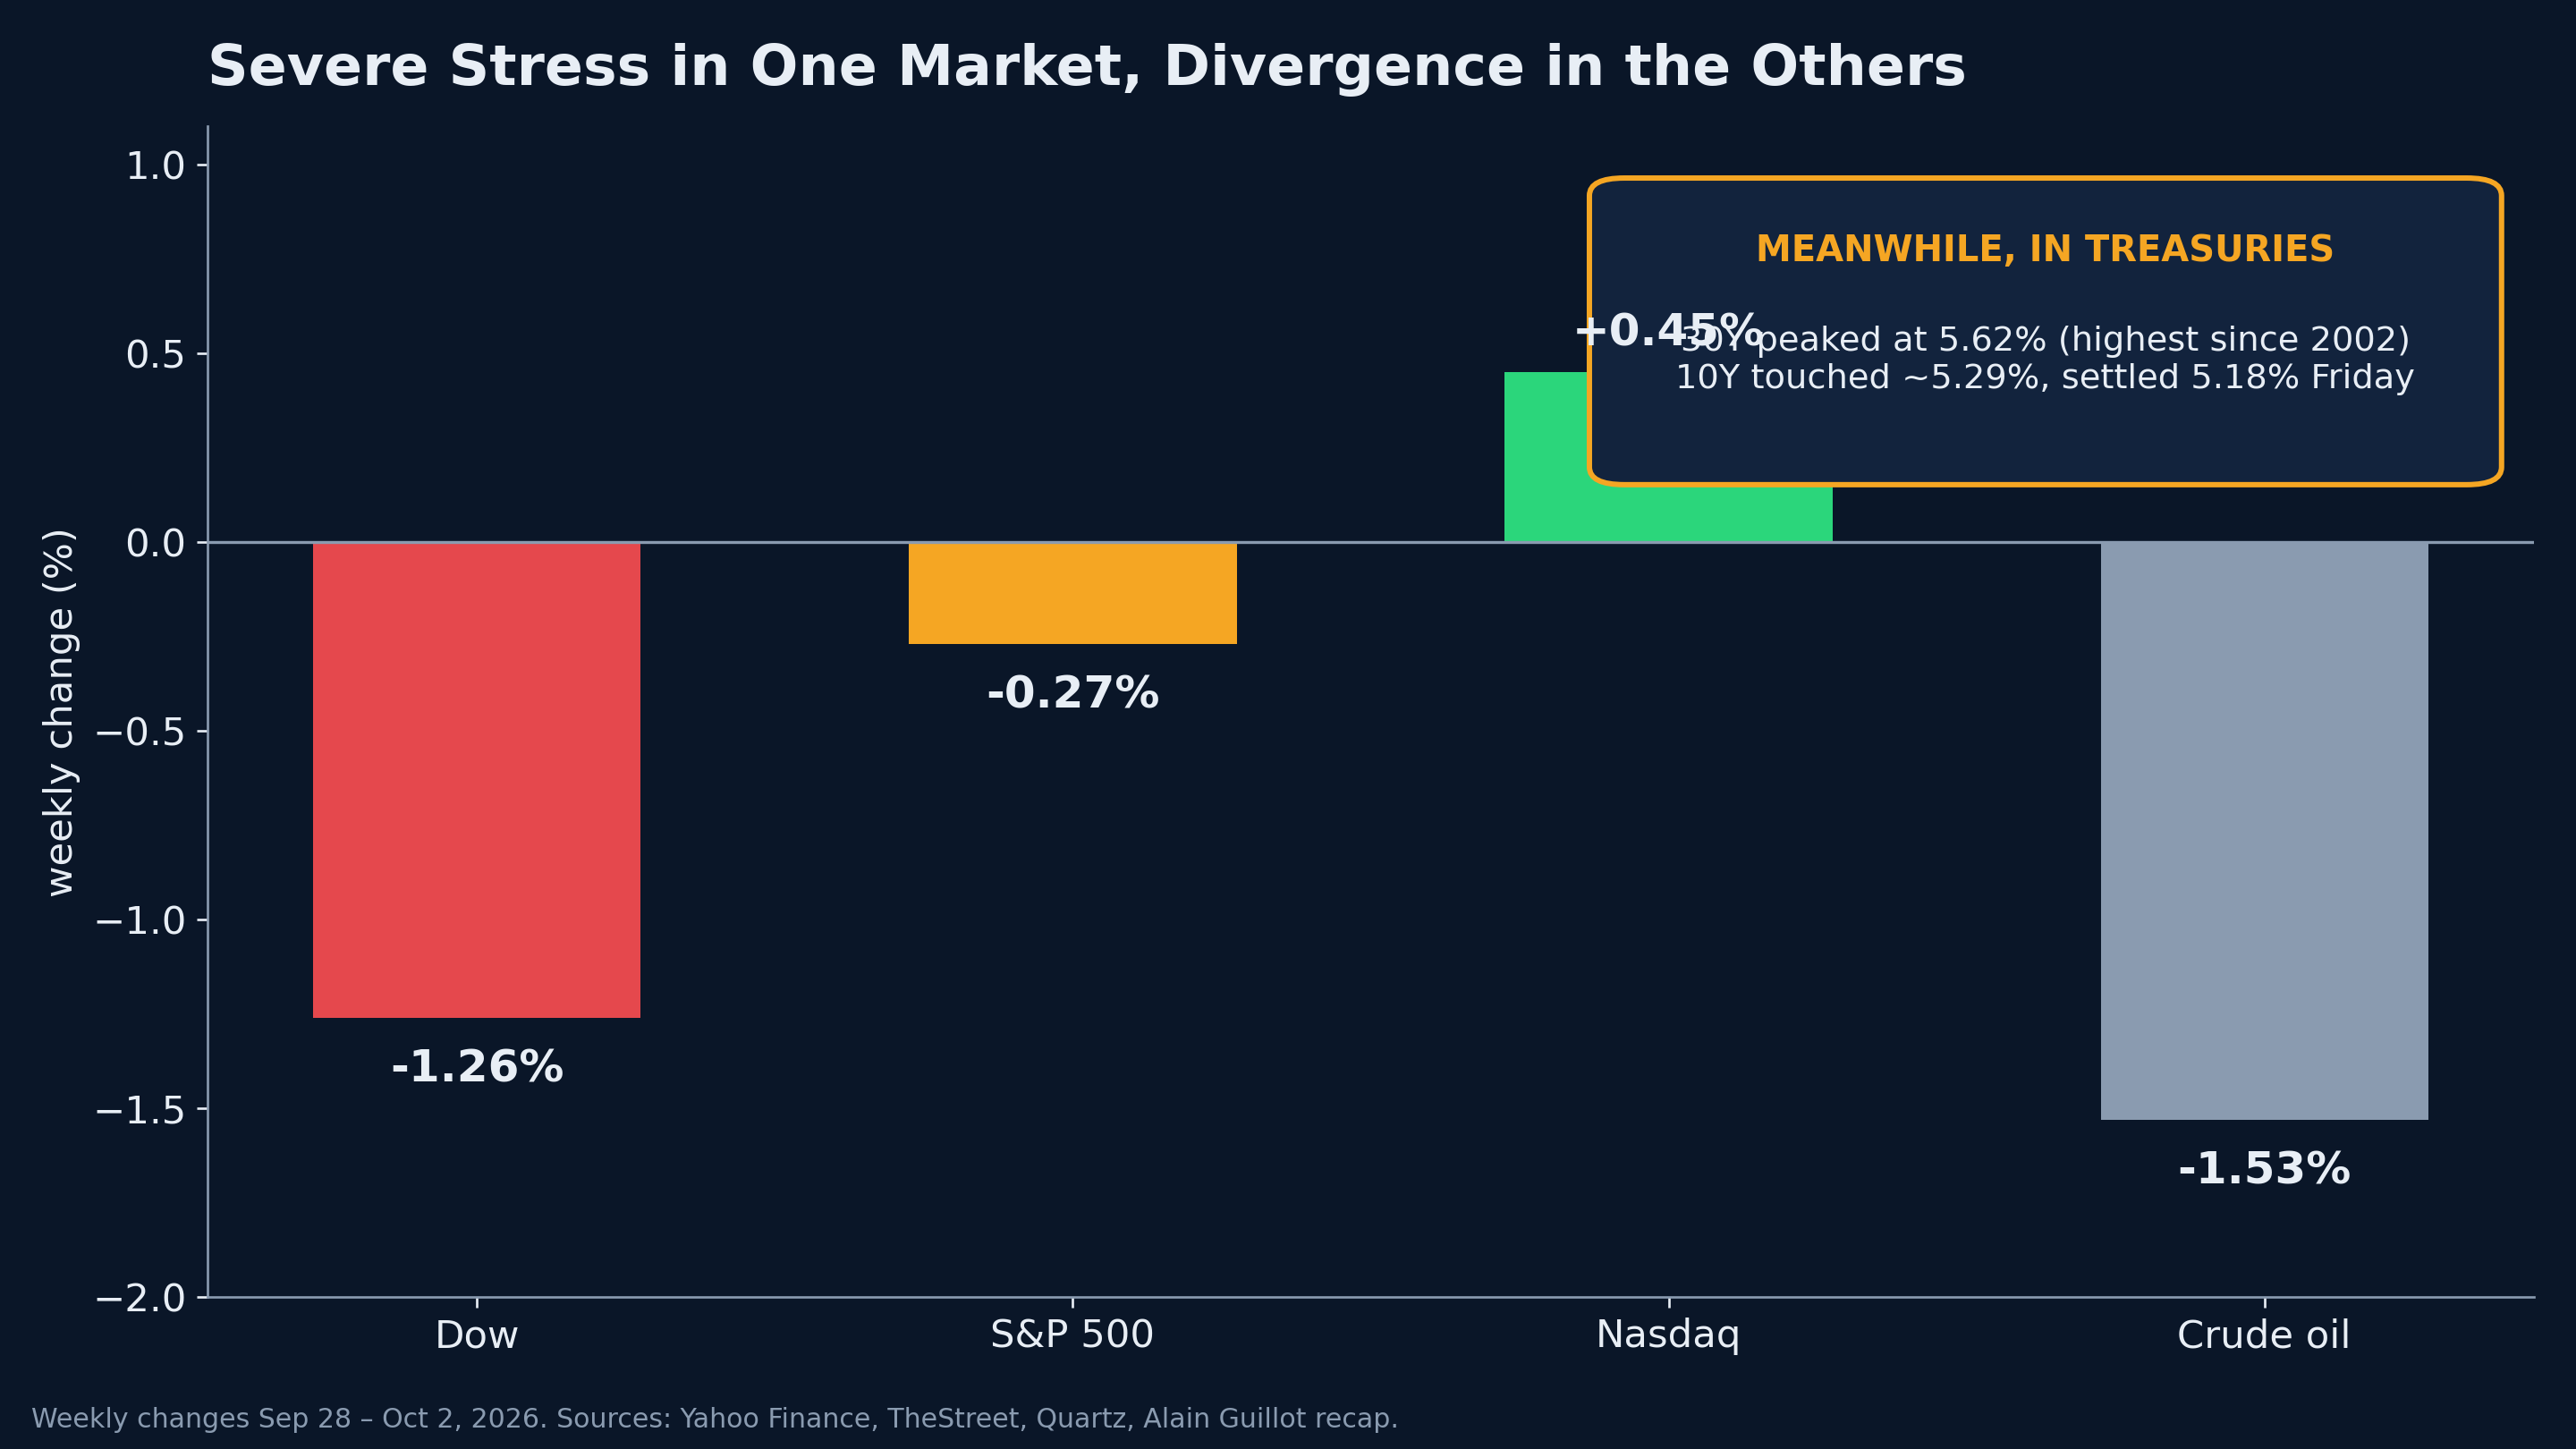
By most measures, that is a severe shock to the world's most important bond market. Yet the week did not become a crisis.
| Market | Sep 28 – Oct 2, 2026 | Signal |
|---|---|---|
| 30-year Treasury | Peaked at 5.62% | Highest since 2002 |
| 10-year Treasury | Touched ~5.29%, settled 5.18% Friday | 2007 high, then partial relief |
| Nasdaq | +0.45% for the week | Moved the other way |
| S&P 500 | −0.27% for the week | Contained |
| Dow | −1.26% for the week | Moderate |
| Crude oil futures | −1.53% for the week | Eased after the G-7 emergency release of 100M barrels |
| Payrolls | +29K vs ~84K expected; unemployment 4.2% | Weak, but not panic |
| Core PCE | 3.0%, below expectations | Relief on inflation |
Two details behind the headlines matter for financial stability:
- Hedge funds now hold a record share of the $30 trillion Treasury market. Leveraged holders are the channel through which a bond selloff can force selling in other markets.
- The Fed is pausing, not easing. After Friday's jobs report, October hike odds fell sharply, but markets still price more than a 75% chance of a December hike. Rates are expected to stay high for longer.
The bond market broke, and the other markets didn't follow. That difference separates a painful week from a systemic crisis, and today's standard systemic-risk measures are not built to capture it.
2. What makes stress systemic#↑ Contents
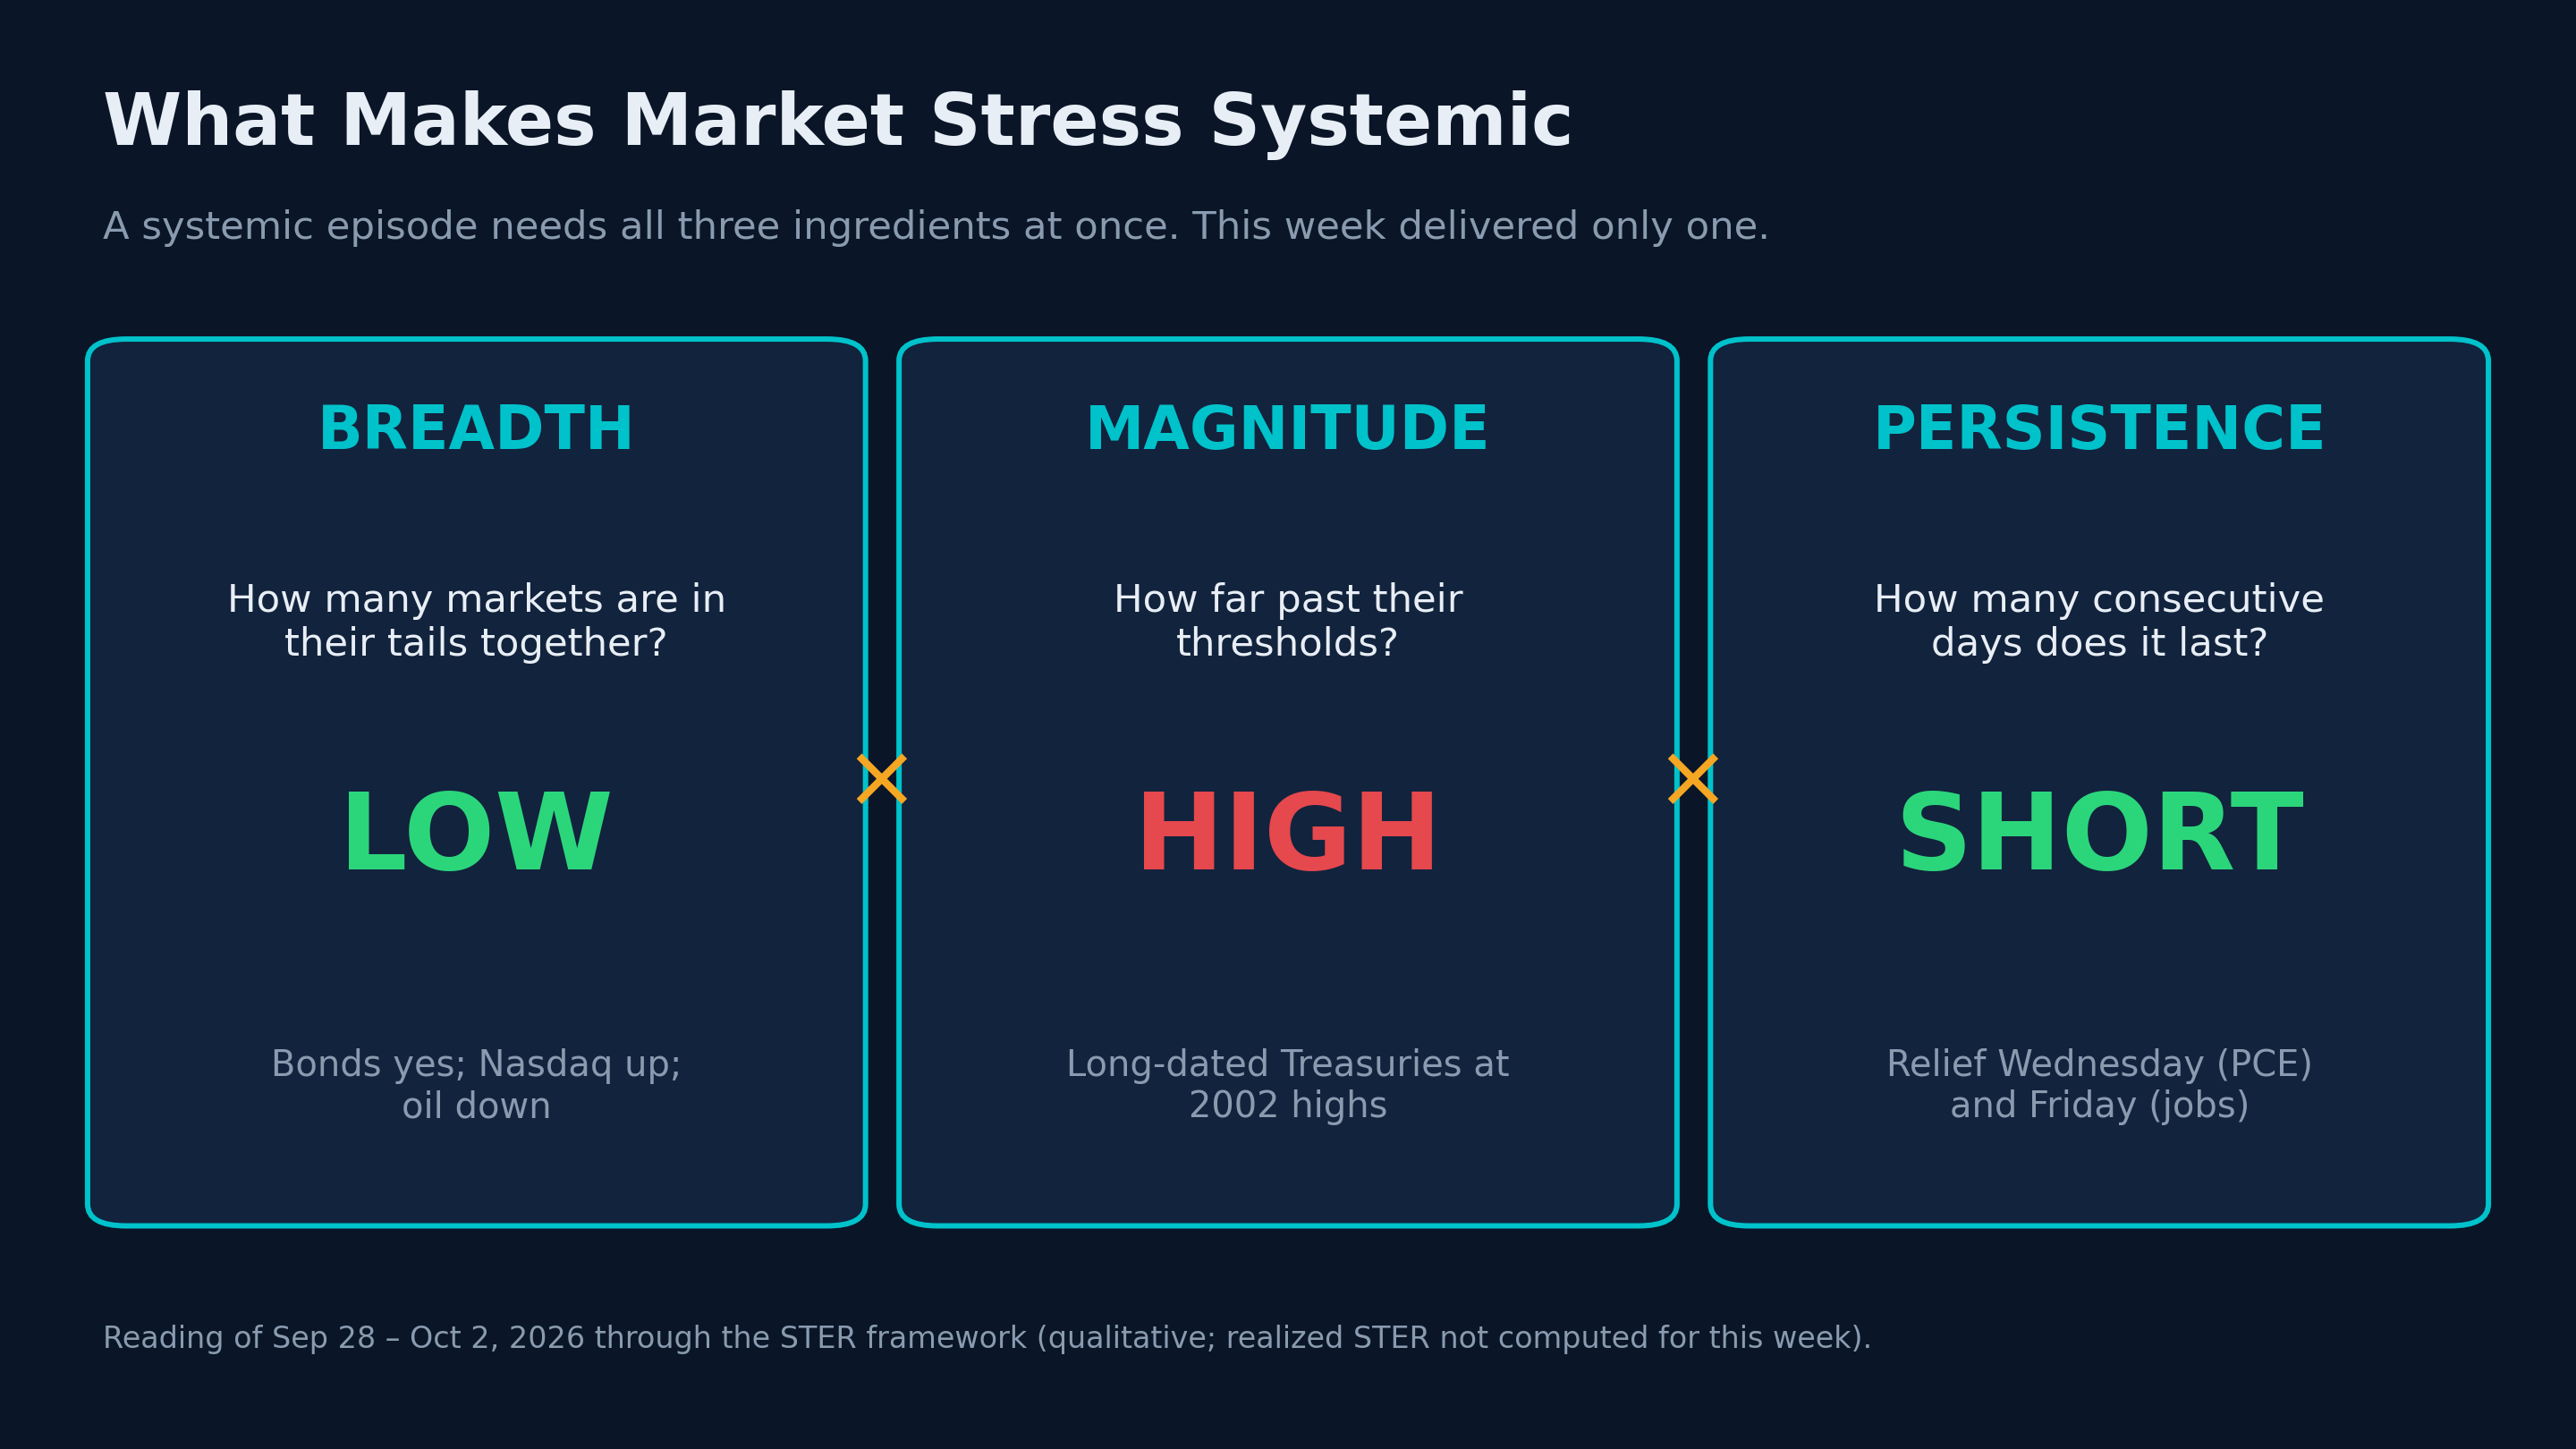
The worst crises of the past 25 years share one shape: many markets enter their tails together and stay there for days. That shape has three ingredients, and a systemic episode needs all three at once:
| Ingredient | The question | This week |
|---|---|---|
| Breadth | How many markets are in their tails at the same time? | Low. Bonds yes; Nasdaq up; oil down |
| Magnitude | How far past their tail thresholds? | High for long-dated Treasuries |
| Persistence | How many consecutive days does joint stress last? | Short. Relief Wednesday (PCE) and Friday (jobs) |
This week delivered magnitude in one market, but neither breadth nor persistence across markets.
3. The blind spot in today's systemic-risk measures#↑ Contents
The main systemic-risk tools used by central banks, supervisors and large institutions each describe a single moment in time:
| Measure | Developed by | What it answers |
|---|---|---|
| CoVaR / ΔCoVaR | Adrian & Brunnermeier (2016) | How bad is the system's tail when one institution is in distress? |
| Marginal Expected Shortfall | Acharya et al. (2017) | How much does an institution lose when the system is in its tail? |
| SRISK | Brownlees & Engle (2017) | How much capital would an institution be short in a crisis? |
| Co-exceedance counts | Bae, Karolyi & Stulz (2003) | How many markets breach their tails on the same day? |
All four answer the question "how bad is joint stress today?" None answers "how long will it last, and how much damage will it accumulate?"
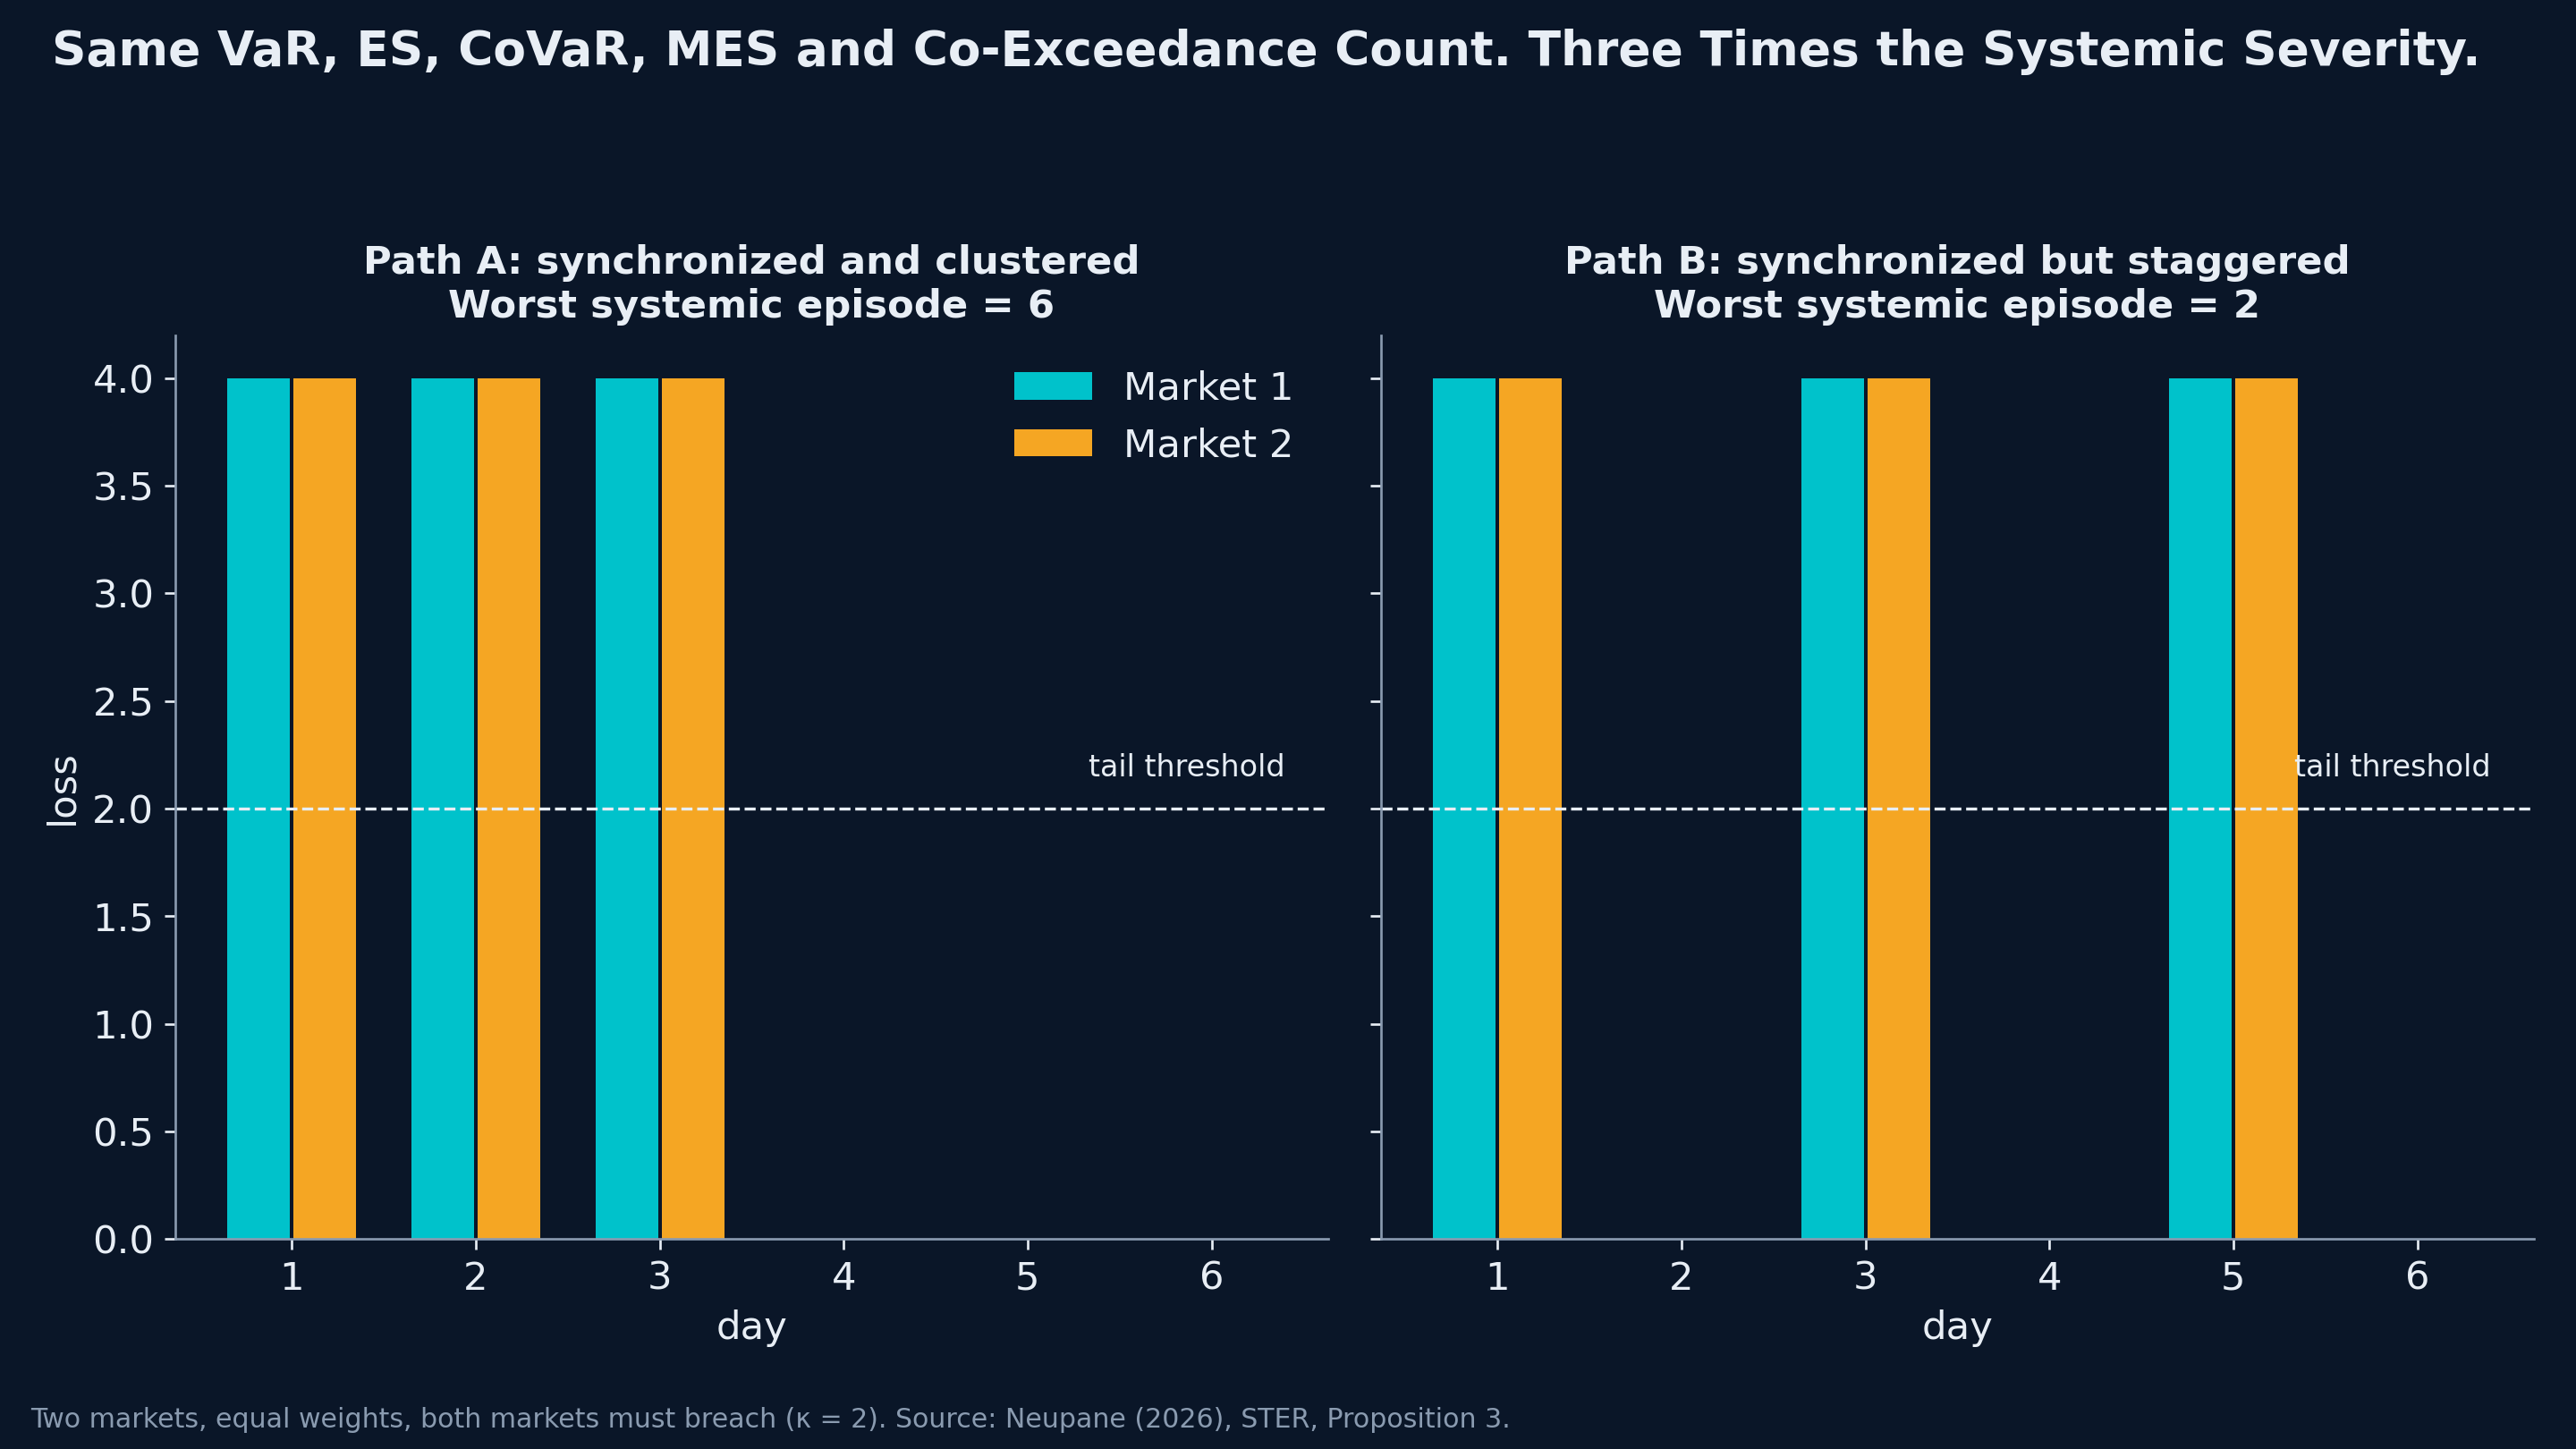
A simple example from my paper shows why this matters. Take two markets and the same six days of losses, arranged two different ways:
| Path A: clustered | Path B: staggered | |
|---|---|---|
| Individual market loss distributions | Identical | Identical |
| Portfolio VaR and Expected Shortfall | Identical | Identical |
| CoVaR and MES (point-in-time) | Identical | Identical |
| Days on which both markets breach | 3 | 3 |
| Worst systemic episode severity (STER) | 6 | 2 |
Path A is three consecutive days of synchronized collapse. Path B gives both markets a day to recover after each shock. Every point-in-time measure rates them as equally risky. In practice, the institution facing Path A is meeting its third straight day of margin calls before it has had a chance to raise liquidity.
Advertisement
4. The research: Systemic Tail Episode Risk#↑ Contents
My new working paper, Systemic Tail Episode Risk: Persistence and Cumulative Severity of Synchronized Extreme-Loss Episodes Across Markets (September 2026), extends my earlier single-market framework, Conditional Tail Episode Risk (SSRN, 2026), to the cross-market setting regulators care about most.
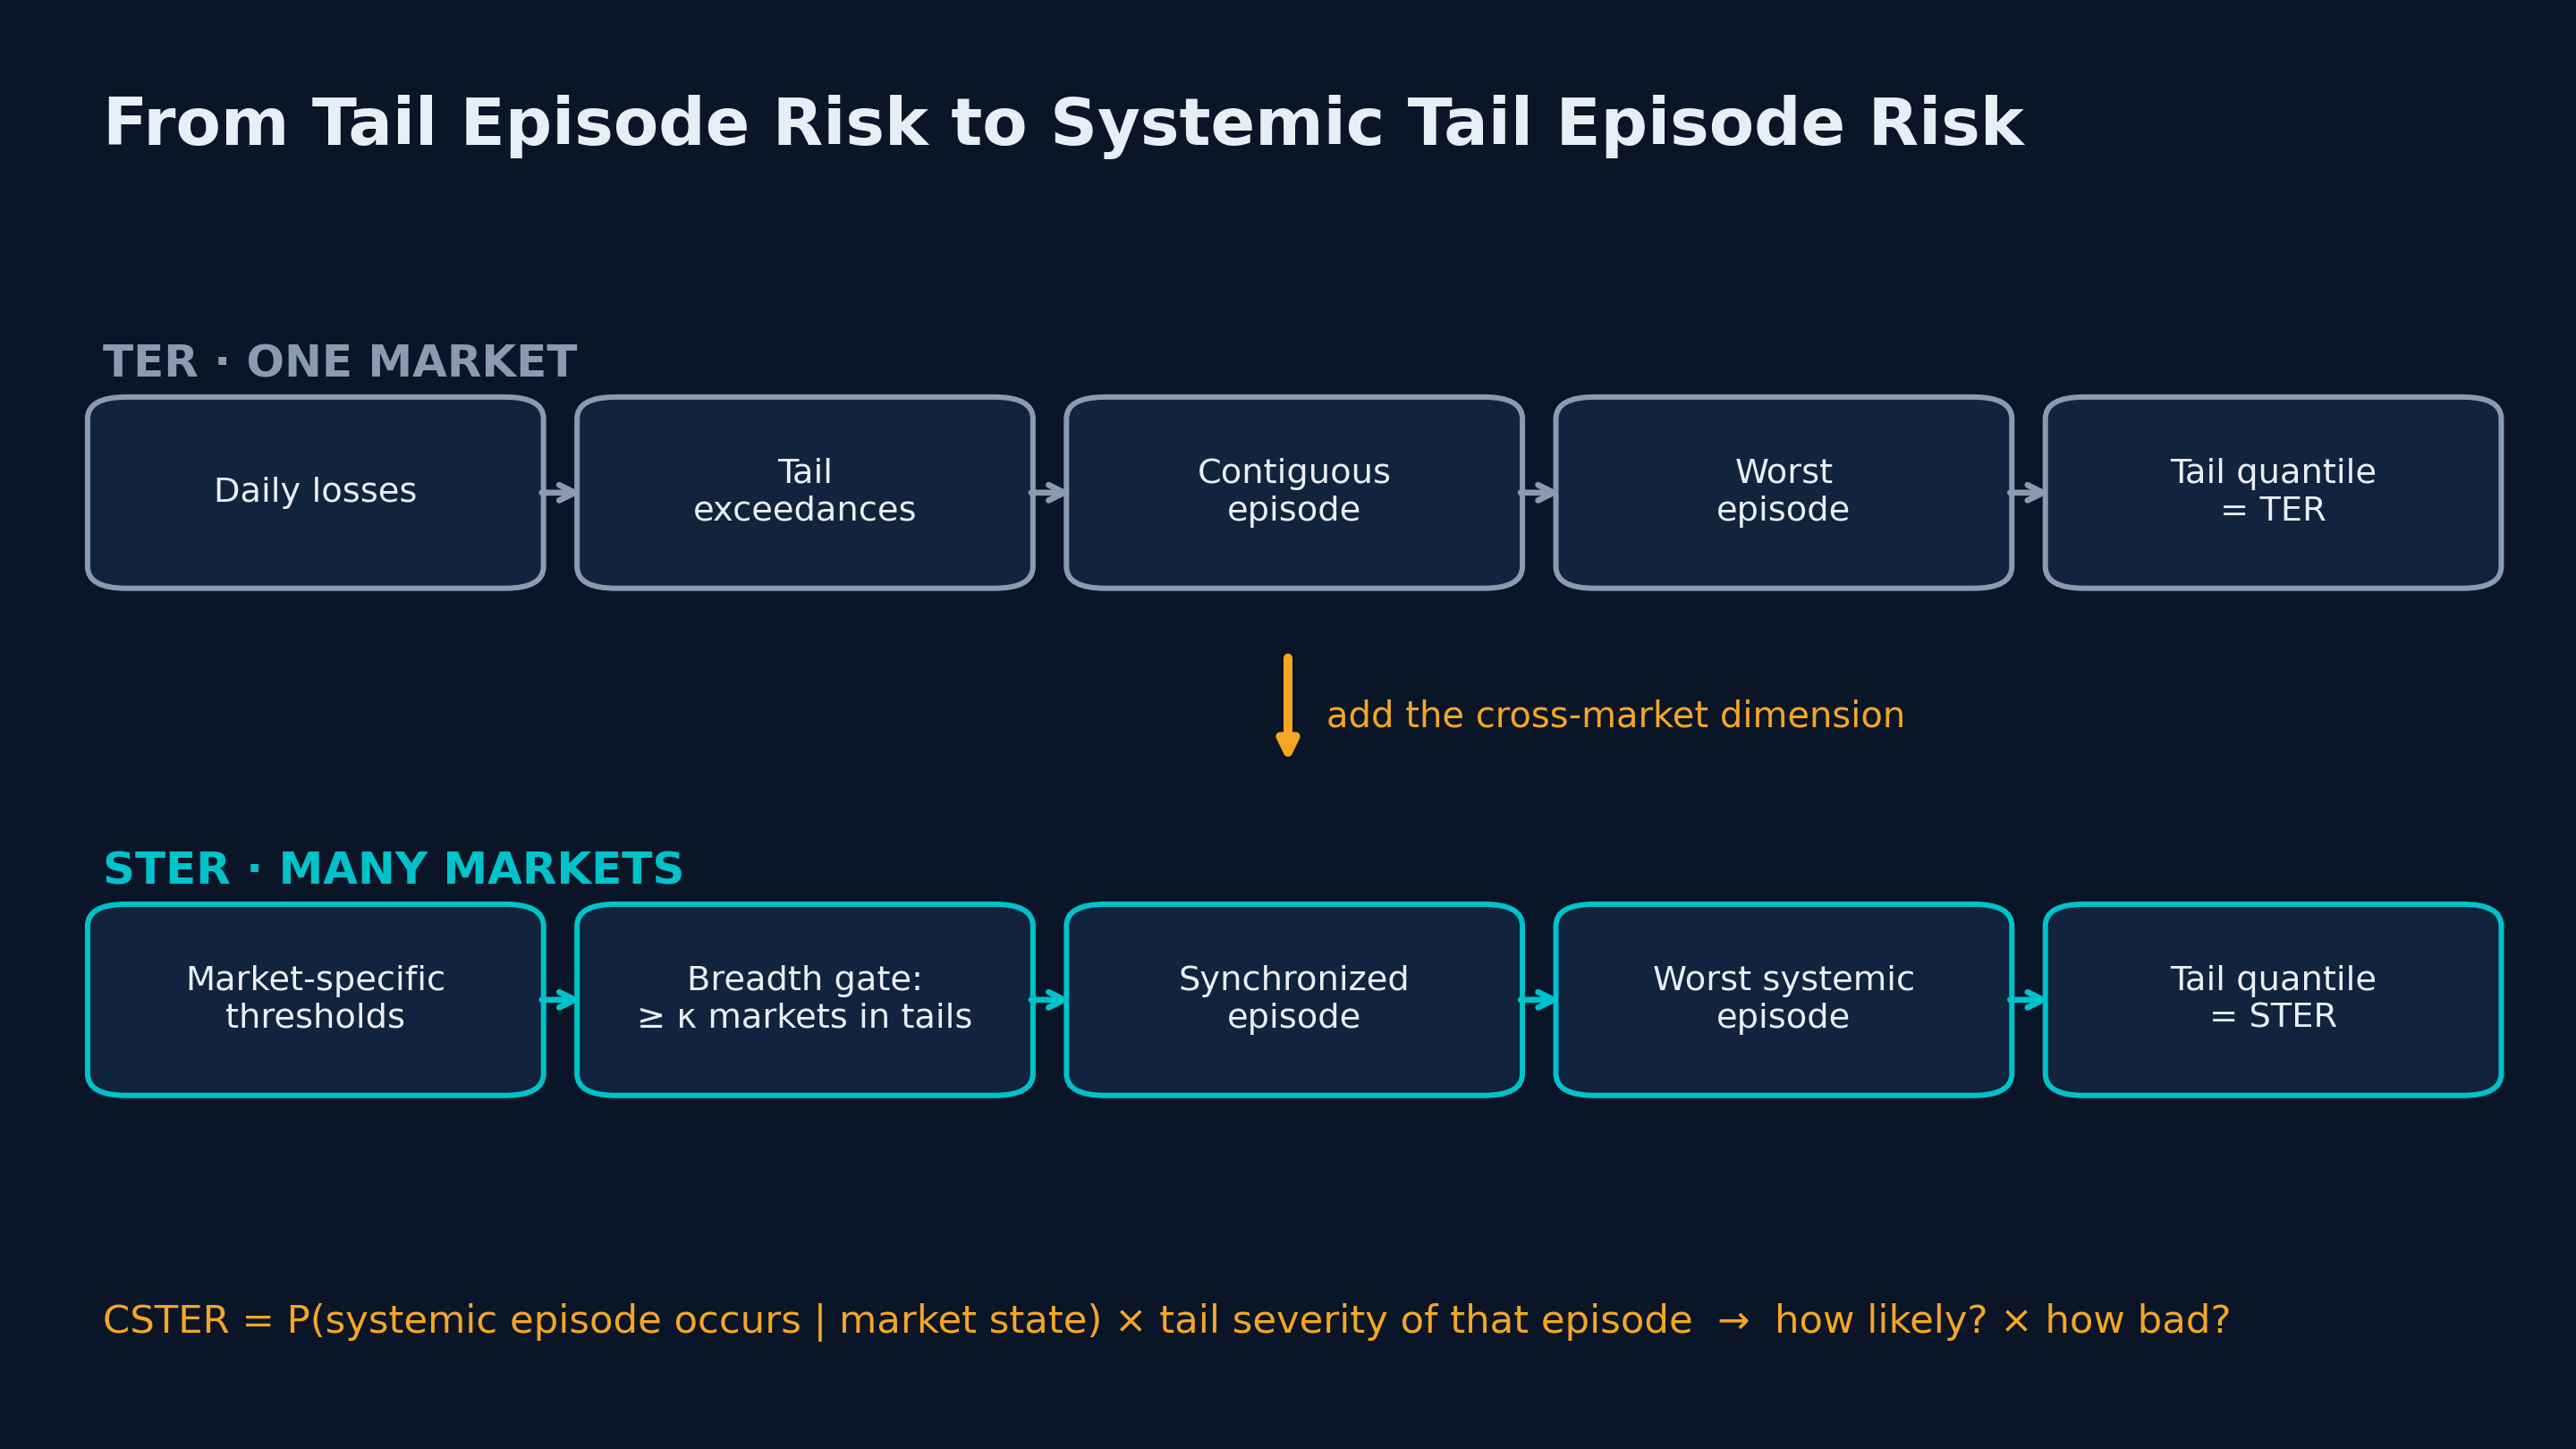
How STER works, in plain language:
- Each market gets its own tail threshold, based on its own recent history, so Treasuries, equities and currencies are each judged against their own normal behavior.
- Each day, STER counts breadth: how many markets are in their tails at the same time.
- A breadth gate defines "systemic." A day counts as systemic only when enough markets are in their tails together.
- Consecutive systemic days form an episode. The episode's severity is the total excess loss across markets over the whole run.
- STER is the tail of the worst such episode over the forecast horizon, measuring how bad a synchronized, sustained crisis can get.
Its conditional version, CSTER, splits systemic risk into the two questions a risk committee or regulator actually asks: how likely are markets to enter a joint stress episode given current conditions, and how severe would it be?
Where STER fits:
| Measure | Cross-market | Time dimension | What it measures |
|---|---|---|---|
| CoVaR, MES | Yes | No | Joint tail stress at a point in time |
| SRISK | Yes | State-based | Capital shortfall in a crisis |
| Spillover Persistence (Kubitza, 2025) | Yes | Yes | How long shocks take to transmit |
| TER (my earlier work) | No | Yes | Worst single-market tail episode |
| STER (this paper) | Yes | Yes | How severe the worst synchronized episode becomes |
What the paper does and doesn't claim. Mathematically, STER builds on established extreme-value theory: it is a multivariate cluster functional (Basrak & Segers, 2009). Systemic risk also already has a time dimension through spillover persistence (Kubitza, 2025). The paper's contribution is narrower and practical: a financial, breadth-gated measure of how severe the worst synchronized episode becomes, which can be forecast and backtested.
5. What the research found#↑ Contents
Finding 1: Markets crashing together raises systemic risk that portfolio VaR can't see#
I simulated six markets with identical individual risk and identical correlation, changing only how likely they were to crash together (tail dependence).
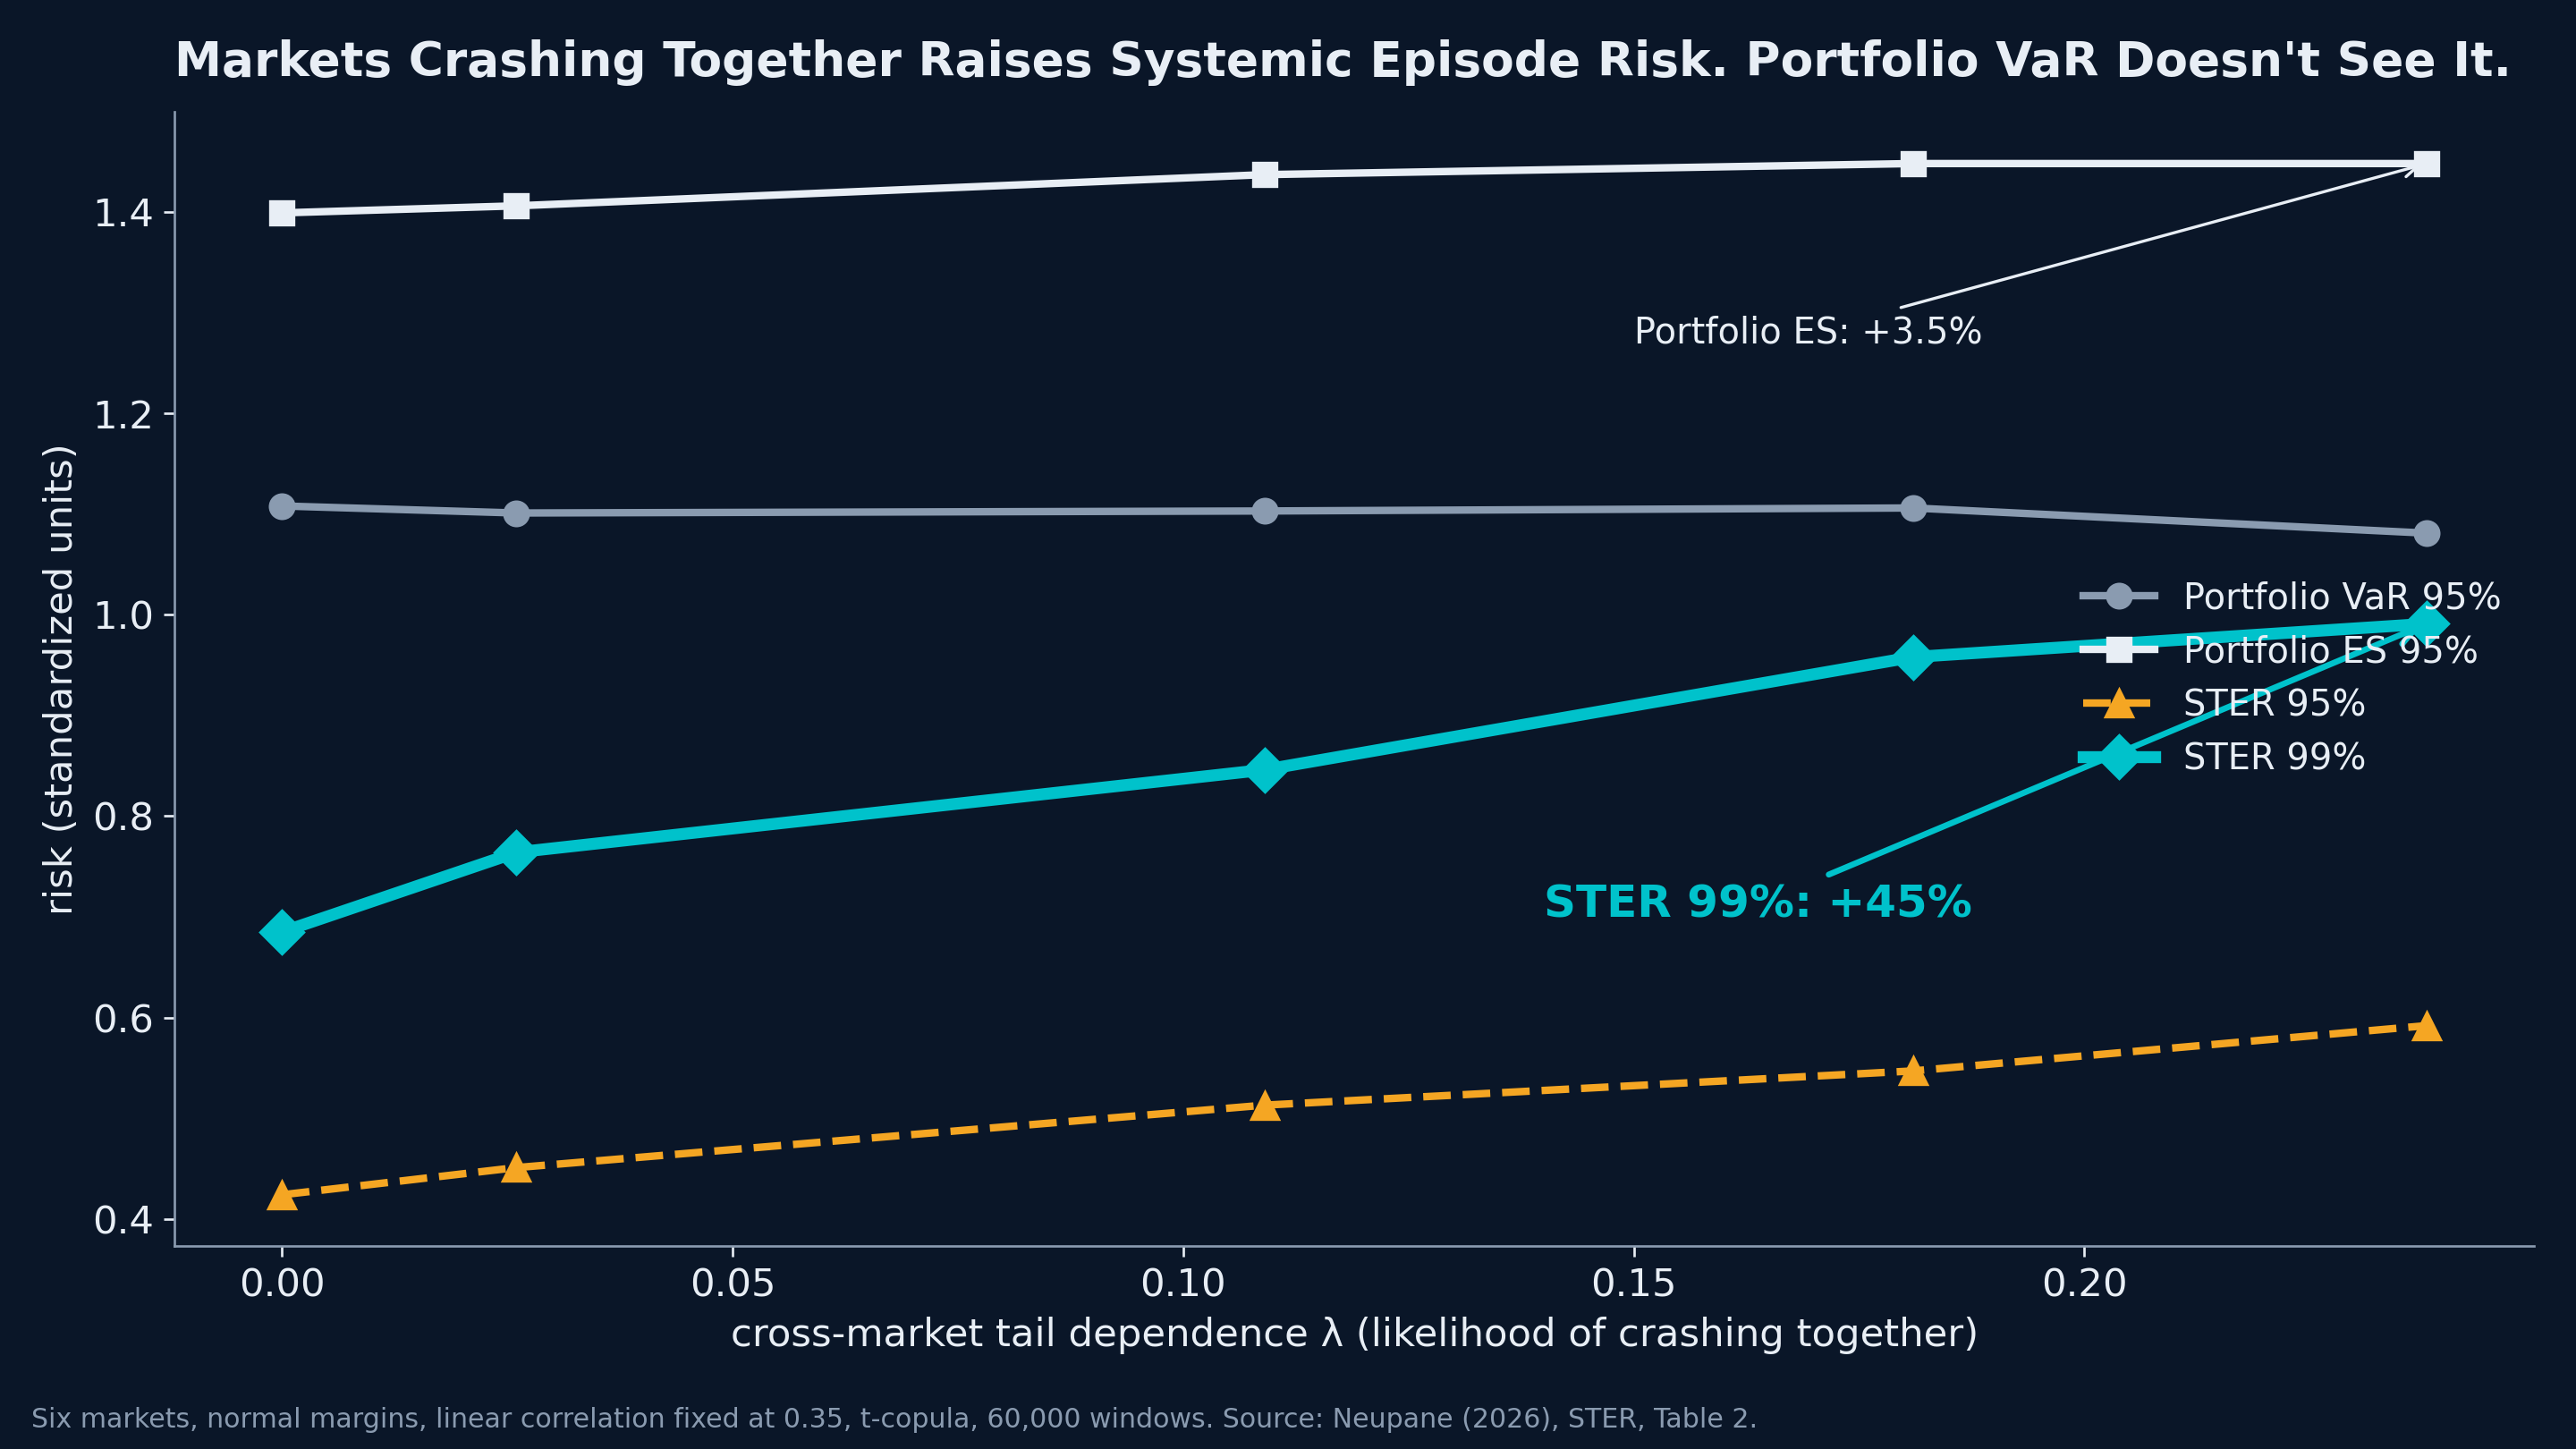
| Tail dependence | Portfolio VaR 95% | Portfolio ES 95% | STER 99% |
|---|---|---|---|
| None (0.000) | 1.108 | 1.399 | 0.685 |
| Low (0.026) | 1.101 | 1.406 | 0.764 |
| Moderate (0.109) | 1.103 | 1.437 | 0.846 |
| High (0.181) | 1.106 | 1.448 | 0.958 |
| Strong (0.238) | 1.081 | 1.448 | 0.991 |
| Change | ≈ 0% | +3.5% | +45% |
Why it matters: correlation is measured in normal markets, while tail dependence shows up in crises. A portfolio, or a financial system, can look diversified on every standard report while its risk of a synchronized collapse is rising.
Finding 2: The largest episodes are the crises we remember#
I computed realized STER across five core markets (S&P 500, Nasdaq, long-duration U.S. Treasuries, EUR/USD and USD/JPY) from July 2002 to 2026, roughly 6,000 trading days.
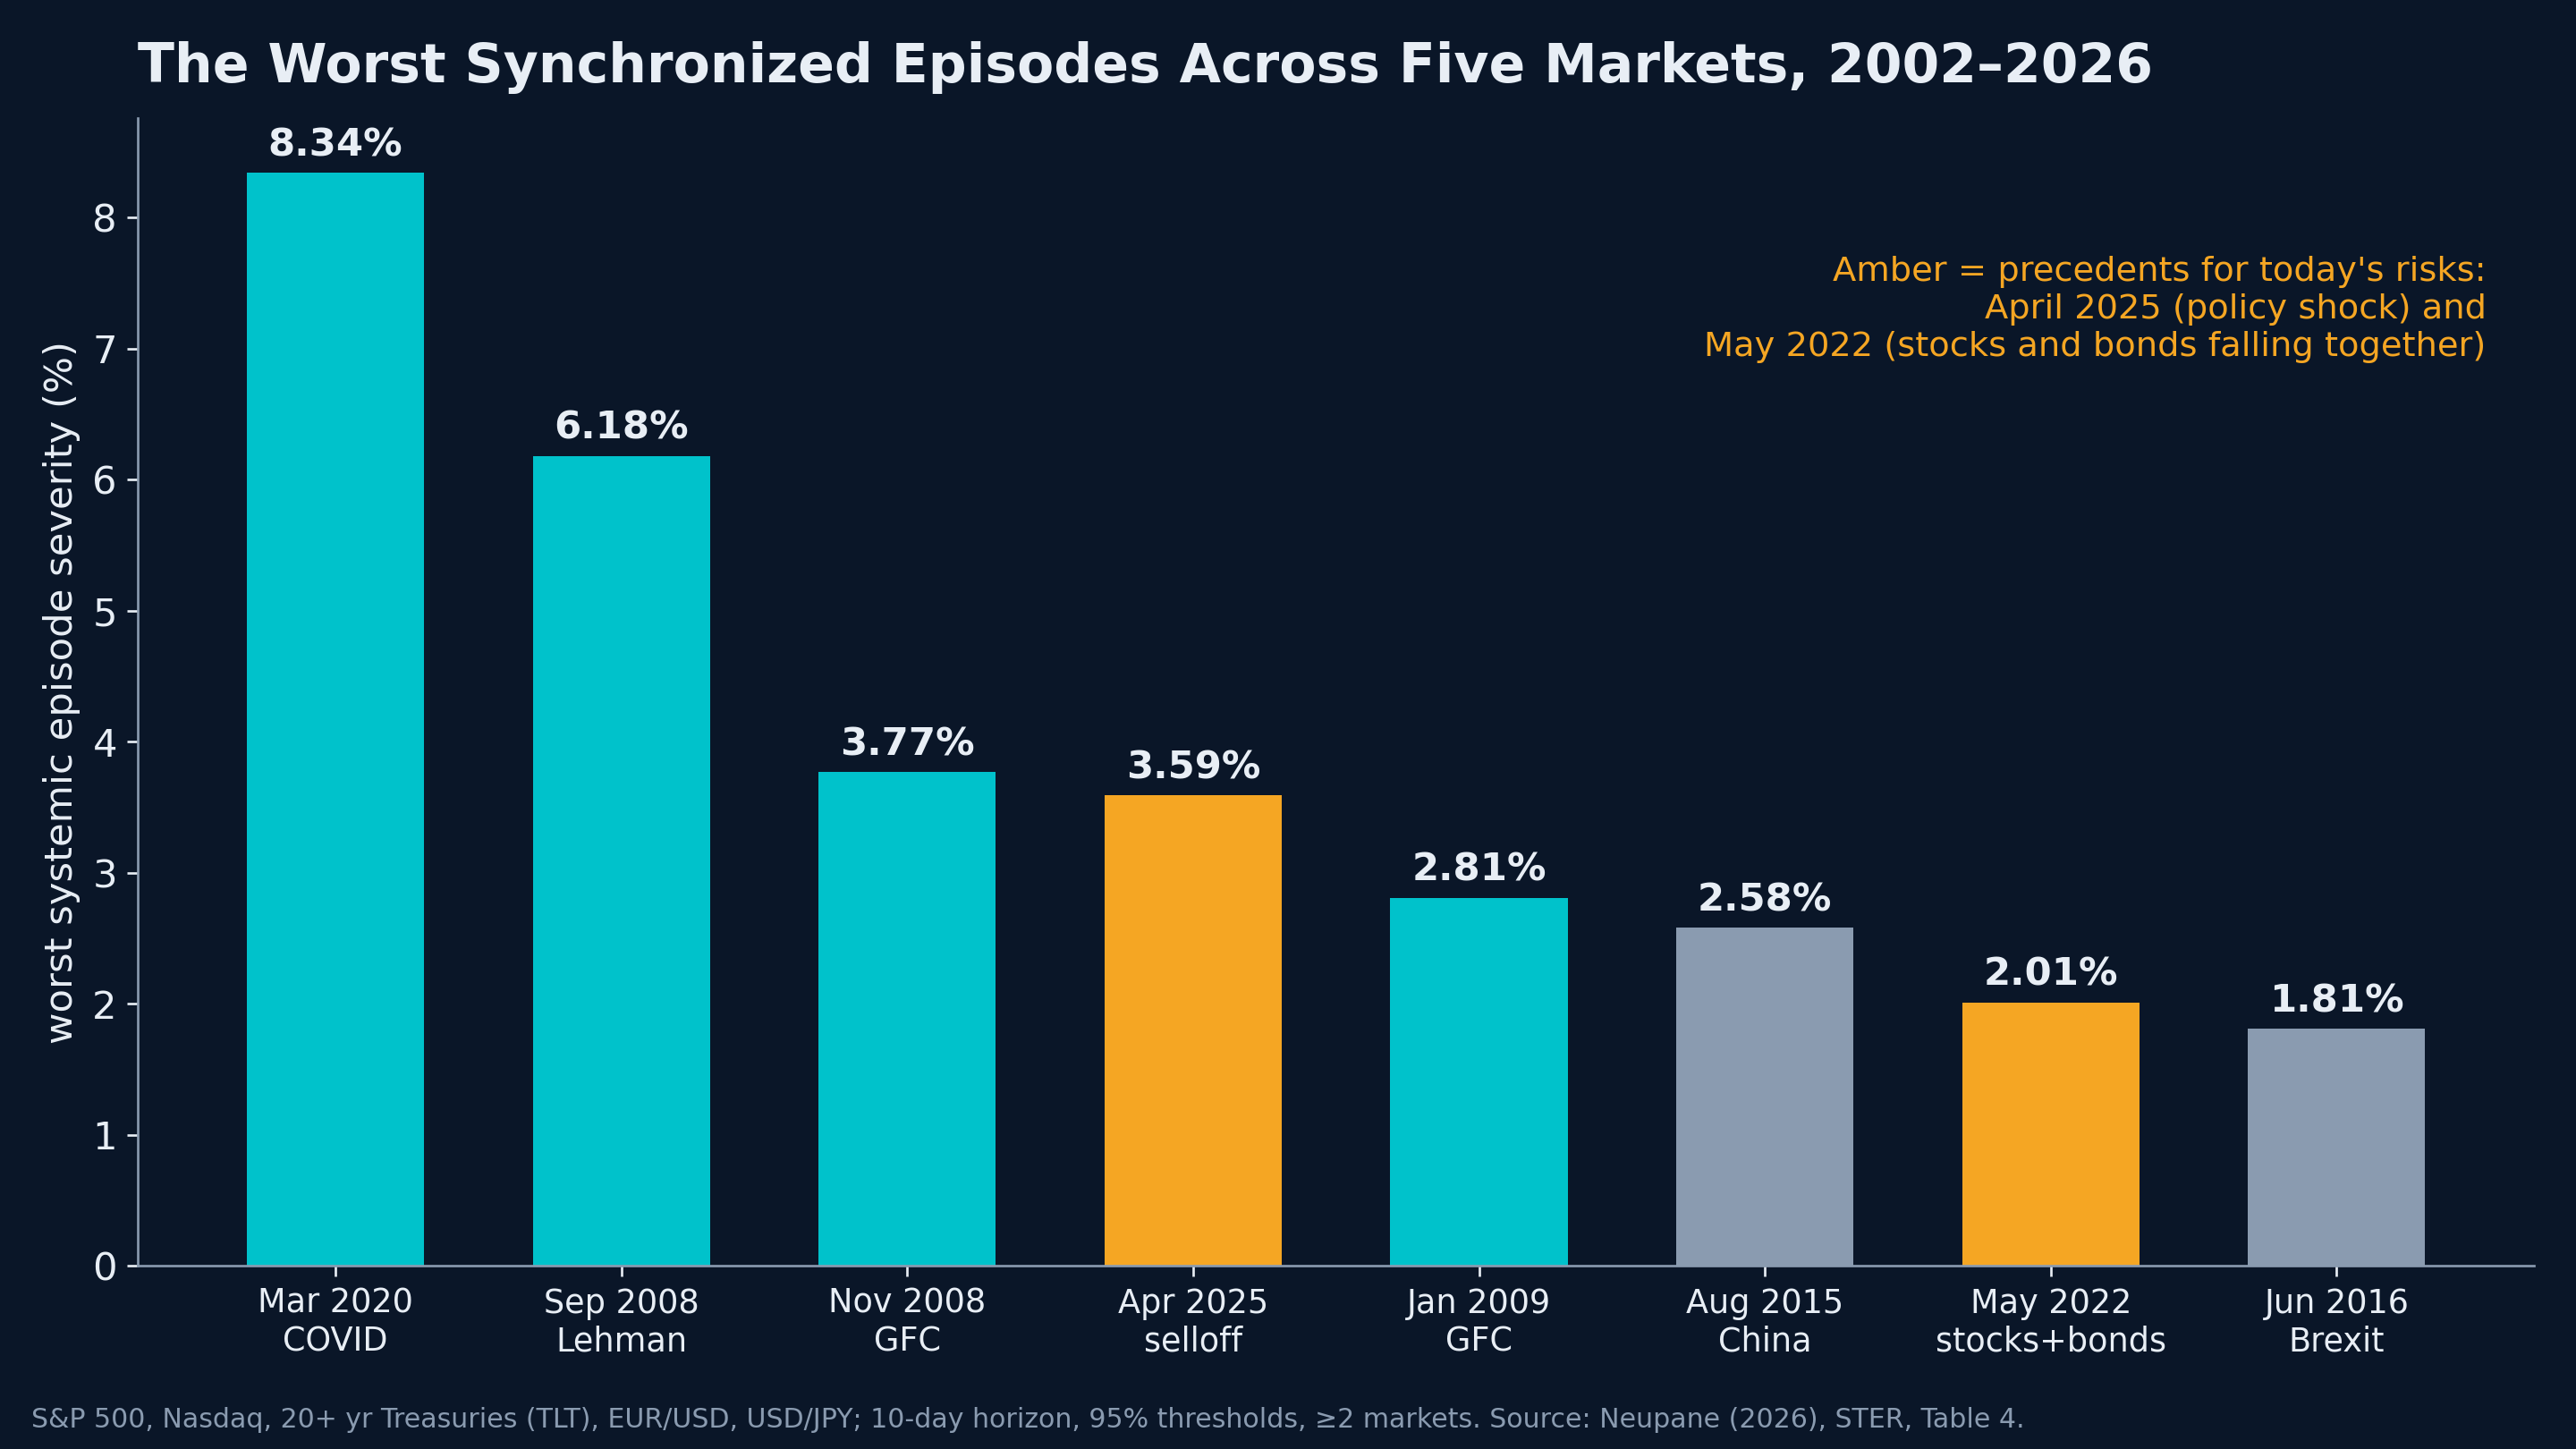
| Rank | Episode | Severity |
|---|---|---|
| 1 | March 2020 (COVID) | 8.34% |
| 2 | September 2008 (Lehman) | 6.18% |
| 3 | November 2008 (financial crisis) | 3.77% |
| 4 | April 2025 (selloff) | 3.59% |
| 5 | January 2009 (crisis aftermath) | 2.81% |
| 6 | August 2015 (China / global selloff) | 2.58% |
| 7 | May 2022 (stocks and bonds fall together) | 2.01% |
| 8 | June 2016 (Brexit) | 1.81% |
Finding 3: Every major episode was broad and sustained#
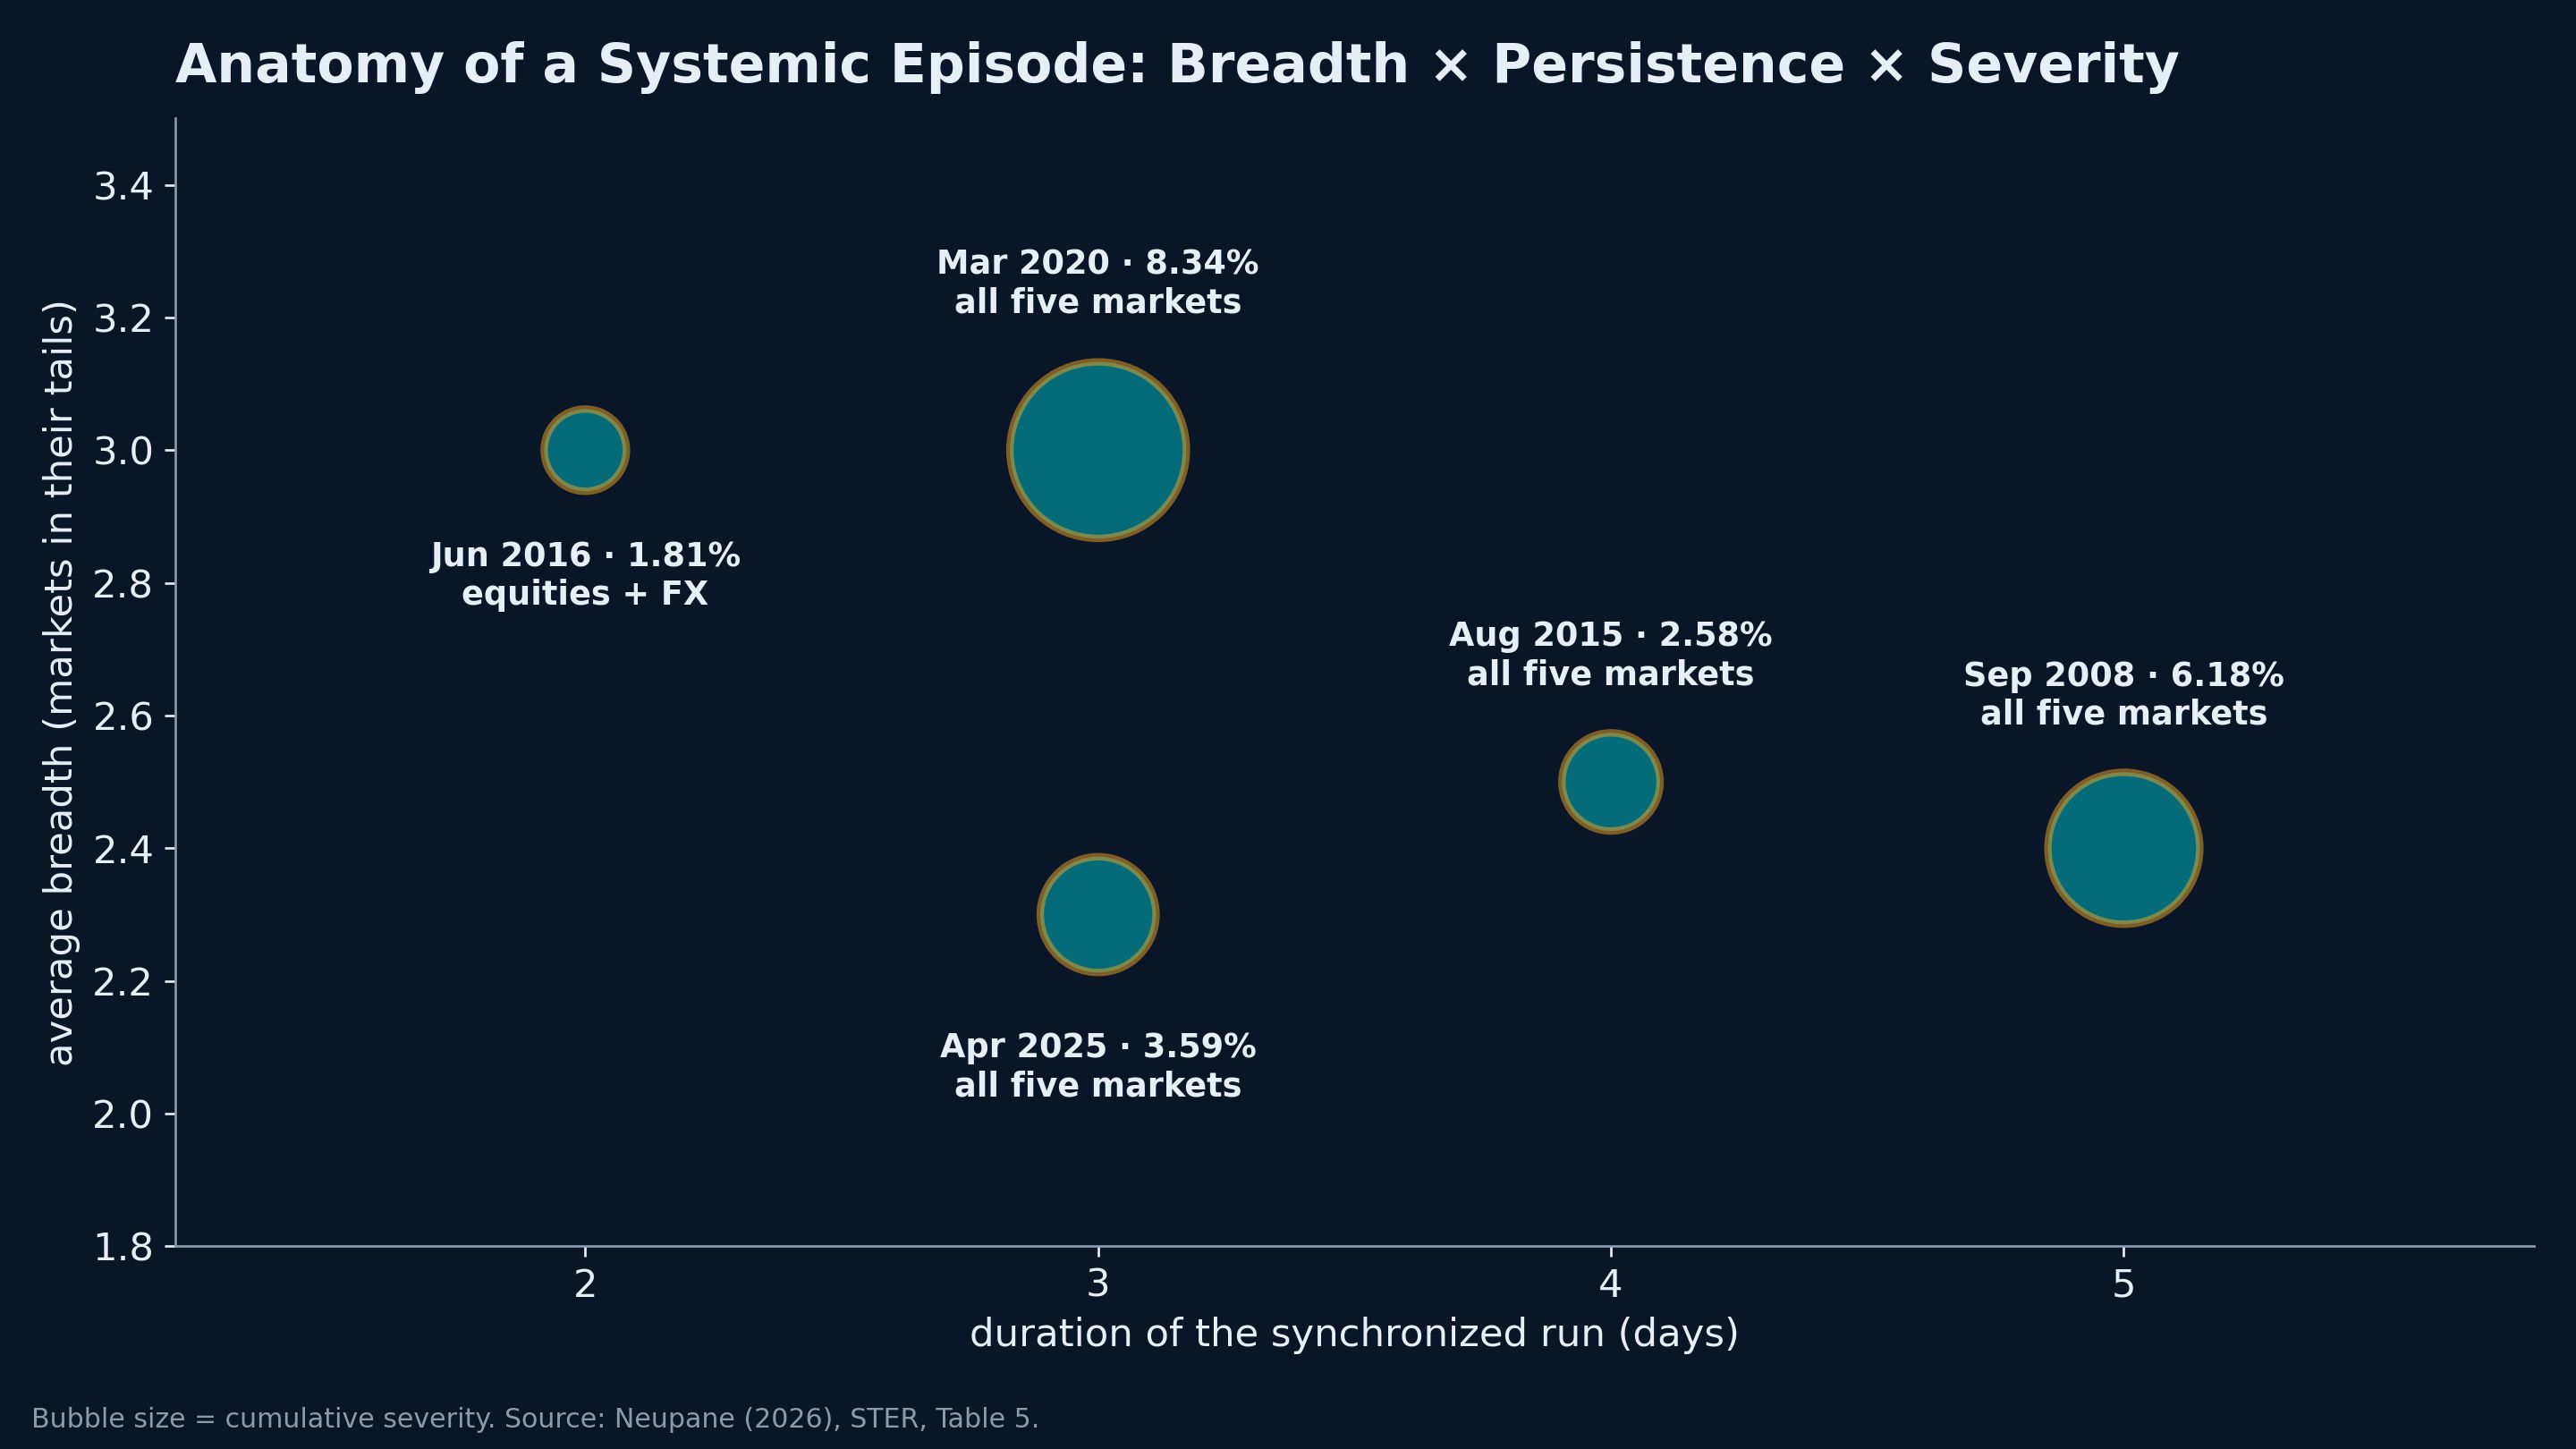
| Episode | Severity | Duration | Avg. markets in tail | Markets that breached |
|---|---|---|---|---|
| Mar 2020 | 8.34% | 3 days | 3.0 | All five, including Treasuries |
| Sep 2008 | 6.18% | 5 days | 2.4 | All five |
| Apr 2025 | 3.59% | 3 days | 2.3 | All five |
| Aug 2015 | 2.58% | 4 days | 2.5 | All five |
| Jun 2016 | 1.81% | 2 days | 3.0 | Equities and FX |
In none of these episodes did a single market break on its own. In most, even U.S. Treasuries, the system's safe haven, breached their tail thresholds.
What has not yet been shown#
CSTER's forecasting performance has not been tested yet. The paper specifies the full evaluation protocol: occurrence scored by Brier score and AUC, severity by a Fissler–Ziegel score, and comparison against a simple volatility and dependence benchmark under a purged walk-forward design. The results are left to companion work. In my earlier single-market study, the conditional forecasting layer did not beat a simple EWMA benchmark. Systemic episodes are rarer still, so forecasting them will be harder, and I will report the results honestly either way.
Advertisement
6. From bond shock to systemic episode: three pathways#↑ Contents
Read through STER, this week was a severe single-market episode that did not meet the breadth test for a systemic one. (This is a qualitative reading; realized STER was not computed for this week.)
History shows how that could change:
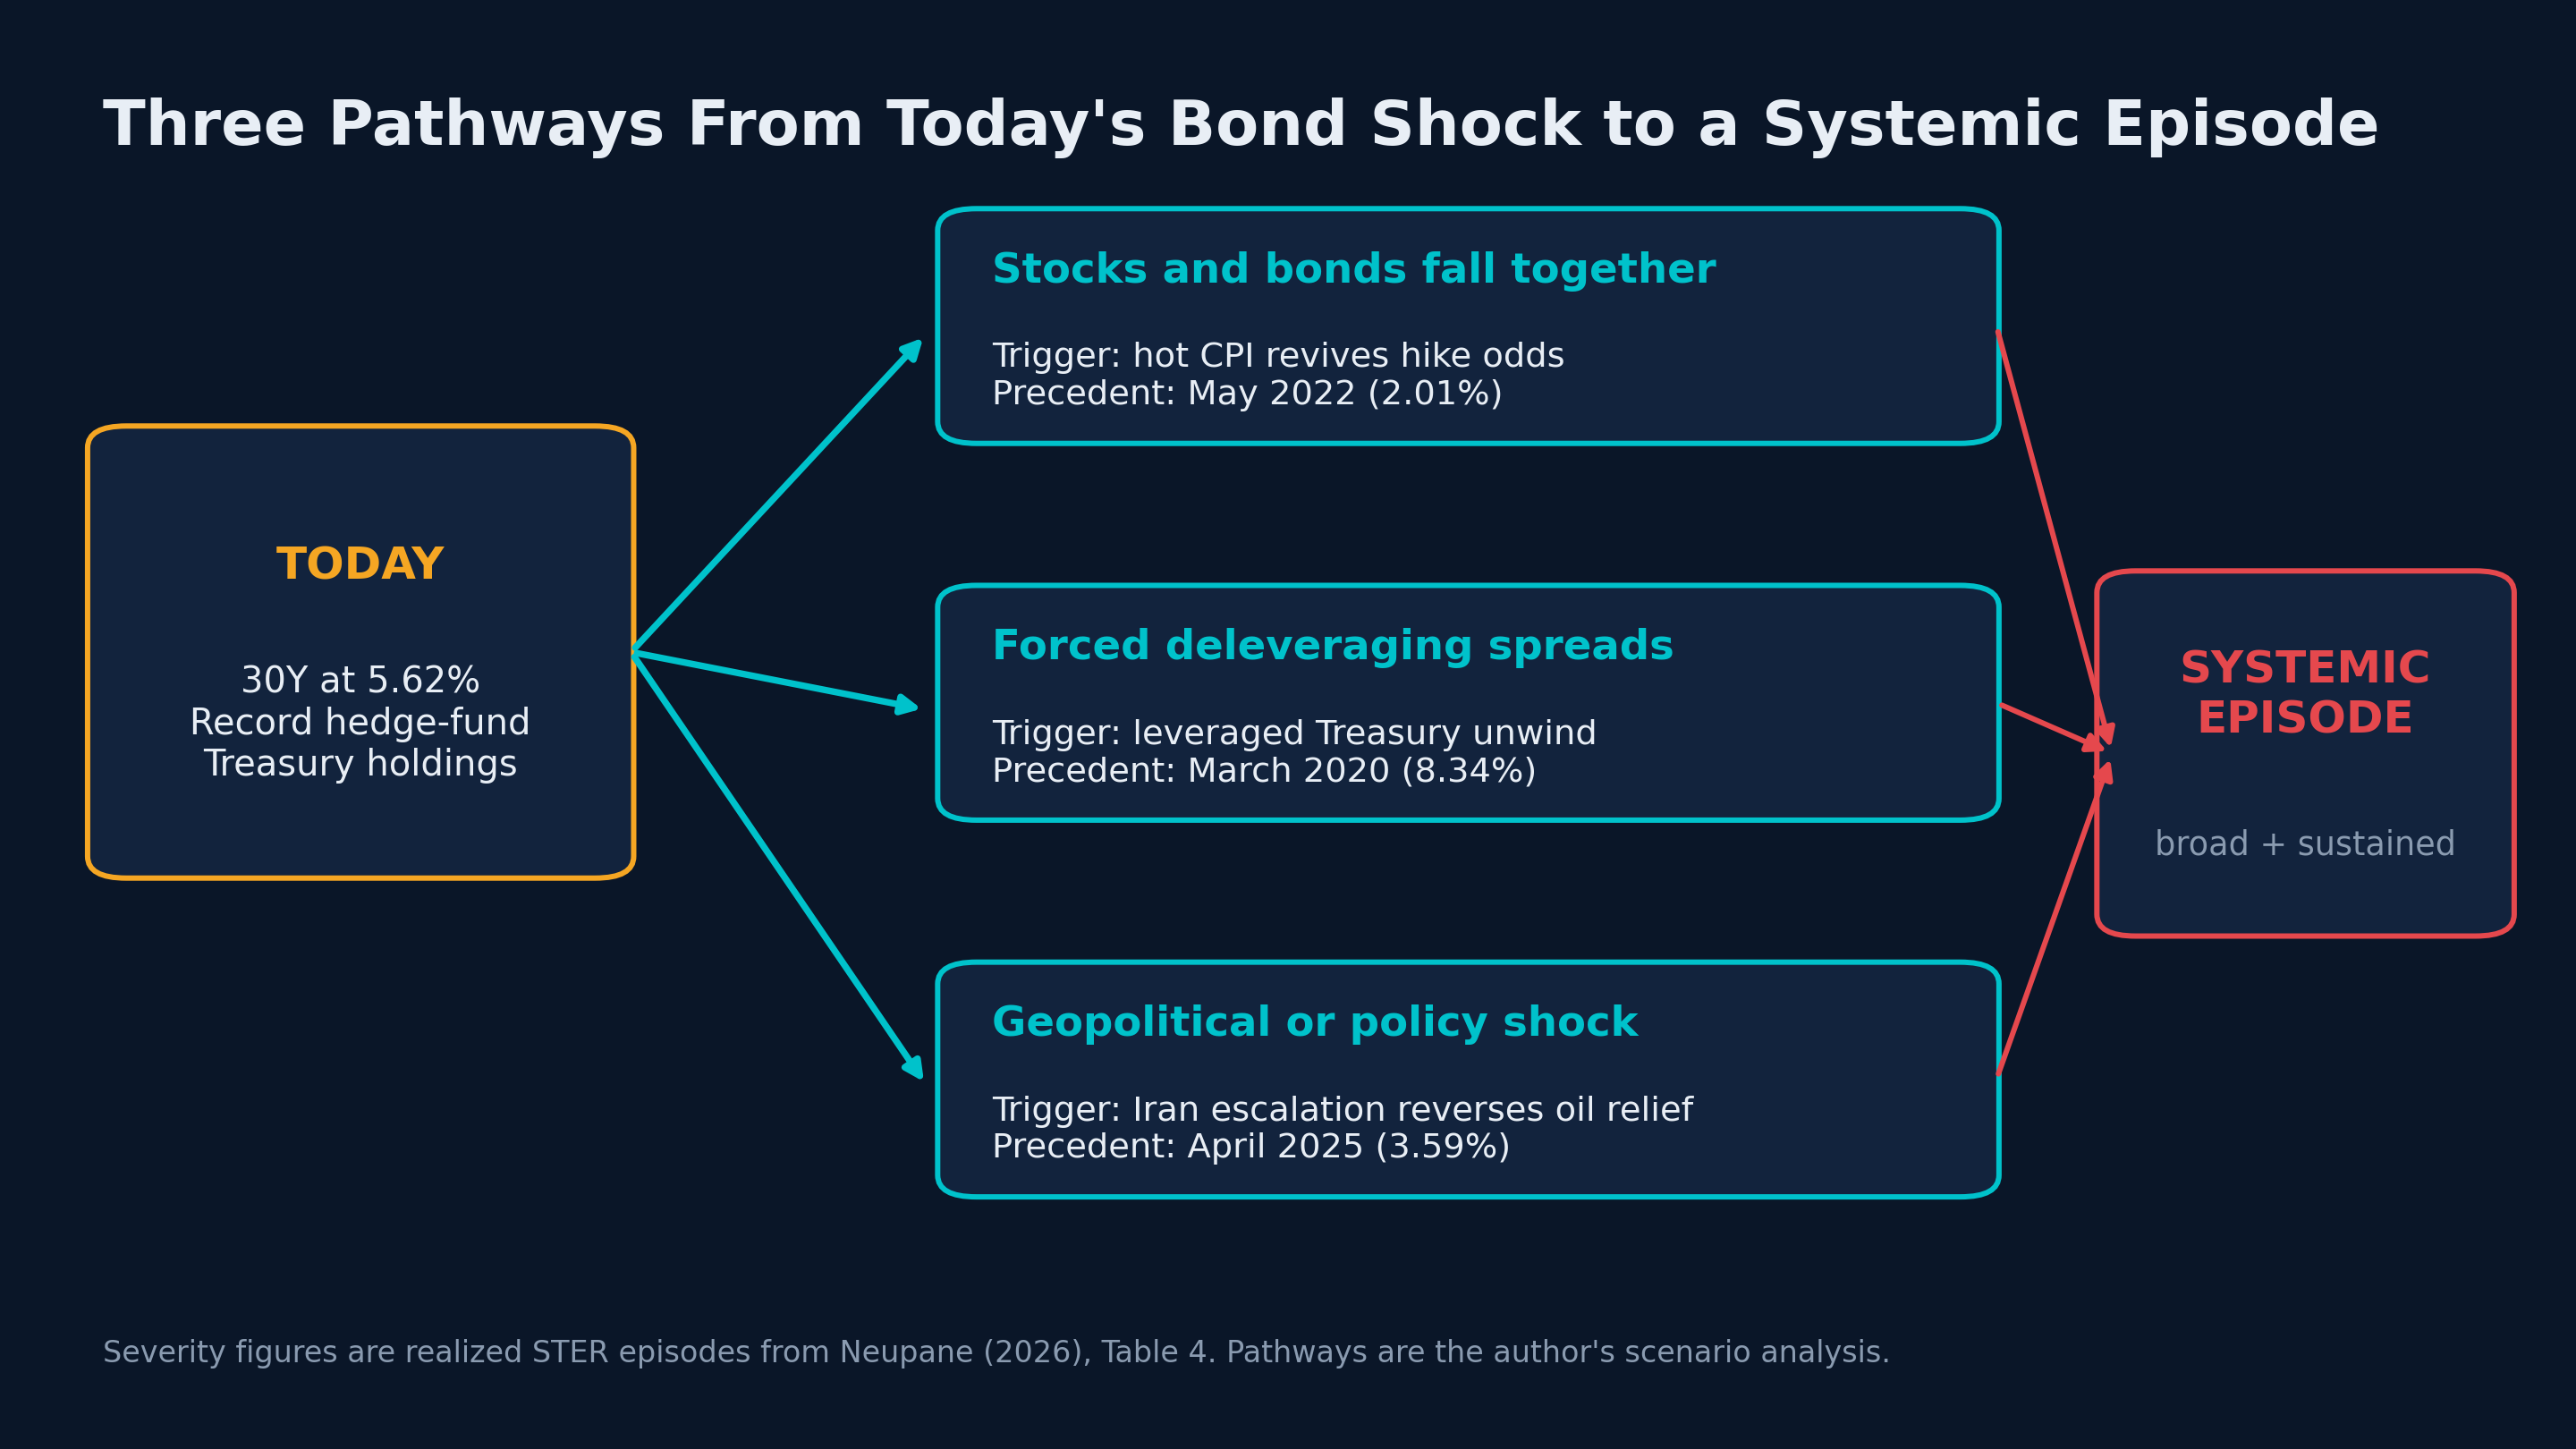
| Pathway | Trigger to watch | Historical precedent |
|---|---|---|
| Stocks and bonds fall together | A hot CPI report that revives Fed hike odds while long yields stay above 5% | May 2022: equities and Treasuries sold off together as rates rose |
| Forced deleveraging spreads | Record leveraged Treasury positions meeting a liquidity shock | March 2020: all five markets breached in a three-day run, the worst episode in the sample |
| Geopolitical or policy shock | Escalation in the Iran war reversing this week's oil relief | April 2025: all five markets breached in three days |
The second pathway deserves the most attention now. The worst systemic episode of the past quarter-century was one in which Treasuries broke alongside everything else, and leveraged positioning in Treasuries is now at a record.
7. Why this matters for U.S. financial stability#↑ Contents
When market stress spreads across asset classes, it stops being only an investment problem and becomes a public-policy one. The U.S. Treasury market finances the federal government, sets mortgage and corporate borrowing costs, and backs collateral across the entire financial system. A synchronized, sustained breakdown that includes Treasuries affects households, businesses and taxpayers, not just traders.
| Stakeholder | What point-in-time measures show today | What STER adds |
|---|---|---|
| Federal Reserve and financial-stability supervisors | Severity of joint stress on a given day | Whether stress across markets is lasting, which is when it amplifies |
| Banks and broker-dealers | One-day joint tail exposure | How large a multi-day synchronized episode can become, which drives funding and liquidity strain |
| Stress-test designers | Scenarios built as one-off shocks | Scenarios calibrated to the real duration and breadth of historical episodes |
| Pension funds and asset managers | Diversification measured in normal times | Whether diversification holds when markets crash together |
STER is also built for oversight. It can be backtested with a standard scoring rule (the pinball loss) without model assumptions, just like Value-at-Risk. Its realized values can be computed from public market data. The full replication code is publicly available, so supervisors, researchers and institutions can verify and extend the work.
8. What risk managers can do now#↑ Contents
| # | Action | Why |
|---|---|---|
| 1 | Track breadth daily: how many key markets are in their own tails at the same time | It is the simplest early-warning signal of systemic stress |
| 2 | Measure how long joint stress lasts, not only whether a breach occurred today | Persistence is what turns a shock into a crisis |
| 3 | Stress-test stocks and bonds falling together | The traditional stock–bond hedge failed in 2022 and is vulnerable again with yields above 5% |
| 4 | Measure tail dependence, not just correlation | Diversification measured in normal markets can disappear in a crisis |
| 5 | Monitor leveraged Treasury positioning | It is the most direct path from a bond shock to a cross-market episode |
| 6 | Validate any new systemic measure before relying on it, including STER | Its breadth gate, horizon and thresholds are design choices that need governance |
The bottom line#↑ Contents
This week, one market broke and the others didn't. Long-dated Treasury yields reached their highest levels since 2002, but equities diverged, oil eased, and relief arrived before stress could spread or last.
The September CPI report comes next, and the Federal Reserve meets October 27–28. If inflation surprises to the upside while long yields stay above 5%, the question will no longer be how high Treasury yields go. It will be how many other markets go with them, and for how long.
That is the question Systemic Tail Episode Risk was built to answer. Systemic crises are rarely one market's worst day. They are many markets' worst days happening together and lasting.
Read the research
Systemic Tail Episode Risk (working paper, September 2026): replication code and data at github.com/nirajneupane17/systemic-tail-episode-risk
Conditional Tail Episode Risk (companion paper, SSRN): papers.ssrn.com/sol3/papers.cfm?abstract_id=7502499
About the author#
Niraj Neupane, CA (ICAI), is a quantitative researcher whose work develops new measures of path-dependent and systemic tail risk for financial institutions and regulators. He is the founder of Korvane, an AI-powered trade, risk and validation platform, and Calderyn Institute, which trains professionals in quantitative finance and AI engineering. His research papers are Conditional Tail Episode Risk (SSRN, 2026) and Systemic Tail Episode Risk (working paper, 2026). ORCID: 0009-0003-7026-7026.
Views expressed are the author's own and do not represent any employer.
Sources#
Market data, September 28 – October 2, 2026
- Yahoo Finance, Stock Market Today (Sept 30, 2026): https://finance.yahoo.com/markets/stocks/articles/stock-market-today-sept-30-134209395.html
- Yahoo Finance, live updates (Sept 30, 2026): https://finance.yahoo.com/markets/live/stock-market-today-wednesday-september-30-dow-sp-500-nasdaq-080339262.html
- Yahoo Finance, live updates (Oct 2, 2026): https://finance.yahoo.com/markets/live/stock-market-today-friday-october-2-dow-sp-500-nasdaq-september-jobs-report-080623878.html
- The Day's Record, US Stock Market on September 30, 2026: https://www.whendomarketsopen.com/market-history/2026-09-30/
- TheStreet, Stock Market Today (Oct 2, 2026): https://www.thestreet.com/stock-market-today/stock-market-today-dow-jones-sp-500-nasdaq-updates-oct-02-2026
- Quartz, Treasury yields and the September jobs report (Oct 2, 2026): https://qz.com/treasury-yields-september-jobs-report-fed-rate-hike-100226
- CNBC, September 2026 jobs report: https://www.cnbc.com/2026/10/02/jobs-report-september-2026.html
- CNBC, Fed rate-hike odds after jobs report: https://www.cnbc.com/2026/10/02/fed-rate-hike-odds-decline-after-september-jobs-report.html
- Alain Guillot, Stock Market Recap (Oct 2, 2026): https://www.alainguillot.com/stock-market-recap-october-2-2026/
Research
- Neupane, N. (2026). Systemic Tail Episode Risk: Persistence and Cumulative Severity of Synchronized Extreme-Loss Episodes Across Markets. Working paper. https://github.com/nirajneupane17/systemic-tail-episode-risk
- Neupane, N. (2026). Conditional Tail Episode Risk: A Path-Dependent Framework for Extreme-Loss Episodes Beyond Value-at-Risk and Expected Shortfall. SSRN 7502499.
- Acharya, V. V., Pedersen, L. H., Philippon, T., & Richardson, M. (2017). Measuring systemic risk. Review of Financial Studies, 30, 2–47.
- Adrian, T., & Brunnermeier, M. K. (2016). CoVaR. American Economic Review, 106, 1705–1741.
- Bae, K.-H., Karolyi, G. A., & Stulz, R. M. (2003). A new approach to measuring financial contagion. Review of Financial Studies, 16, 717–763.
- Basrak, B., & Segers, J. (2009). Regularly varying multivariate time series. Stochastic Processes and their Applications, 119, 1055–1080.
- Brownlees, C., & Engle, R. F. (2017). SRISK: a conditional capital shortfall measure of systemic risk. Review of Financial Studies, 30, 48–79.
- Kubitza, C. (2025). Tackling the volatility paradox: spillover persistence and systemic risk. Journal of Financial and Quantitative Analysis, 60(6), 2997–3023.