Disclaimer: This article is for educational purposes only and is not investment advice. Investing involves risk, including loss of capital.
AI disclosure. Researched and drafted with the help of Claude, made by Anthropic, the company discussed. All figures are from Anthropic’s S-1; the analysis is Financial Gurkha’s.
Part of our Anthropic S-1 series. For governance, pay, cash, compute deals and risks, read the full analysis: Inside Anthropic’s S-1: The Complete Breakdown of the IPO Filing.
The 60-Second Version#↑ Contents
| Period | Revenue | Growth |
|---|---|---|
| 2023 | $41M | — |
| 2024 | $386M | 9.4× |
| 2025 | $4.59B | 11.9× |
| First half 2026 | $16.3B | 14.0× the first half of 2025 |
| Q2 2026 | $11.6B | 14.7× Q2 2025; 2.44× Q1 2026 |
- Revenue grew about tenfold a year, then 14× year on year in the first half of 2026.
- Growth slowed through 2025, then re-accelerated in 2026, as the agent products Claude Code and Claude Cowork spread.
- Compute cost per revenue dollar fell from $2.51 to $0.48 in six quarters. That drove the first operating profit: $974 million in Q2 2026.
What's in this report#
- The 60-Second Version
- 1. Annual Revenue
- 2. Half-Year Revenue
- 3. Quarterly Revenue
- 4. How Growth Became Profit
- 5. What Kind of Revenue It Is
- 6. What the Filing Says About the Future
- Frequently Asked Questions
1. Annual Revenue#↑ Contents
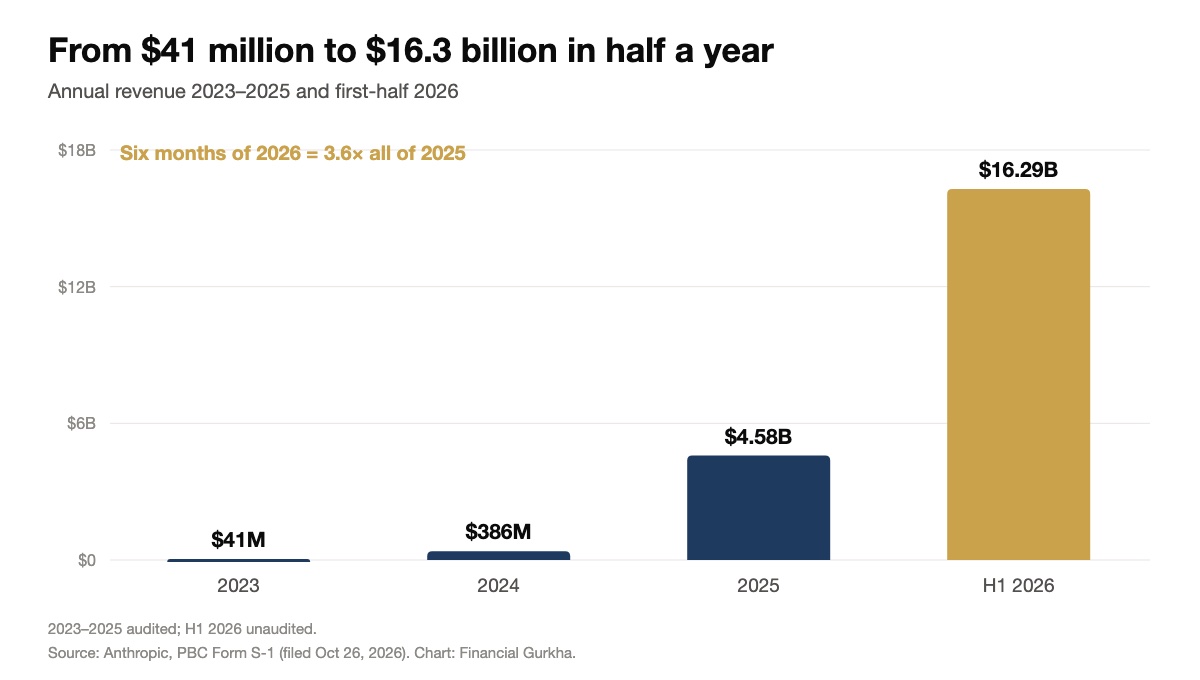
Anthropic grew revenue 9.4× in 2024 and 11.9× in 2025.
| Year | Revenue | Multiple of prior year |
|---|---|---|
| 2023 | $41M | — |
| 2024 | $386M | 9.4× |
| 2025 | $4,585M | 11.9× |
2. Half-Year Revenue#↑ Contents
| Half | Revenue | vs prior half | vs same half a year earlier |
|---|---|---|---|
| H1 2025 | $1,163M | — | — |
| H2 2025 | $3,422M | 2.9× | — |
| H1 2026 | $16,286M | 4.8× | 14.0× |
H2 2025 is our arithmetic: full-year $4,585 million less first-half $1,163 million. Six months of 2026 produced 3.6 times all of 2025.
3. Quarterly Revenue#↑ Contents
| Quarter | Revenue | Quarter-on-quarter |
|---|---|---|
| Q1 2025 | $376M | — |
| Q2 2025 | $787M | 2.09× |
| Q3 2025 | $1,382M | 1.76× |
| Q4 2025 | $2,040M | 1.48× |
| Q1 2026 | $4,731M | 2.32× |
| Q2 2026 | $11,555M | 2.44× |
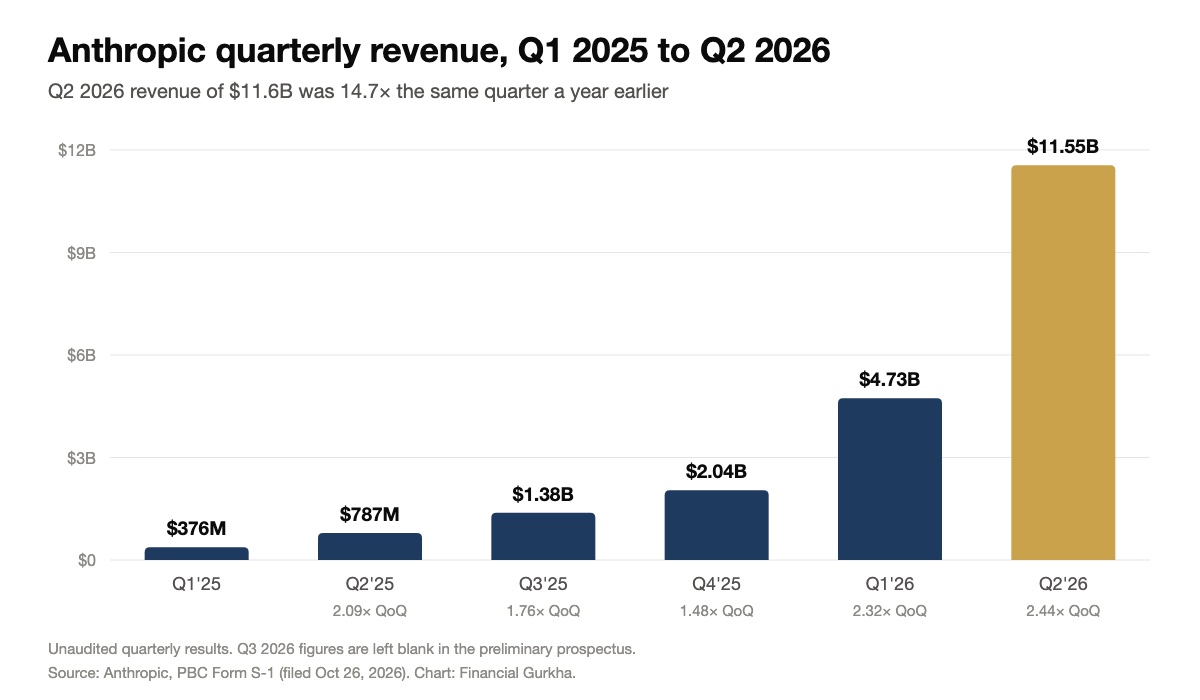
The quarter-on-quarter multiple shows a curve that slowed, then re-accelerated: 2.09×, 1.76×, 1.48×, then 2.32× and 2.44×. September-quarter figures are left blank in the preliminary prospectus. The filing does disclose that Q3 2026 revenue was 86 times Q4 2024’s.
4. How Growth Became Profit#↑ Contents
The turn to profit came from compute getting cheaper per dollar of revenue, not from spending less.
| Quarter | Compute cost | Compute per $1 of revenue | Operating income (loss) | Margin |
|---|---|---|---|---|
| Q1 2025 | $944M | $2.51 | $(935)M | −249% |
| Q2 2025 | $1,390M | $1.77 | $(1,200)M | −152% |
| Q3 2025 | $2,047M | $1.48 | $(3,089)M | −224%* |
| Q4 2025 | $2,945M | $1.44 | $(2,836)M | −139% |
| Q1 2026 | $3,387M | $0.72 | $(1,667)M | −35% |
| Q2 2026 | $5,558M | $0.48 | $974M | +8.4% |
*Includes the $1.5 billion Bartz copyright settlement.
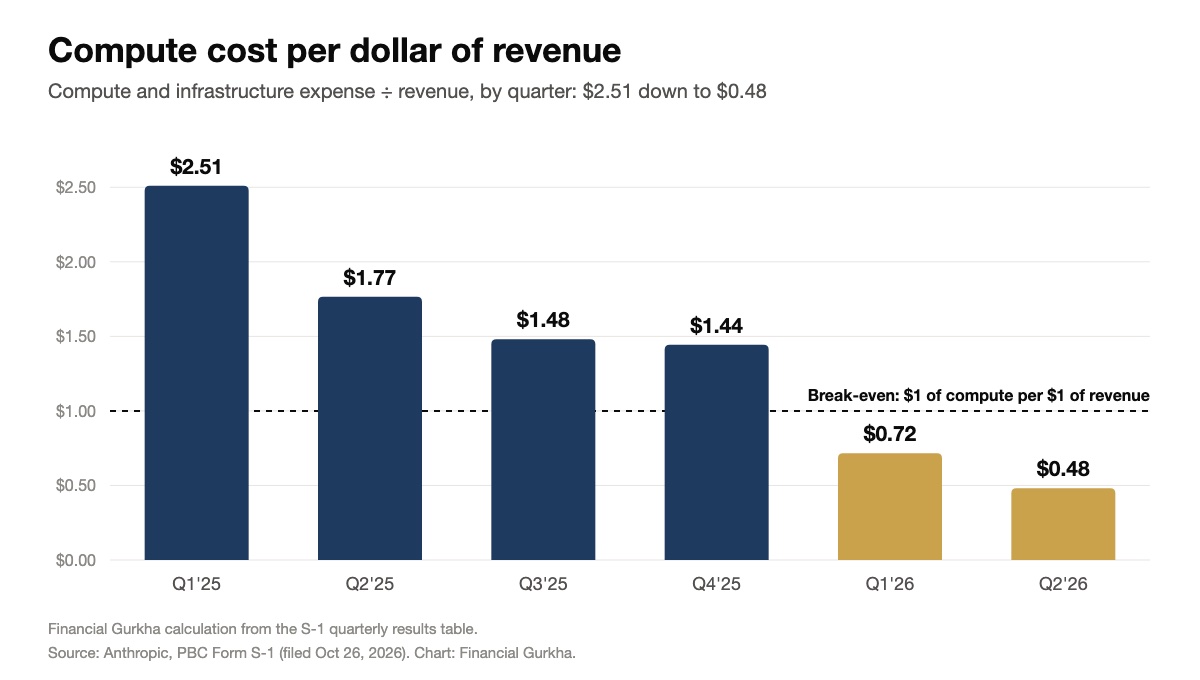
Compute spending still grew 4× year on year in Q2 2026, while revenue grew 14.7×. The filing’s own phrasing: revenue “grew 1,368% year over year… compared to compute and infrastructure expenses that grew 300%.”
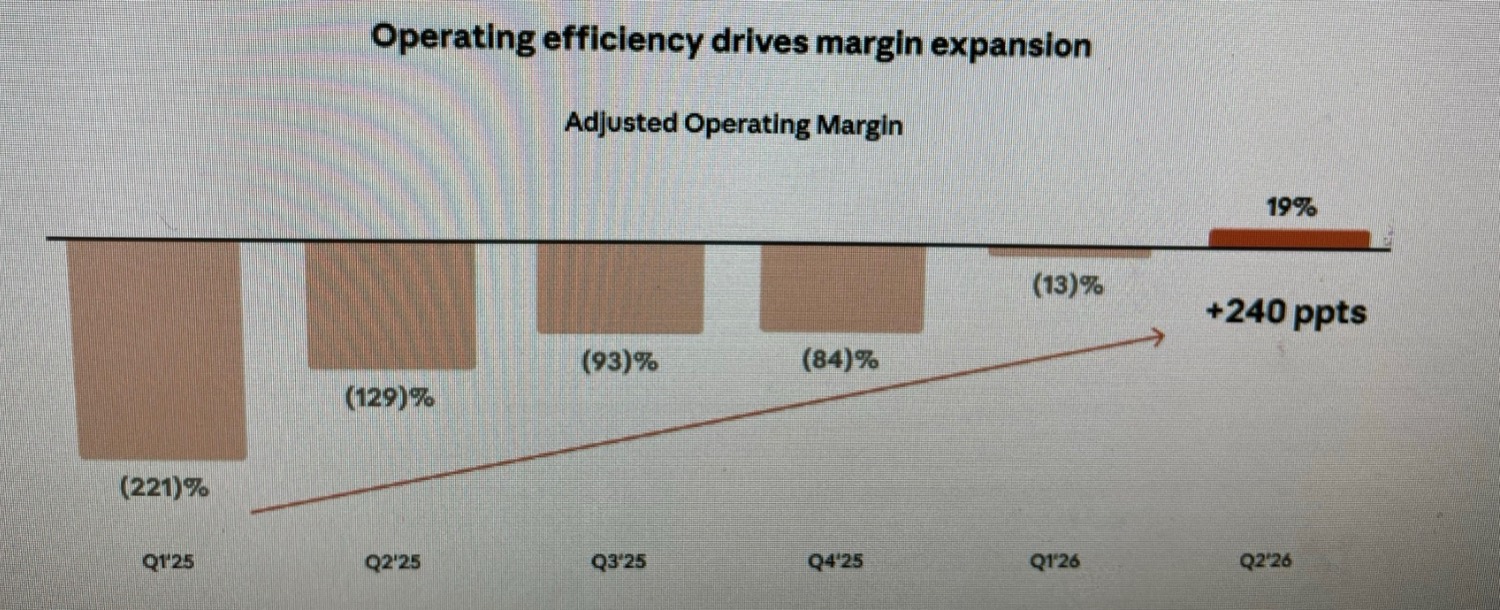
On Anthropic’s non-GAAP measure, which excludes stock compensation, the adjusted operating margin went from −221% in Q1 2025 to +19% in Q2 2026.
5. What Kind of Revenue It Is#↑ Contents
Most revenue is pay-as-you-go. Customers pay per token of model use, rather than fixed subscriptions.
| Consumption | Subscriptions | |
|---|---|---|
| 2024 | 75% | 25% |
| 2025 | 83% | 17% |
| H1 2026 | 80% | 20% |
Large customers drive it:
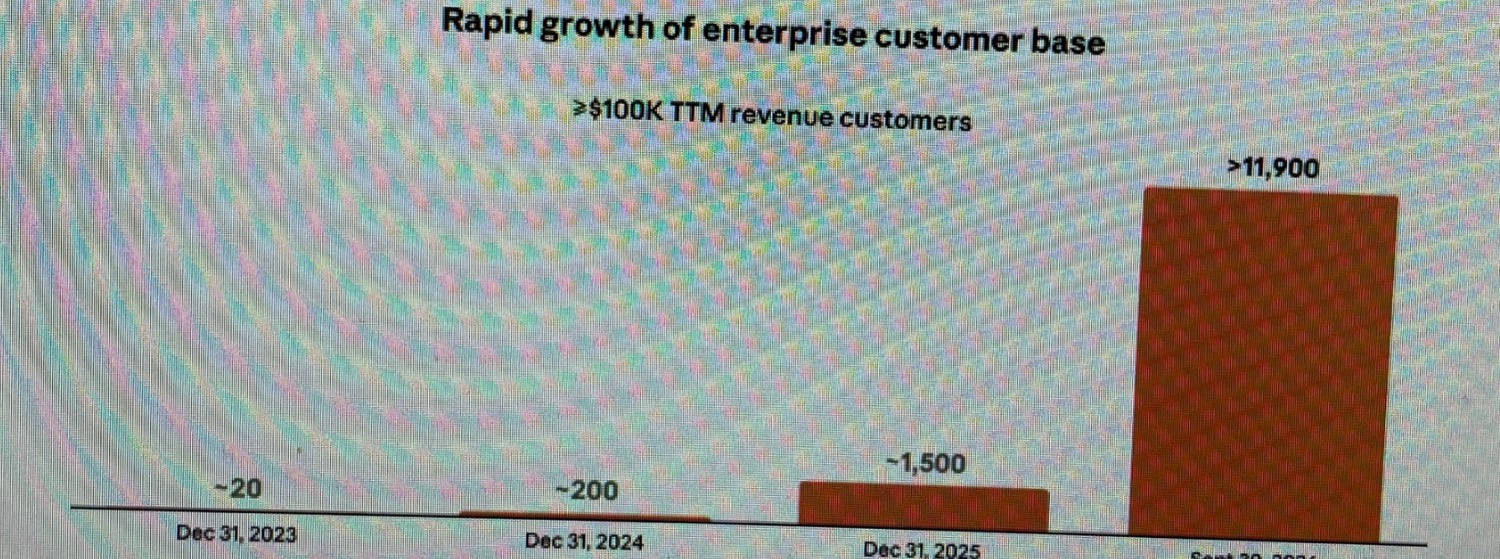
- Customer count: customers paying $100,000+ a year grew from about 20 at the end of 2023 to more than 11,900 by September 2026. In 2025 they produced 76% of revenue.
- Expansion: existing customers’ spending grew about 9× in a year (net revenue retention of ~900%).
- Breadth: no customer exceeds 10% of revenue. Beyond the large accounts there are about 40 million smaller customers.
6. What the Filing Says About the Future#↑ Contents
The filing is candid:
- Growth will slow. It expects the growth rate to decline, “possibly significantly.”
- New releases drive revenue. Models released in the prior six months produced over 80% of Q3 2026 revenue.
- Seasonality matters. Customer spending fell about 20% over the 2025–26 holiday weeks, an effect that will show more as growth slows.
Frequently Asked Questions#↑ Contents
What was Anthropic’s revenue in 2025? Anthropic’s revenue was $4.585 billion in 2025, up 11.9 times from $386 million in 2024, according to its S-1.
What was Anthropic’s revenue in the second quarter of 2026? $11.555 billion, 2.44 times the prior quarter and 14.7 times the $787 million of Q2 2025.
When did Anthropic become profitable? Anthropic reported its first quarterly operating profit in Q2 2026: $974 million, an 8.4% operating margin. It remains loss-making on a net basis because of non-cash fair-value charges on convertible notes.
Why did Anthropic’s margins improve so fast? Because compute got cheaper per unit of revenue. Compute and infrastructure cost fell from $2.51 per revenue dollar in Q1 2025 to $0.48 in Q2 2026, even as compute spending grew fourfold.
Read the complete analysis: Inside Anthropic’s S-1: The Complete Breakdown of the IPO Filing
Methodology and Sources#↑ Contents
Figures are from Anthropic, PBC’s Form S-1 filed October 26, 2026: the audited annual results and the unaudited quarterly and interim results. Growth multiples, second-half 2025 revenue and compute per revenue dollar are Financial Gurkha calculations. Source: SEC EDGAR.