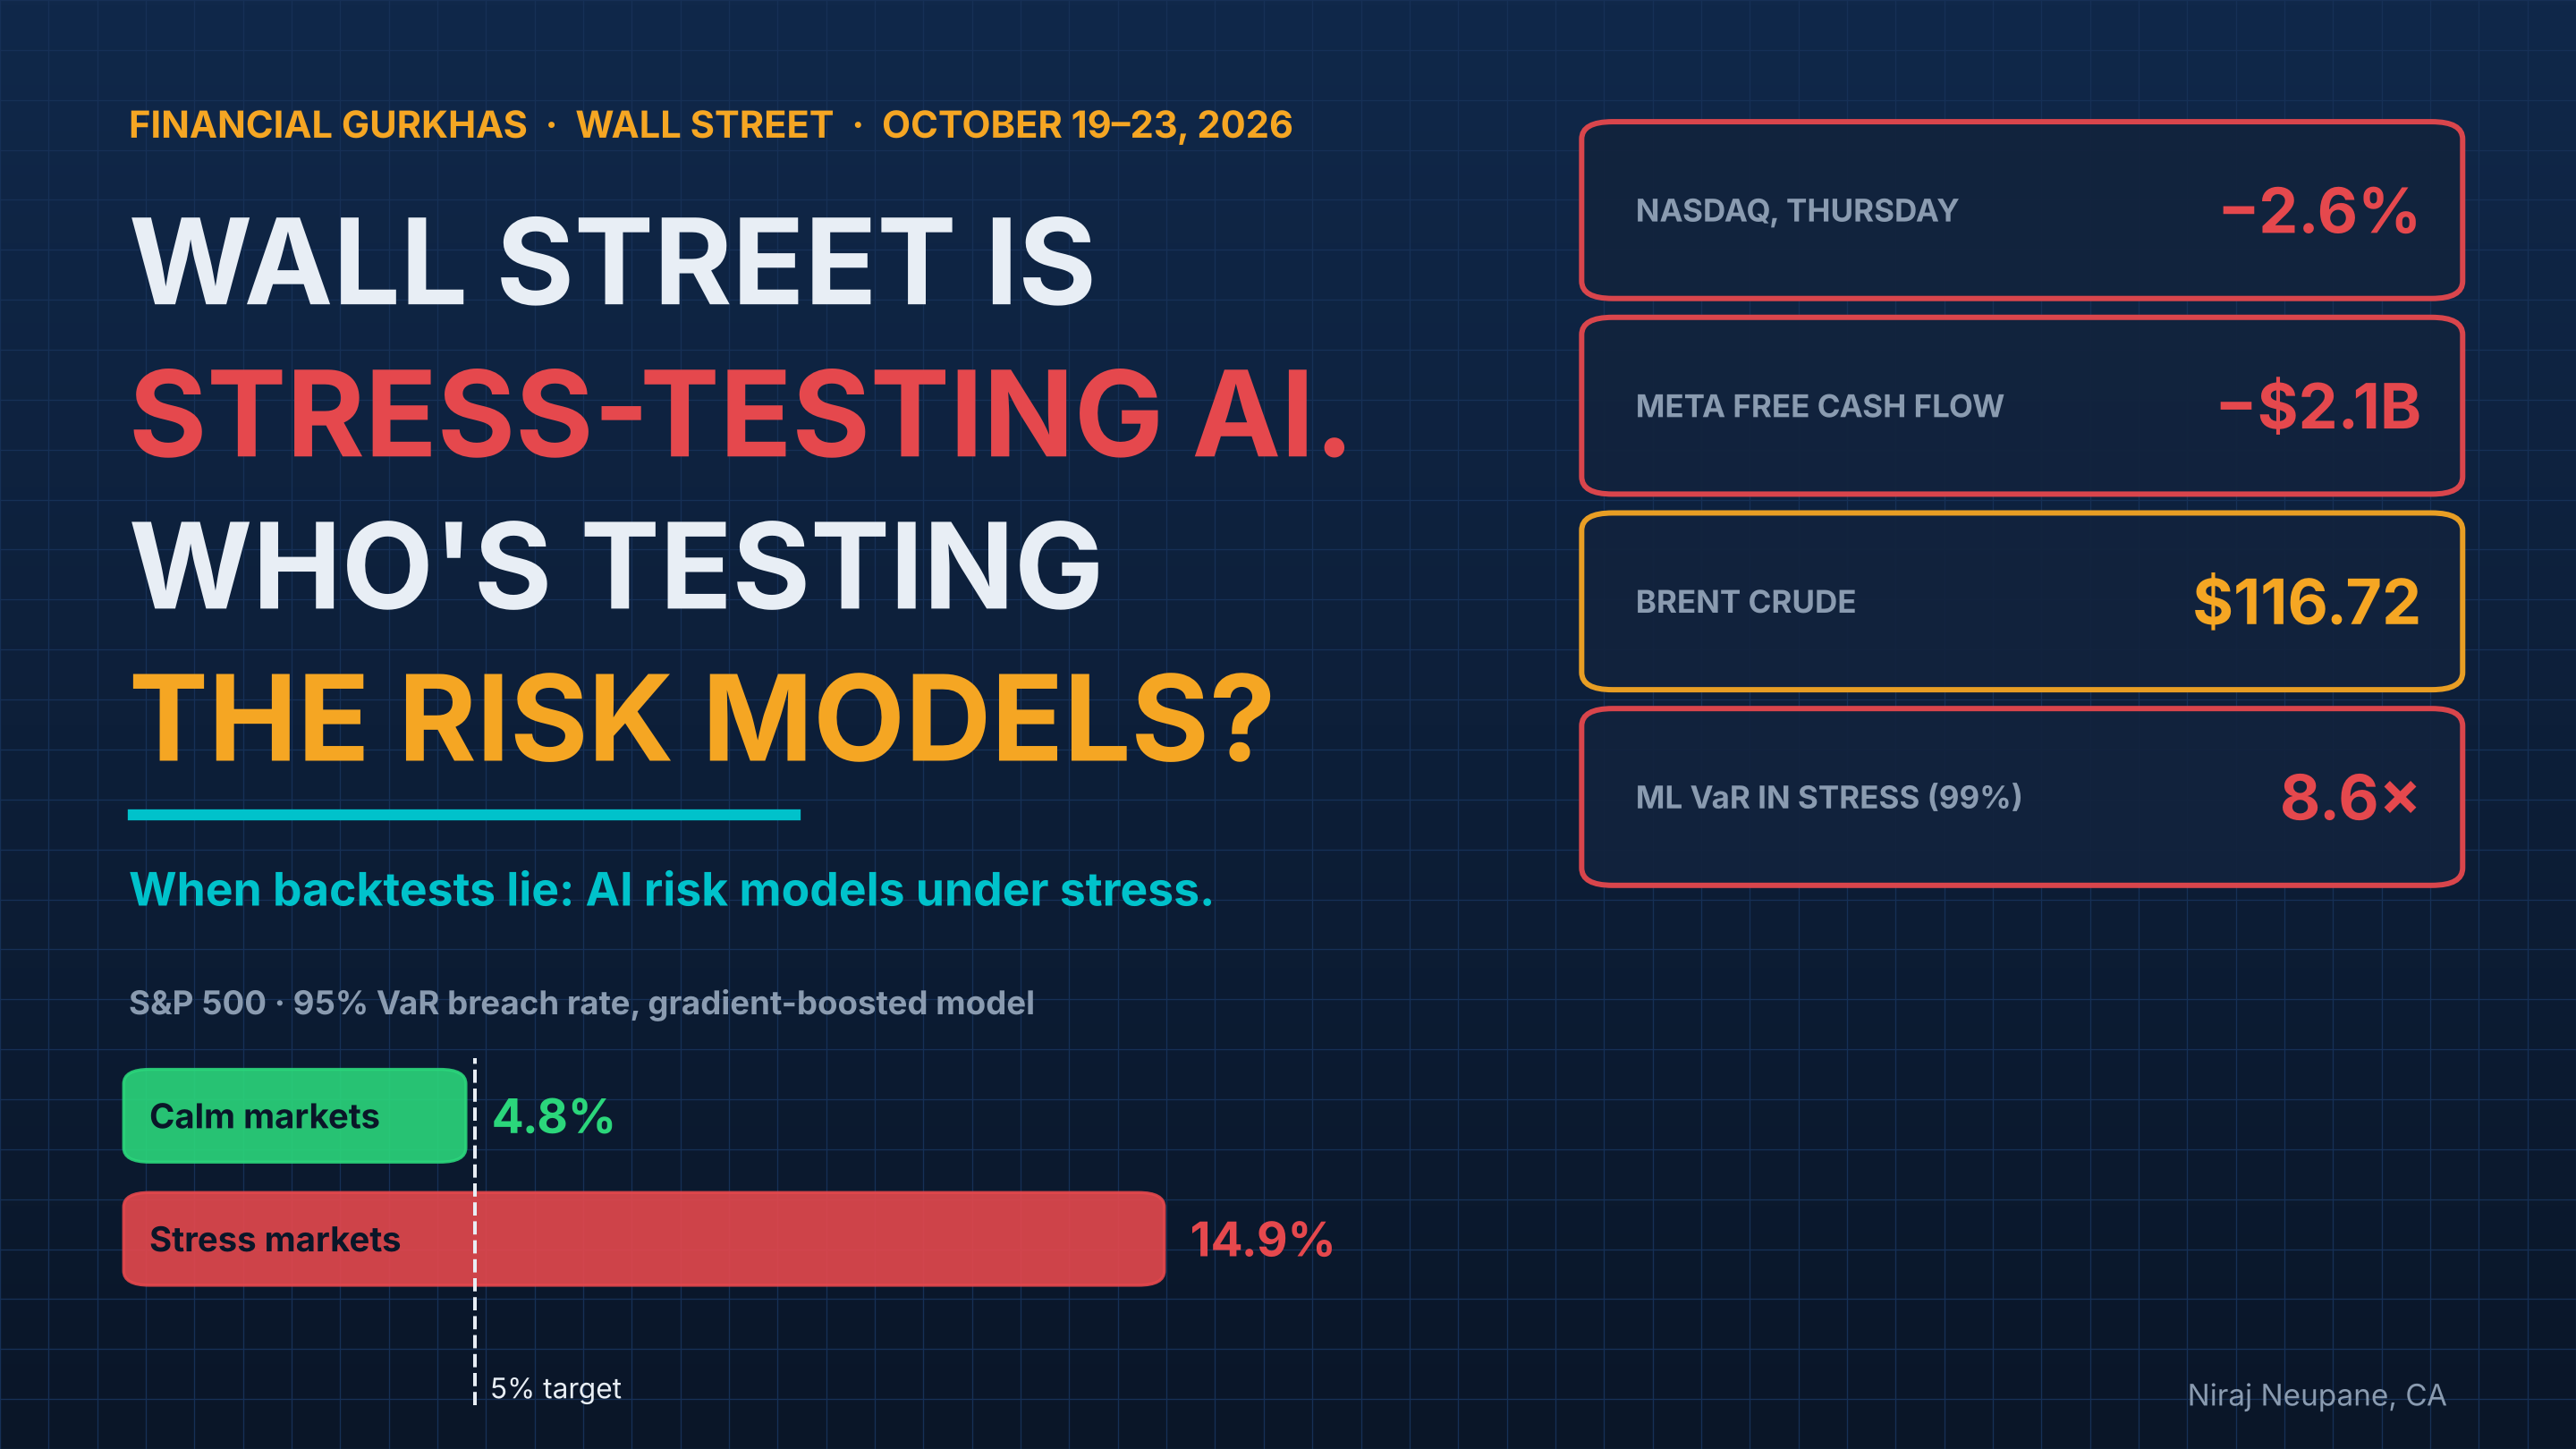
MARKETS · AI · MODEL RISK · U.S. FINANCIAL STABILITY
By Niraj Neupane, CA (ICAI) Quantitative Researcher, Korvane · Financial Economist, Calderyn Institute
Key takeaways
The week. The Nasdaq fell 2.6% on Thursday, its worst day since July, after Meta reported its first negative free cash flow since 2012. Brent crude hit $116.72, its highest since June 2022.
The theme. Investors stopped rewarding AI spending and started demanding proof of cash returns. Companies showing cash (SpaceX, Super Micro) rose; cash-hungry spenders (Meta, CoreWeave) fell.
The hidden risk. Markets are stress-testing AI companies. But the AI models banks use to measure risk face their own stress test, and most are validated with tools built for calm markets.
The research. In my paper When Backtests Lie, risk models that pass the standard regulatory backtest breach their limits 2–3× too often in stress, and a machine-learning model breaches up to 8.6× too often at the 99% level that sets bank capital.
What's in this report#
- The week in 10 numbers
- 1. The week: up three days, then the AI trade broke
- 2. The $35 billion question: Meta's cash-flow test
- 3. AI is not one trade
- 4. Oil: the other stress test
- 5. SpaceX shakes up telecom
- 6. The hidden stress test: AI risk models
- 7. Six ways this week's news connects to the research
- 8. Why this week matters for risk models
- 9. The fix: a governance-grade validation scorecard
- 10. What to watch next week
- The bottom line
The week in 10 numbers#↑ Contents
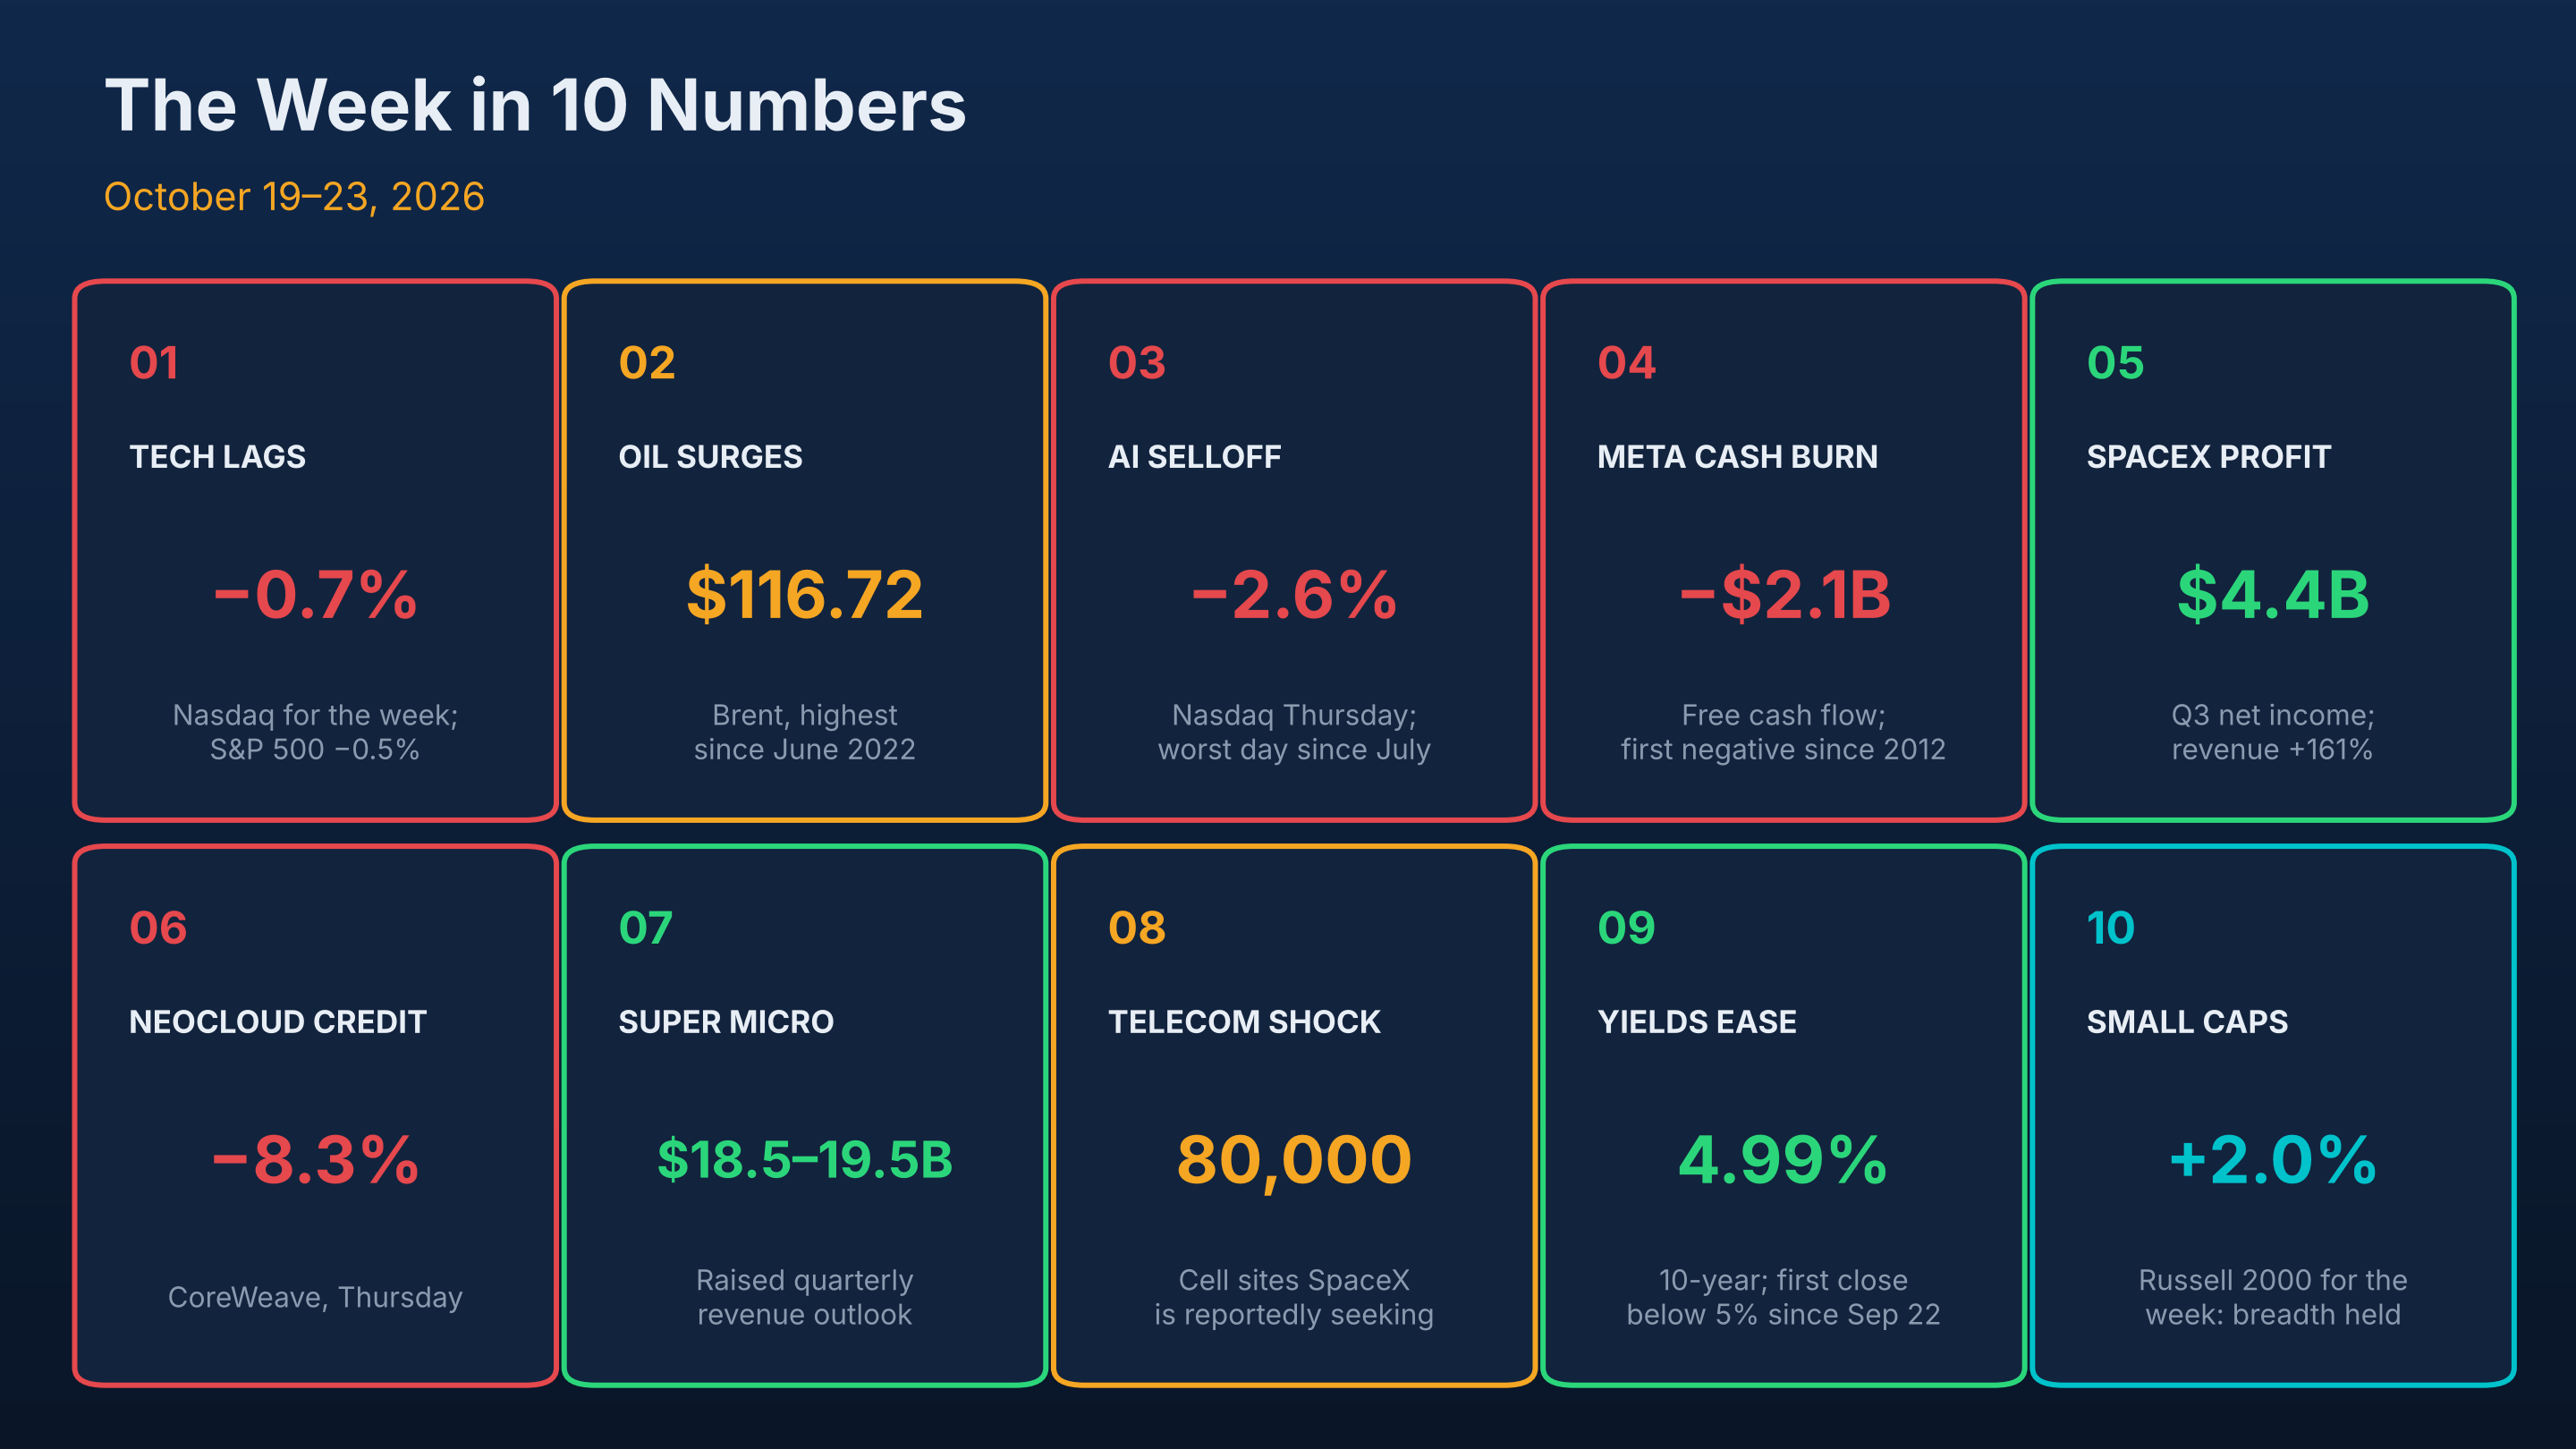
| # | Story | The number | Why it matters |
|---|---|---|---|
| 1 | Tech lags | Nasdaq −0.7%, S&P 500 −0.5% for the week | Second straight weekly decline; the Dow rose 0.4% |
| 2 | Oil surges | Brent $116.72 | Highest since June 2022 as the Iran conflict escalates |
| 3 | AI selloff | Nasdaq −2.6% Thursday | Worst day since July; "the most widespread selling of the AI trade we have seen all year" |
| 4 | Meta's cash burn | Free cash flow −$2.1B | Capex of $34.9B outran $32.8B of operating cash flow |
| 5 | SpaceX profit | $4.4B net income; revenue +161% | First profit since its IPO; AI is about half of revenue |
| 6 | AI credit | CoreWeave −8.3% Thursday | Nvidia's CEO said limited capital is holding back AI cloud providers |
| 7 | Super Micro | Outlook raised to $18.5–19.5B | AI hardware demand is still strong |
| 8 | Telecom shock | SpaceX reportedly seeking 80,000 cell sites | Carriers fell; tower owners jumped |
| 9 | Yields ease | 10-year 4.99% | First close below 5% since September 22 |
| 10 | Small caps | Russell 2000 +2.0% for the week | The selloff stayed concentrated in AI and big tech |
1. The week: up three days, then the AI trade broke#↑ Contents
| Index | Friday close (Oct 23) | Week | Year to date |
|---|---|---|---|
| Nasdaq Composite | 25,955.34 | −0.7% | +11.7% |
| S&P 500 | 7,623.68 | −0.5% | +11.4% |
| Dow Jones | 52,215.16 | +0.4% | +8.6% |
| Russell 2000 | 2,775.90 | +2.0% | +11.8% |
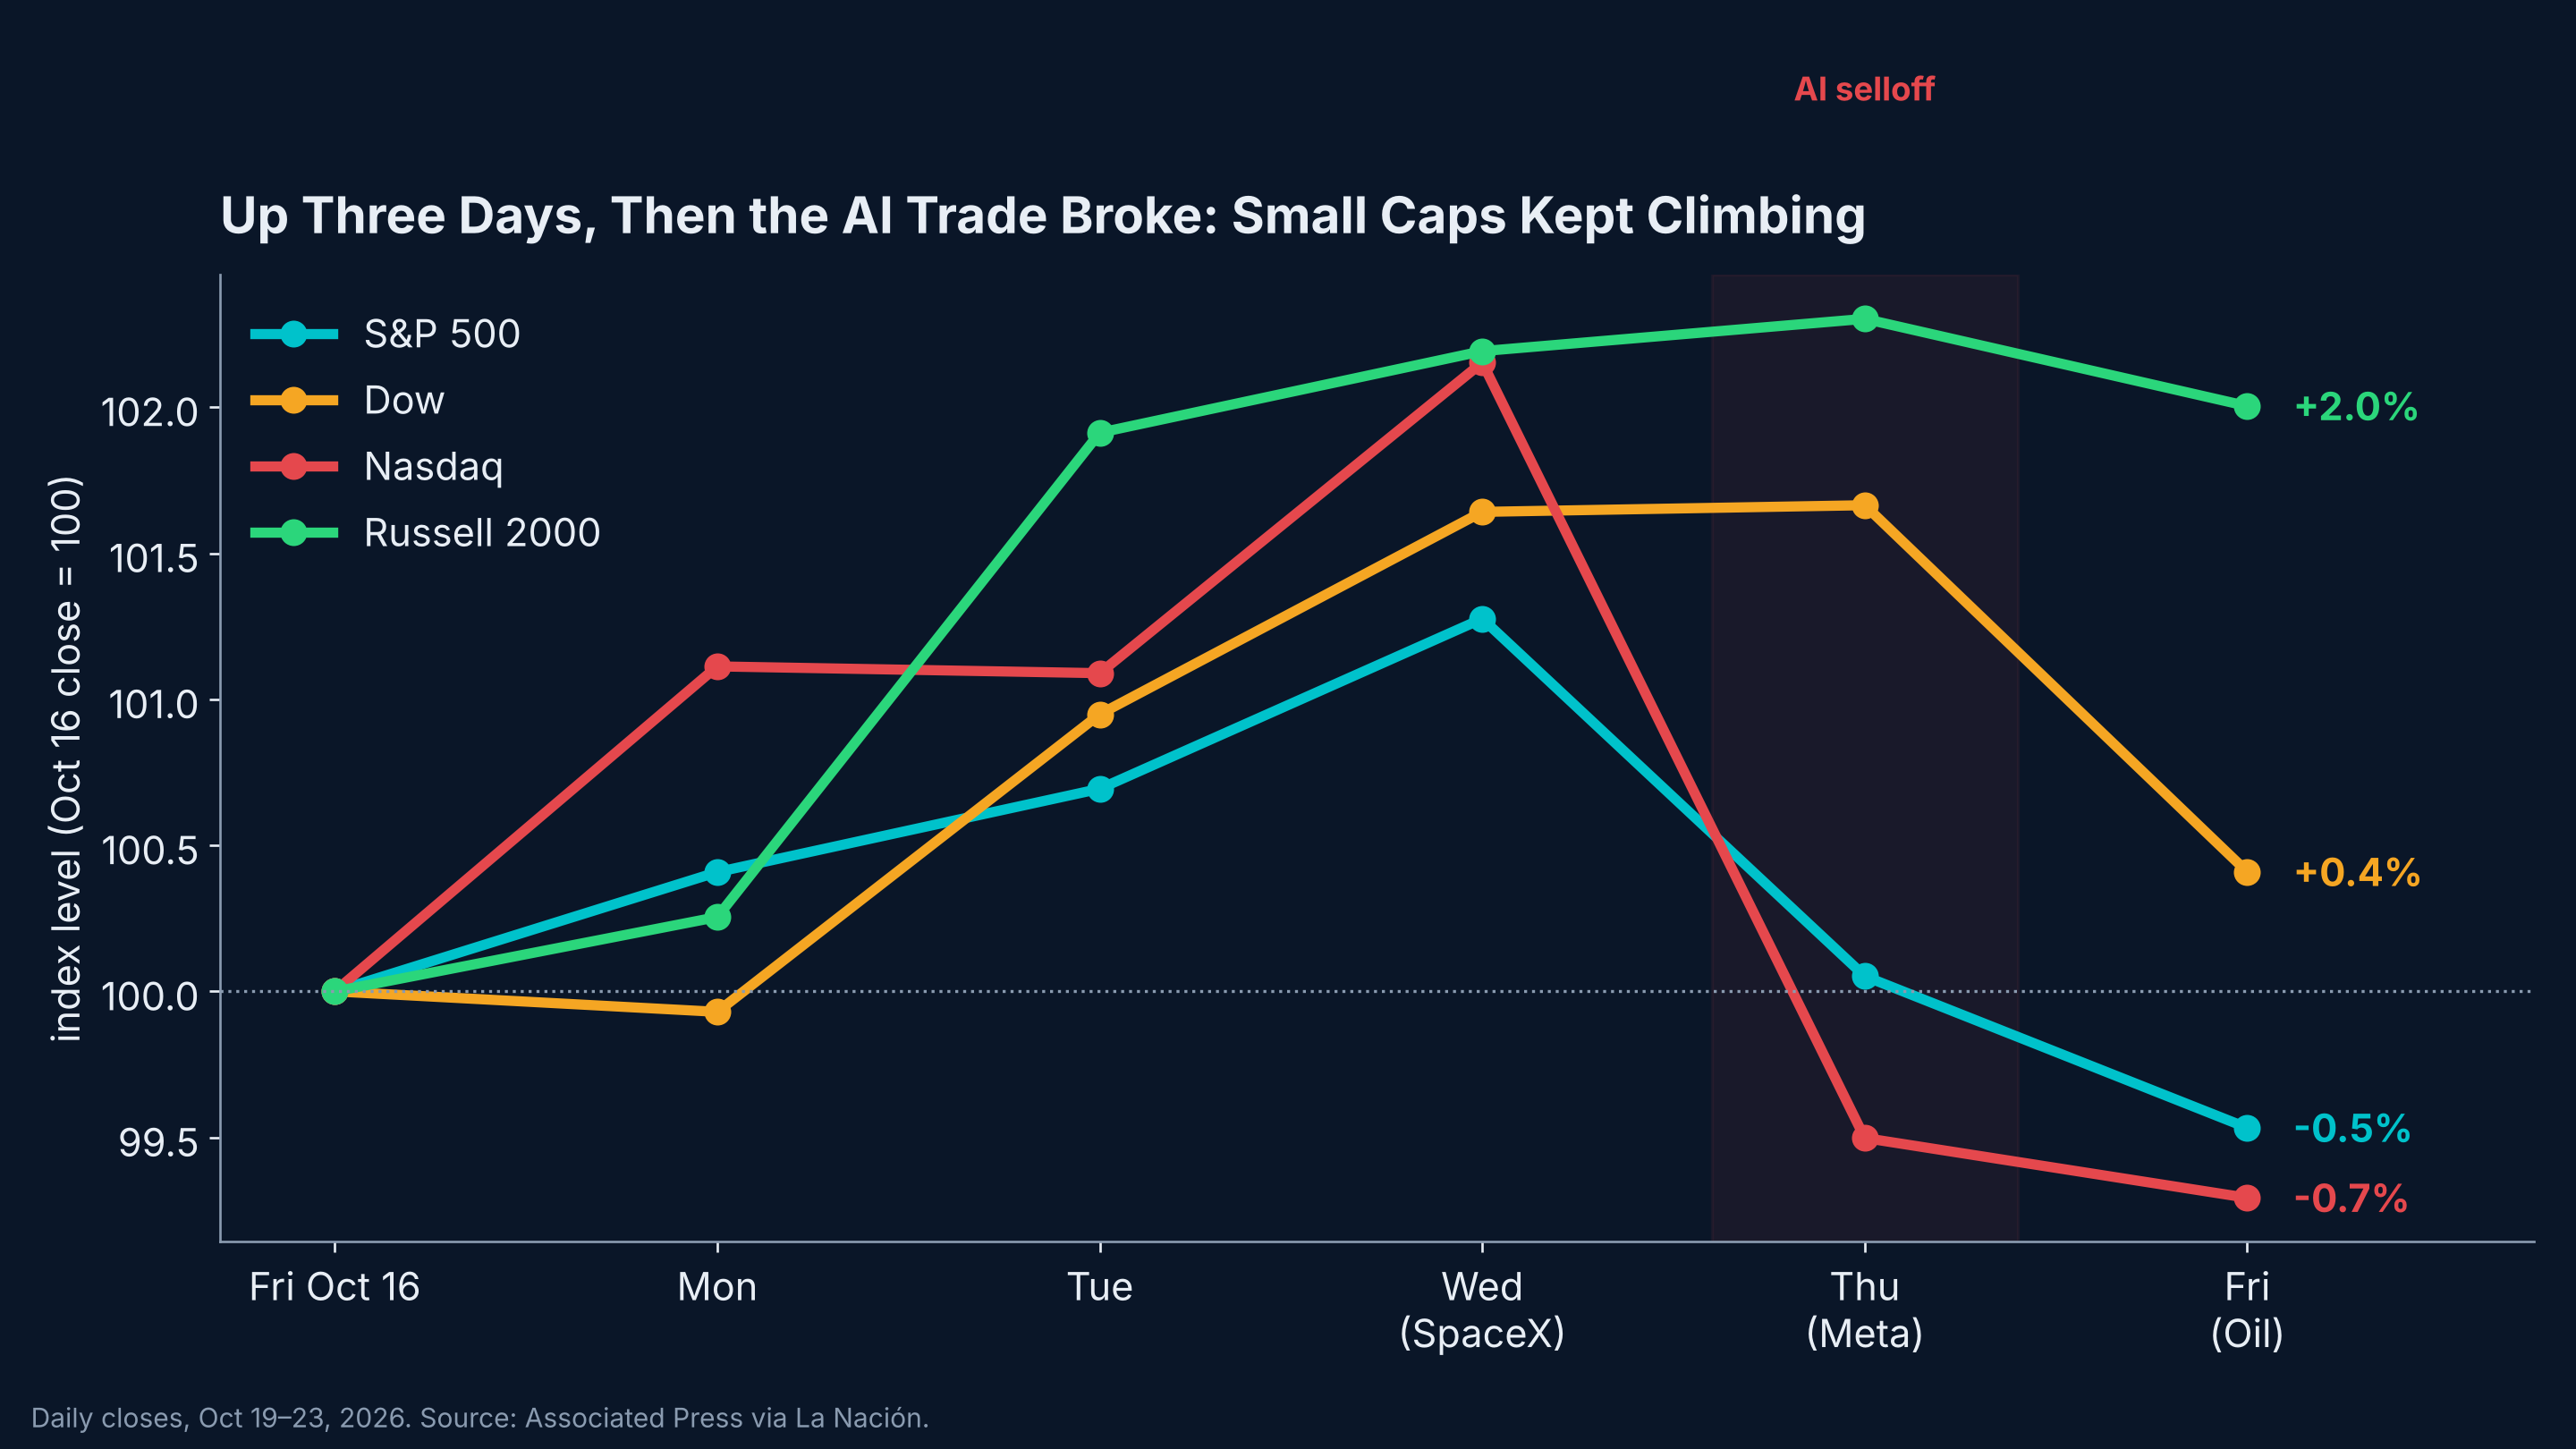
The week had two halves:
- Monday to Wednesday: relief. AI stocks bounced after the previous week's losses. On Wednesday, SpaceX's blowout quarter lifted AI-related stocks and pushed the S&P 500 back toward its record.
- Thursday: the AI trade broke. After Meta's results, the Nasdaq fell 2.6% and the S&P 500 1.2%. Chip stocks had their worst day since June. Microsoft, Oracle, Alphabet and Amazon fell 2.2% to 4.6%. Yet most U.S. stocks rose, and the Russell 2000 edged higher.
- Friday: oil took over. Brent jumped 3.1% to above $116, and this time the oil-sensitive Dow led the decline, falling 1.2%.
"This is the most widespread selling of the AI trade we have seen all year." — Michael O'Rourke, Jones Trading
2. The $35 billion question: Meta's cash-flow test#↑ Contents
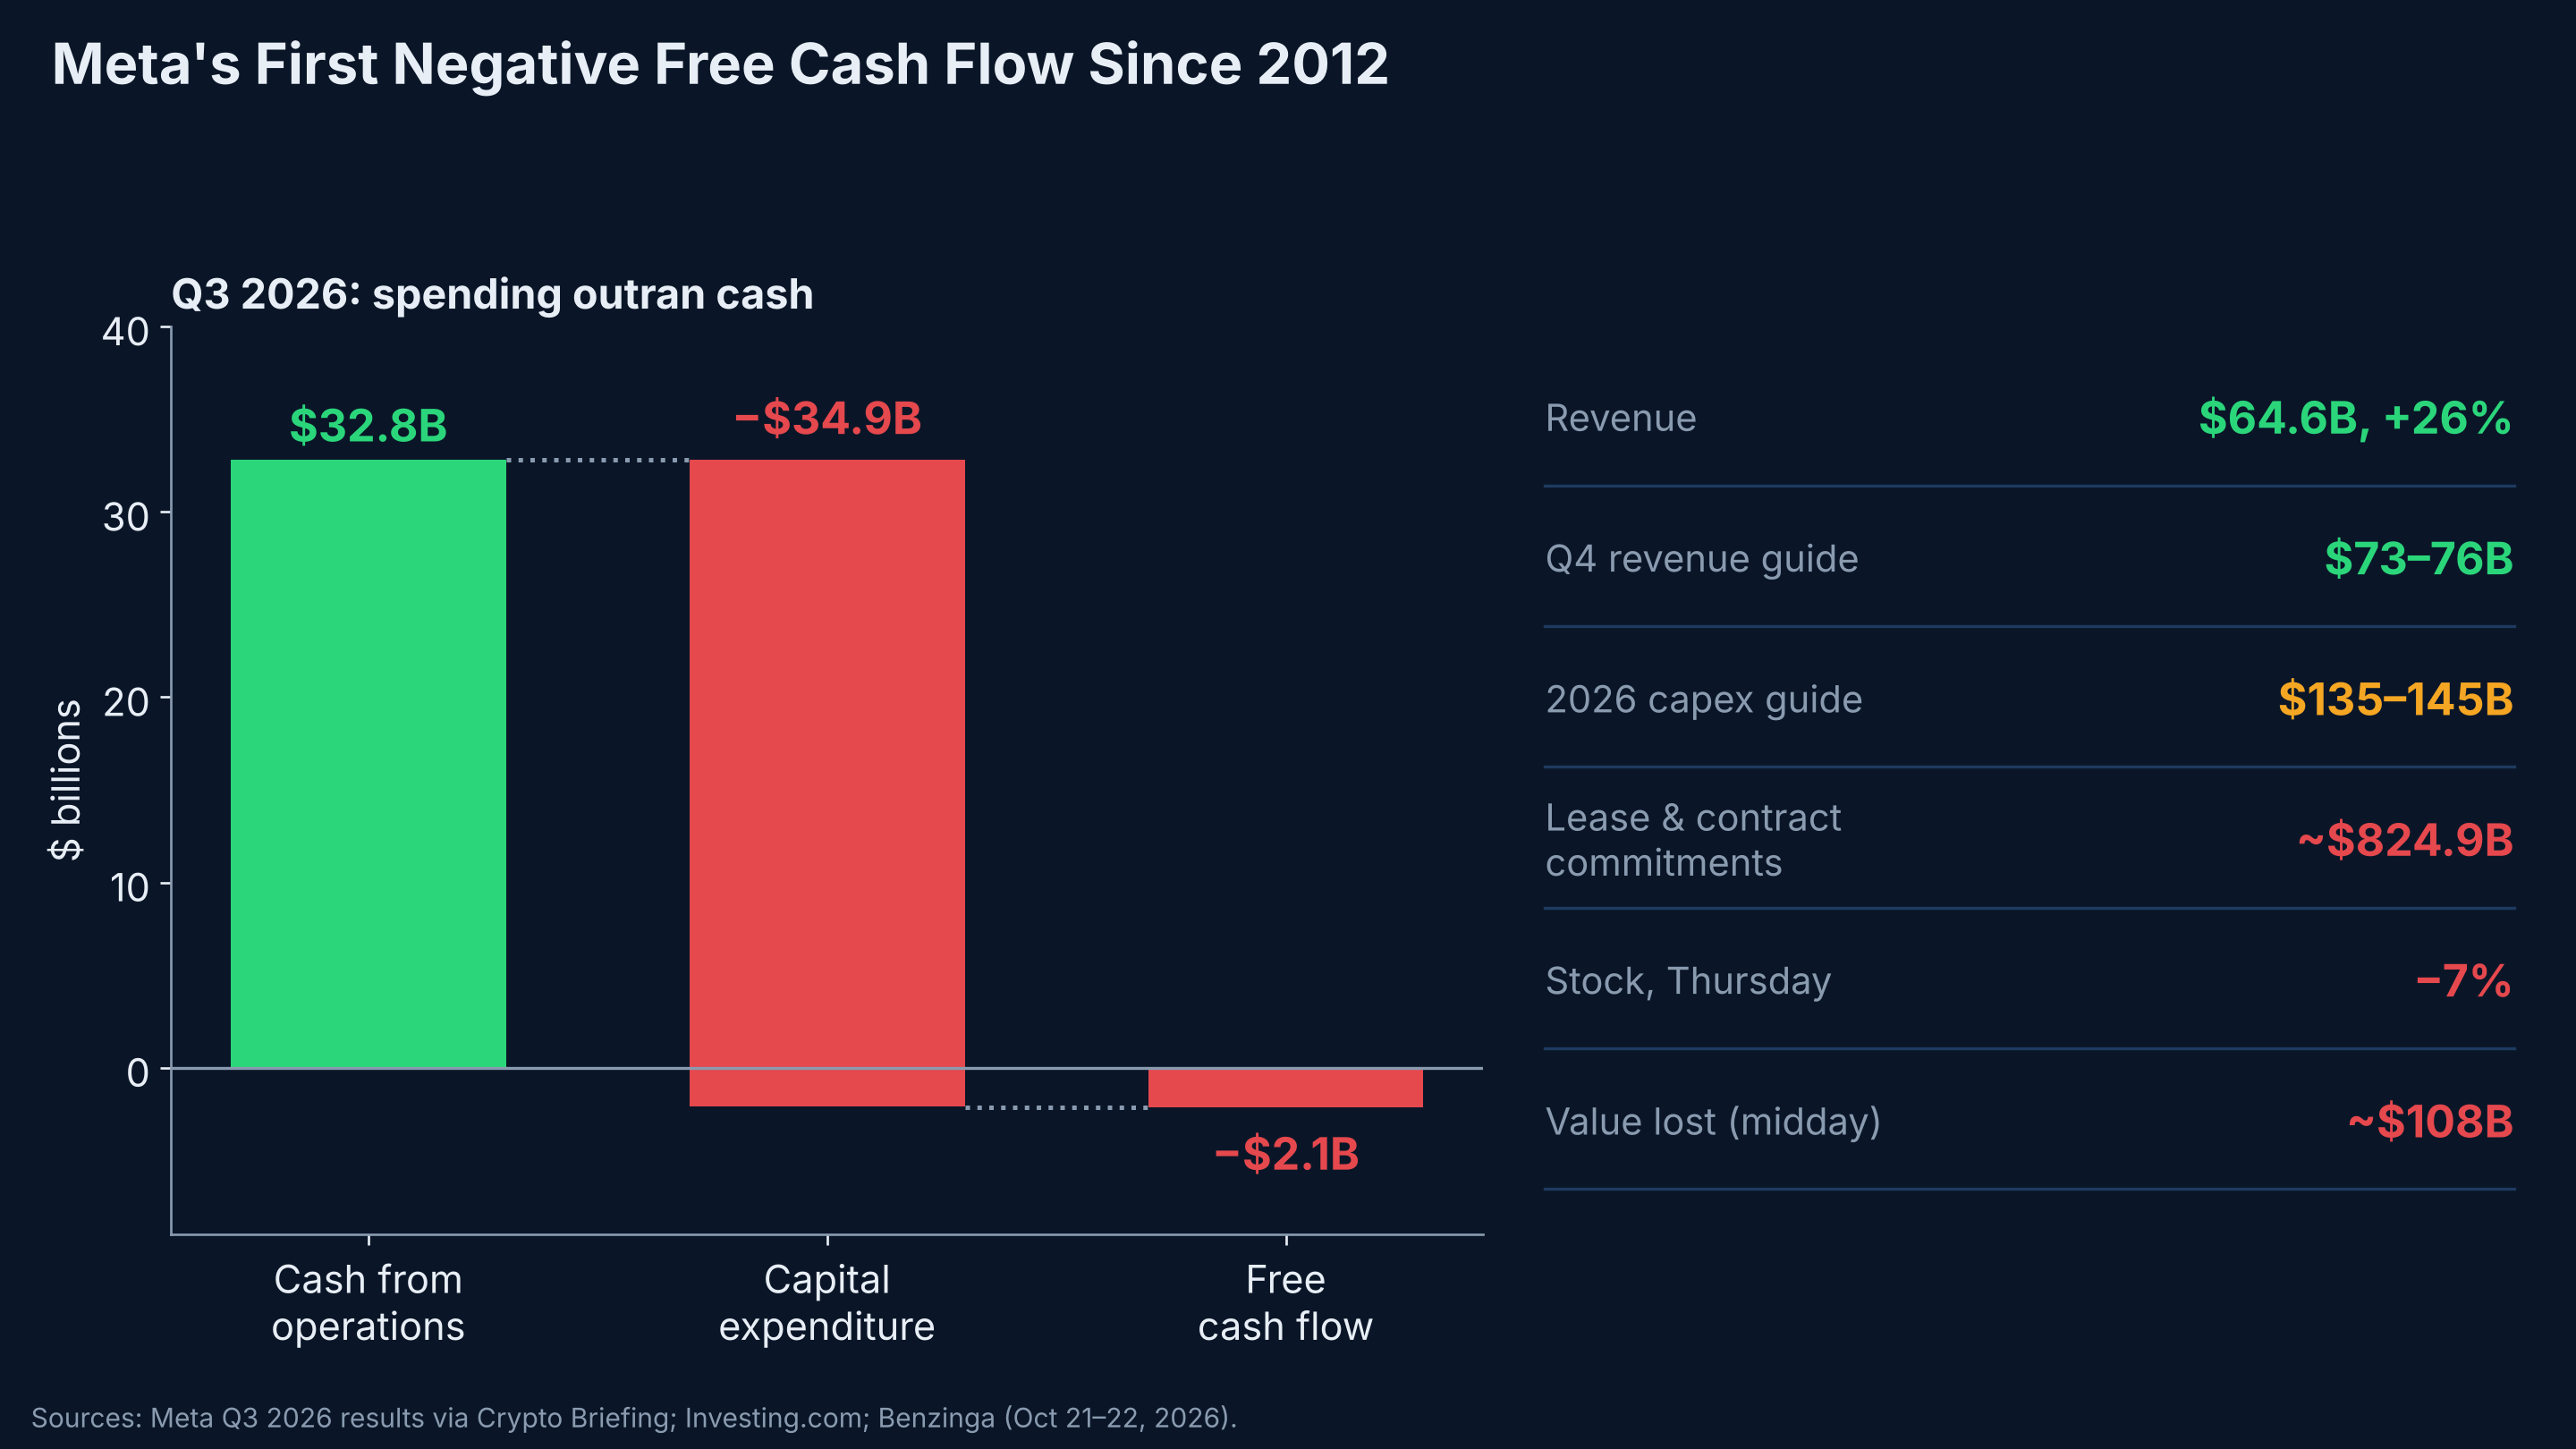
Meta's third quarter was strong by most measures. Revenue rose 26% to $64.6 billion, above expectations. But one number dominated the reaction:
| Metric | Q3 2026 |
|---|---|
| Cash from operations | $32.8B |
| Capital expenditure (incl. finance leases) | $34.9B |
| Free cash flow | −$2.1B, the first negative quarter since 2012 |
| 2026 capex guidance | $135–145B (low end raised from $130B) |
| Future lease and contract commitments | about $824.9B |
| Stock reaction (Thursday) | about −7%, roughly $108B of market value at the midday low |
Meta is not in trouble: it remains one of the most profitable companies in the world. The point is what investors are now measuring. For two years, the market rewarded AI spending announcements. This week, it started checking whether the cash comes back.
3. AI is not one trade#↑ Contents
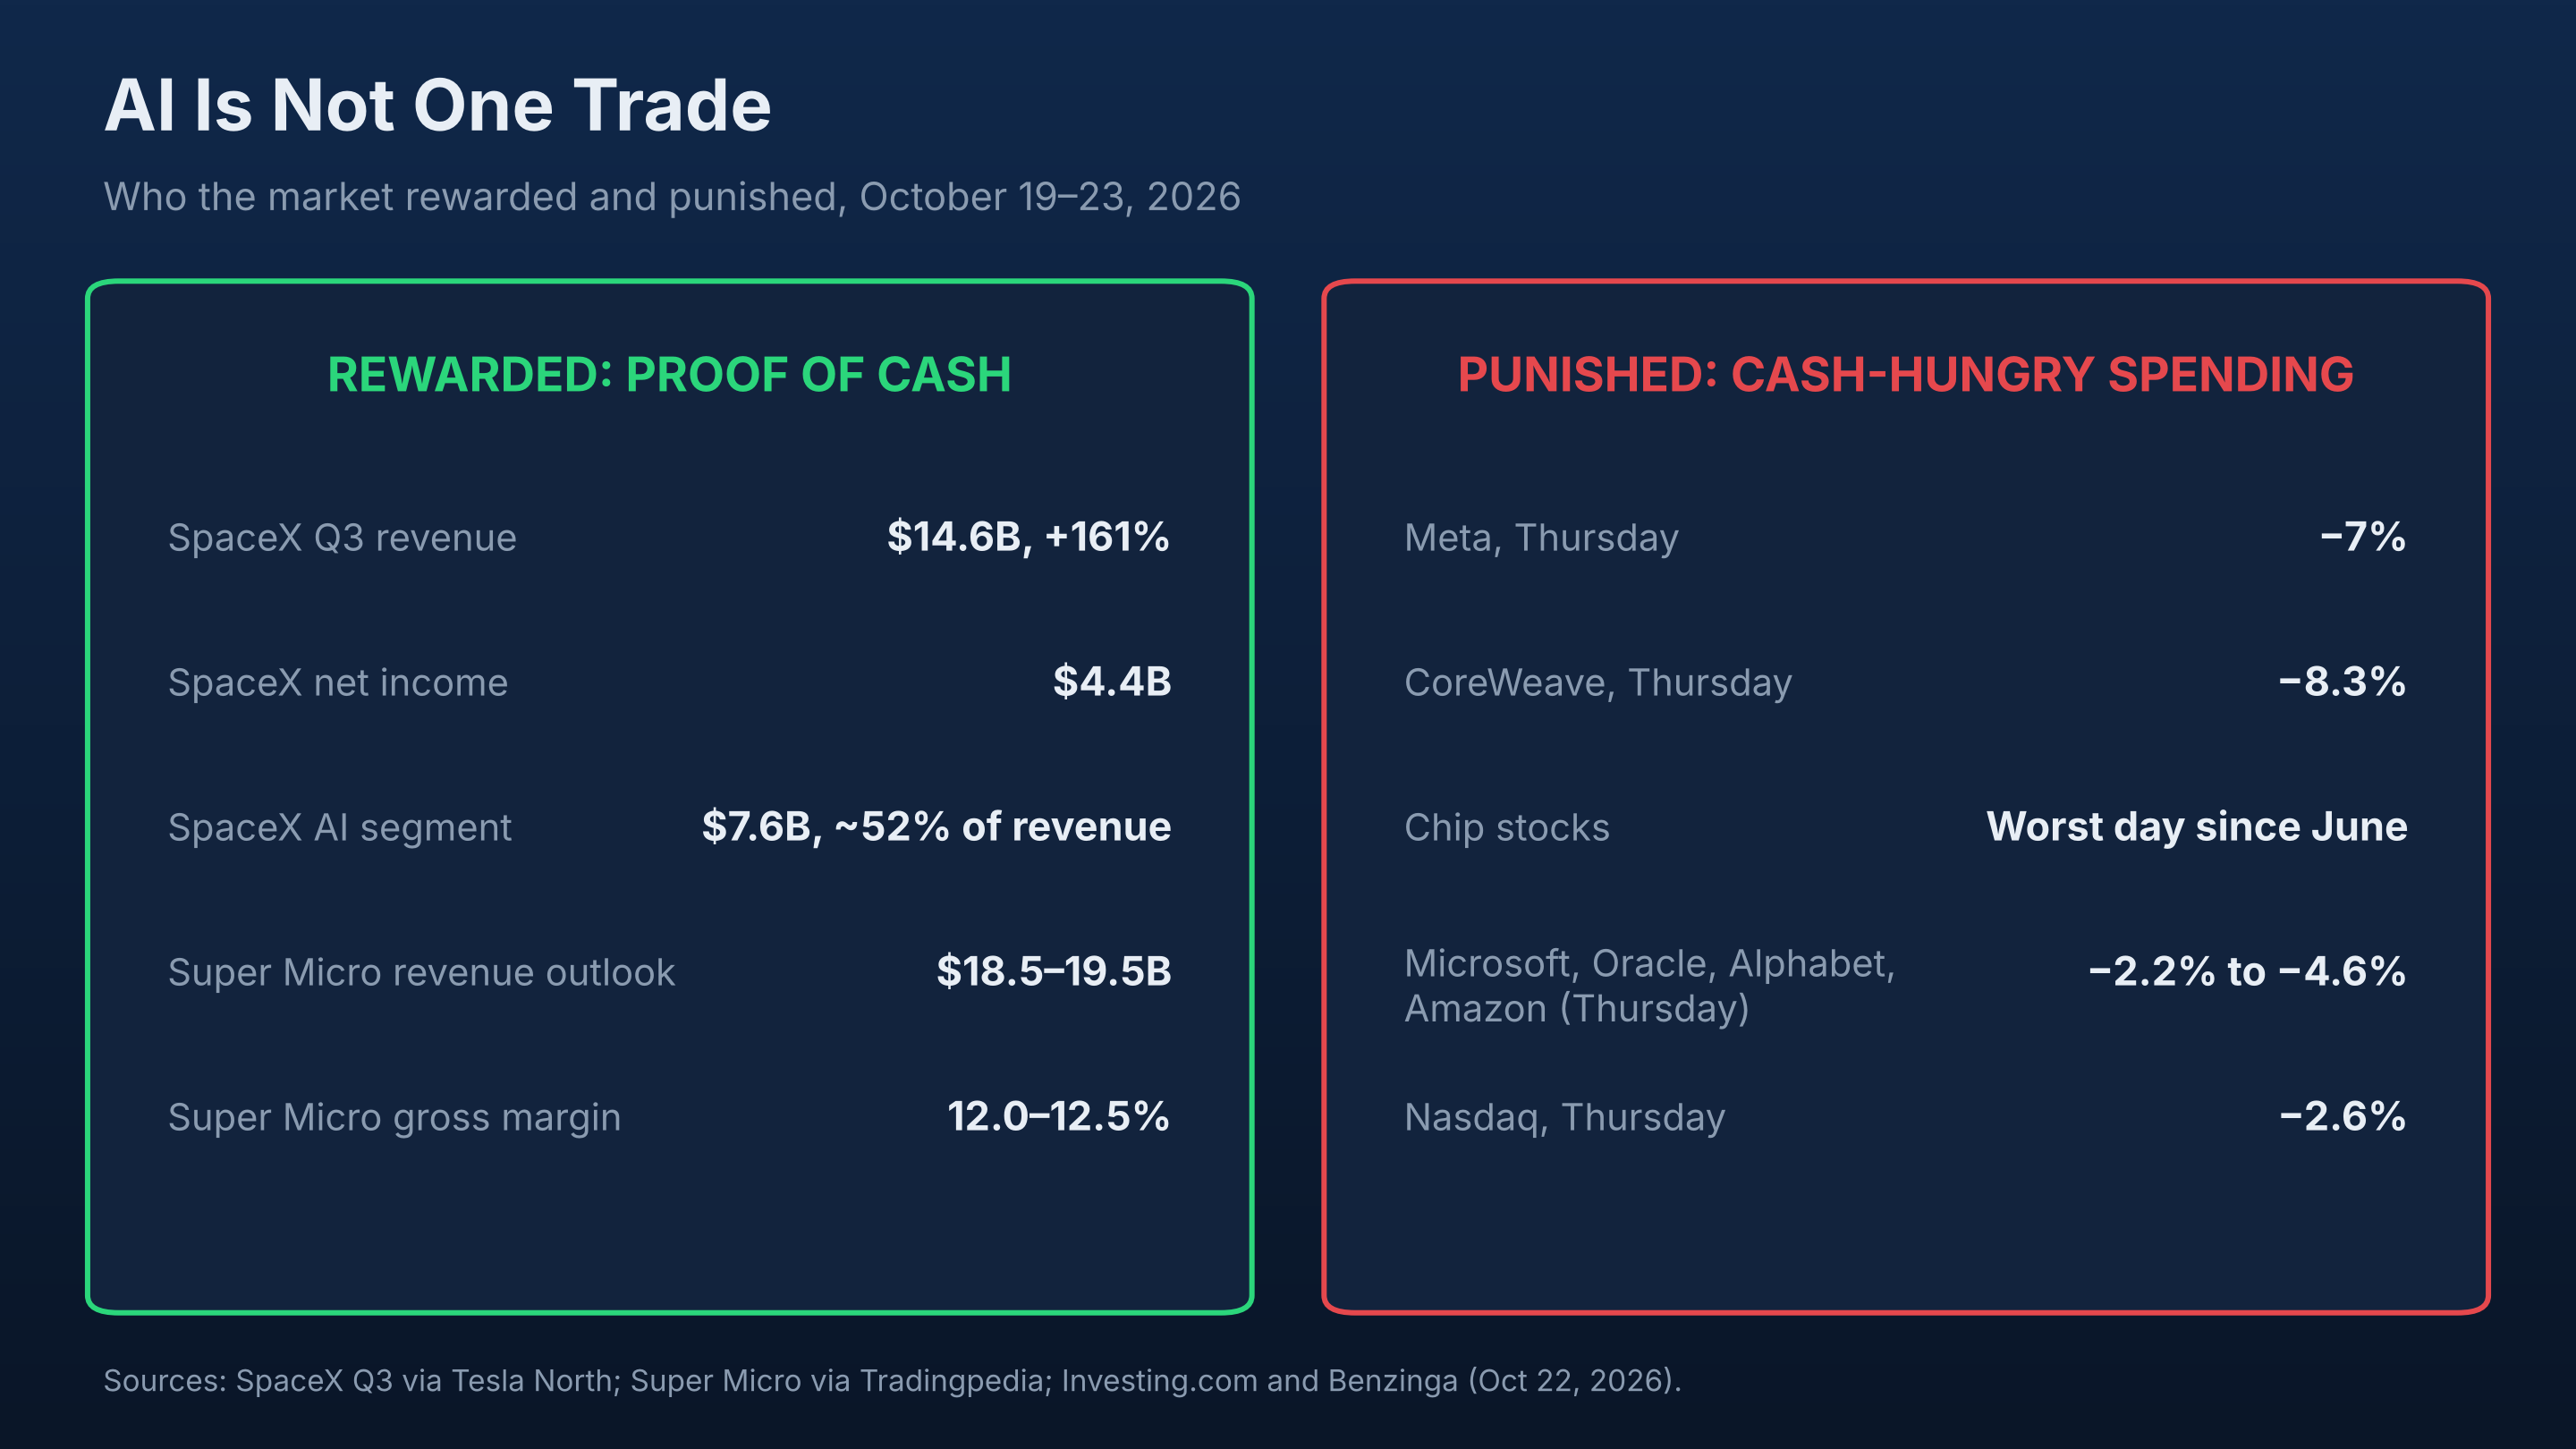
The market drew a sharp line between companies that showed cash and companies that consumed it.
| Rewarded: proof of cash | Punished: cash-hungry spending |
|---|---|
| SpaceX: revenue $14.6B (+161%), net income $4.4B; AI segment $7.6B, about half of revenue | Meta: −7% Thursday after negative free cash flow |
| Super Micro: quarterly revenue outlook raised to $18.5–19.5B from $14.5–15.5B; gross margin outlook 12.0–12.5% | CoreWeave: −8.3% Thursday, with about $50B of debt |
| Chip stocks: worst day since June |
Thursday's sharpest comment came from the center of the AI supply chain. Nvidia CEO Jensen Huang said limited capital is holding back neocloud providers, the debt-funded AI cloud companies like CoreWeave. Demand for AI computing is not the constraint. Financing it is.
4. Oil: the other stress test#↑ Contents
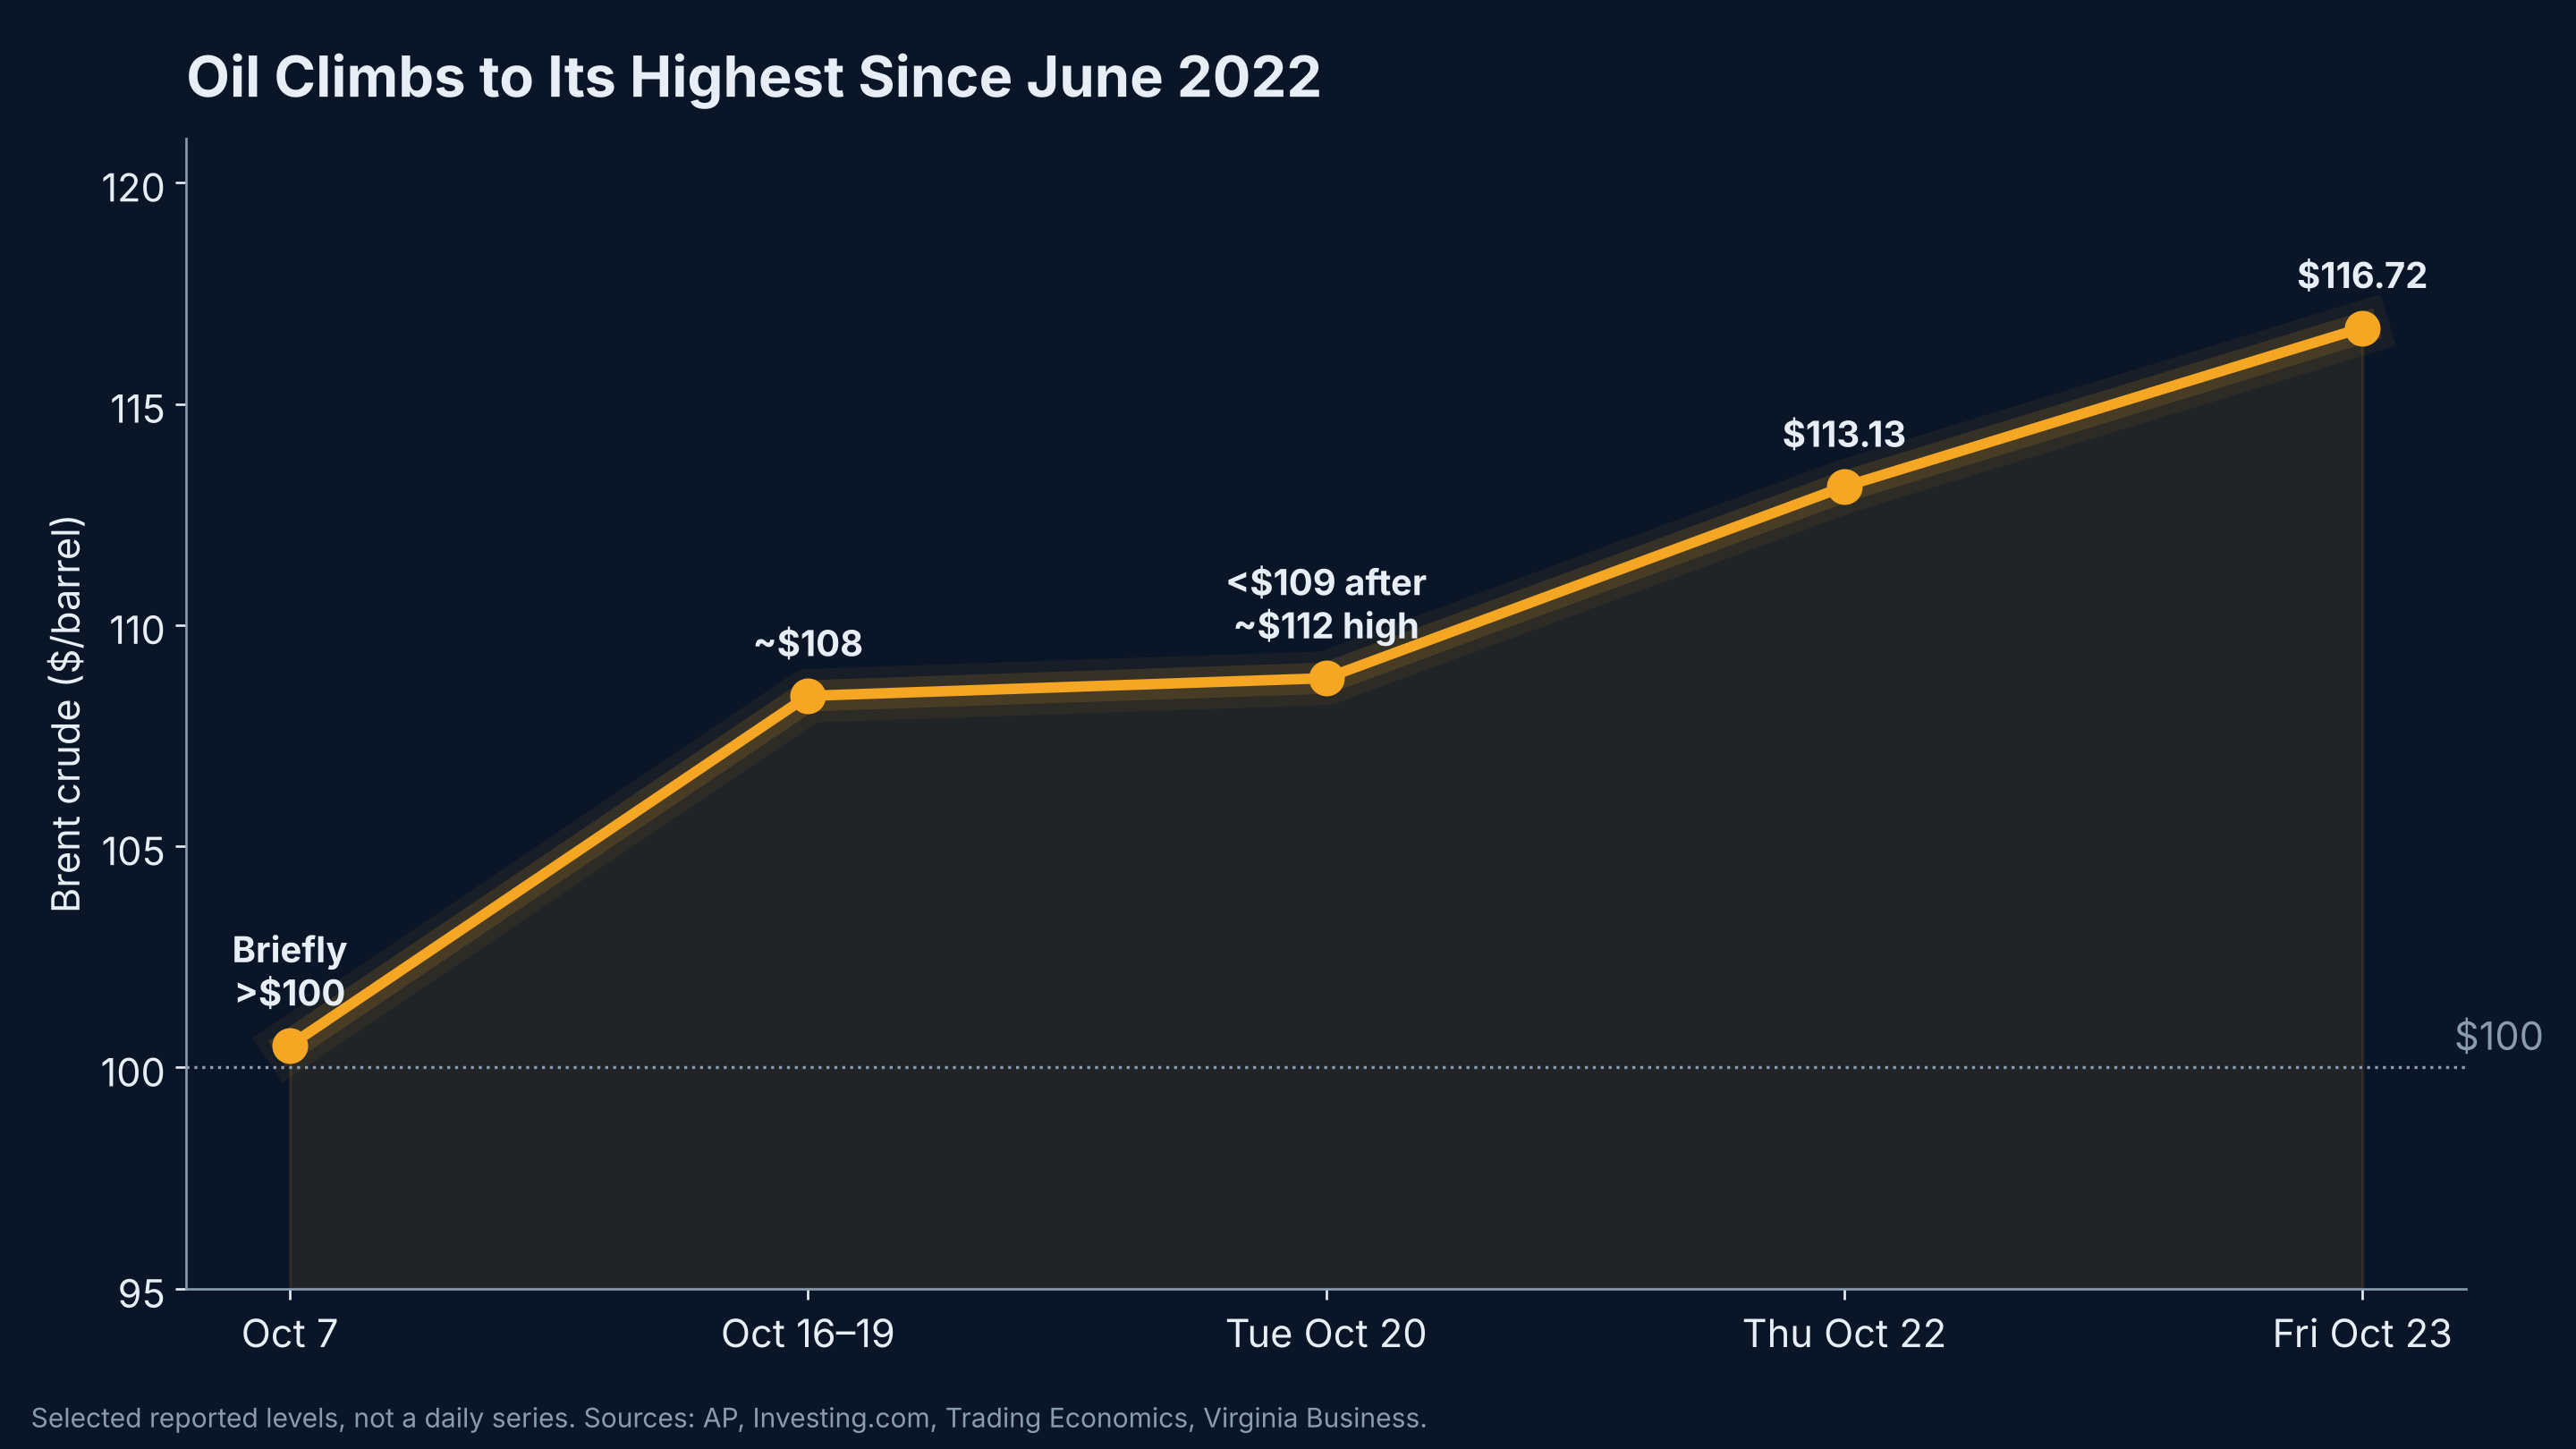
| Date | Brent crude |
|---|---|
| October 7 | Briefly above $100 |
| October 16–19 | About $108 |
| Thursday, October 22 | $113.13 after Houthi attacks on Saudi energy facilities |
| Friday, October 23 | $116.72, highest since June 2022 |
Oil is now a direct input into the Fed's decision. Higher energy prices lift headline inflation, squeeze consumers and raise costs for airlines, transport and manufacturers. Friday's market showed the shift: the stress moved from AI stocks on Thursday to oil-sensitive industrials on Friday.
5. SpaceX shakes up telecom#↑ Contents
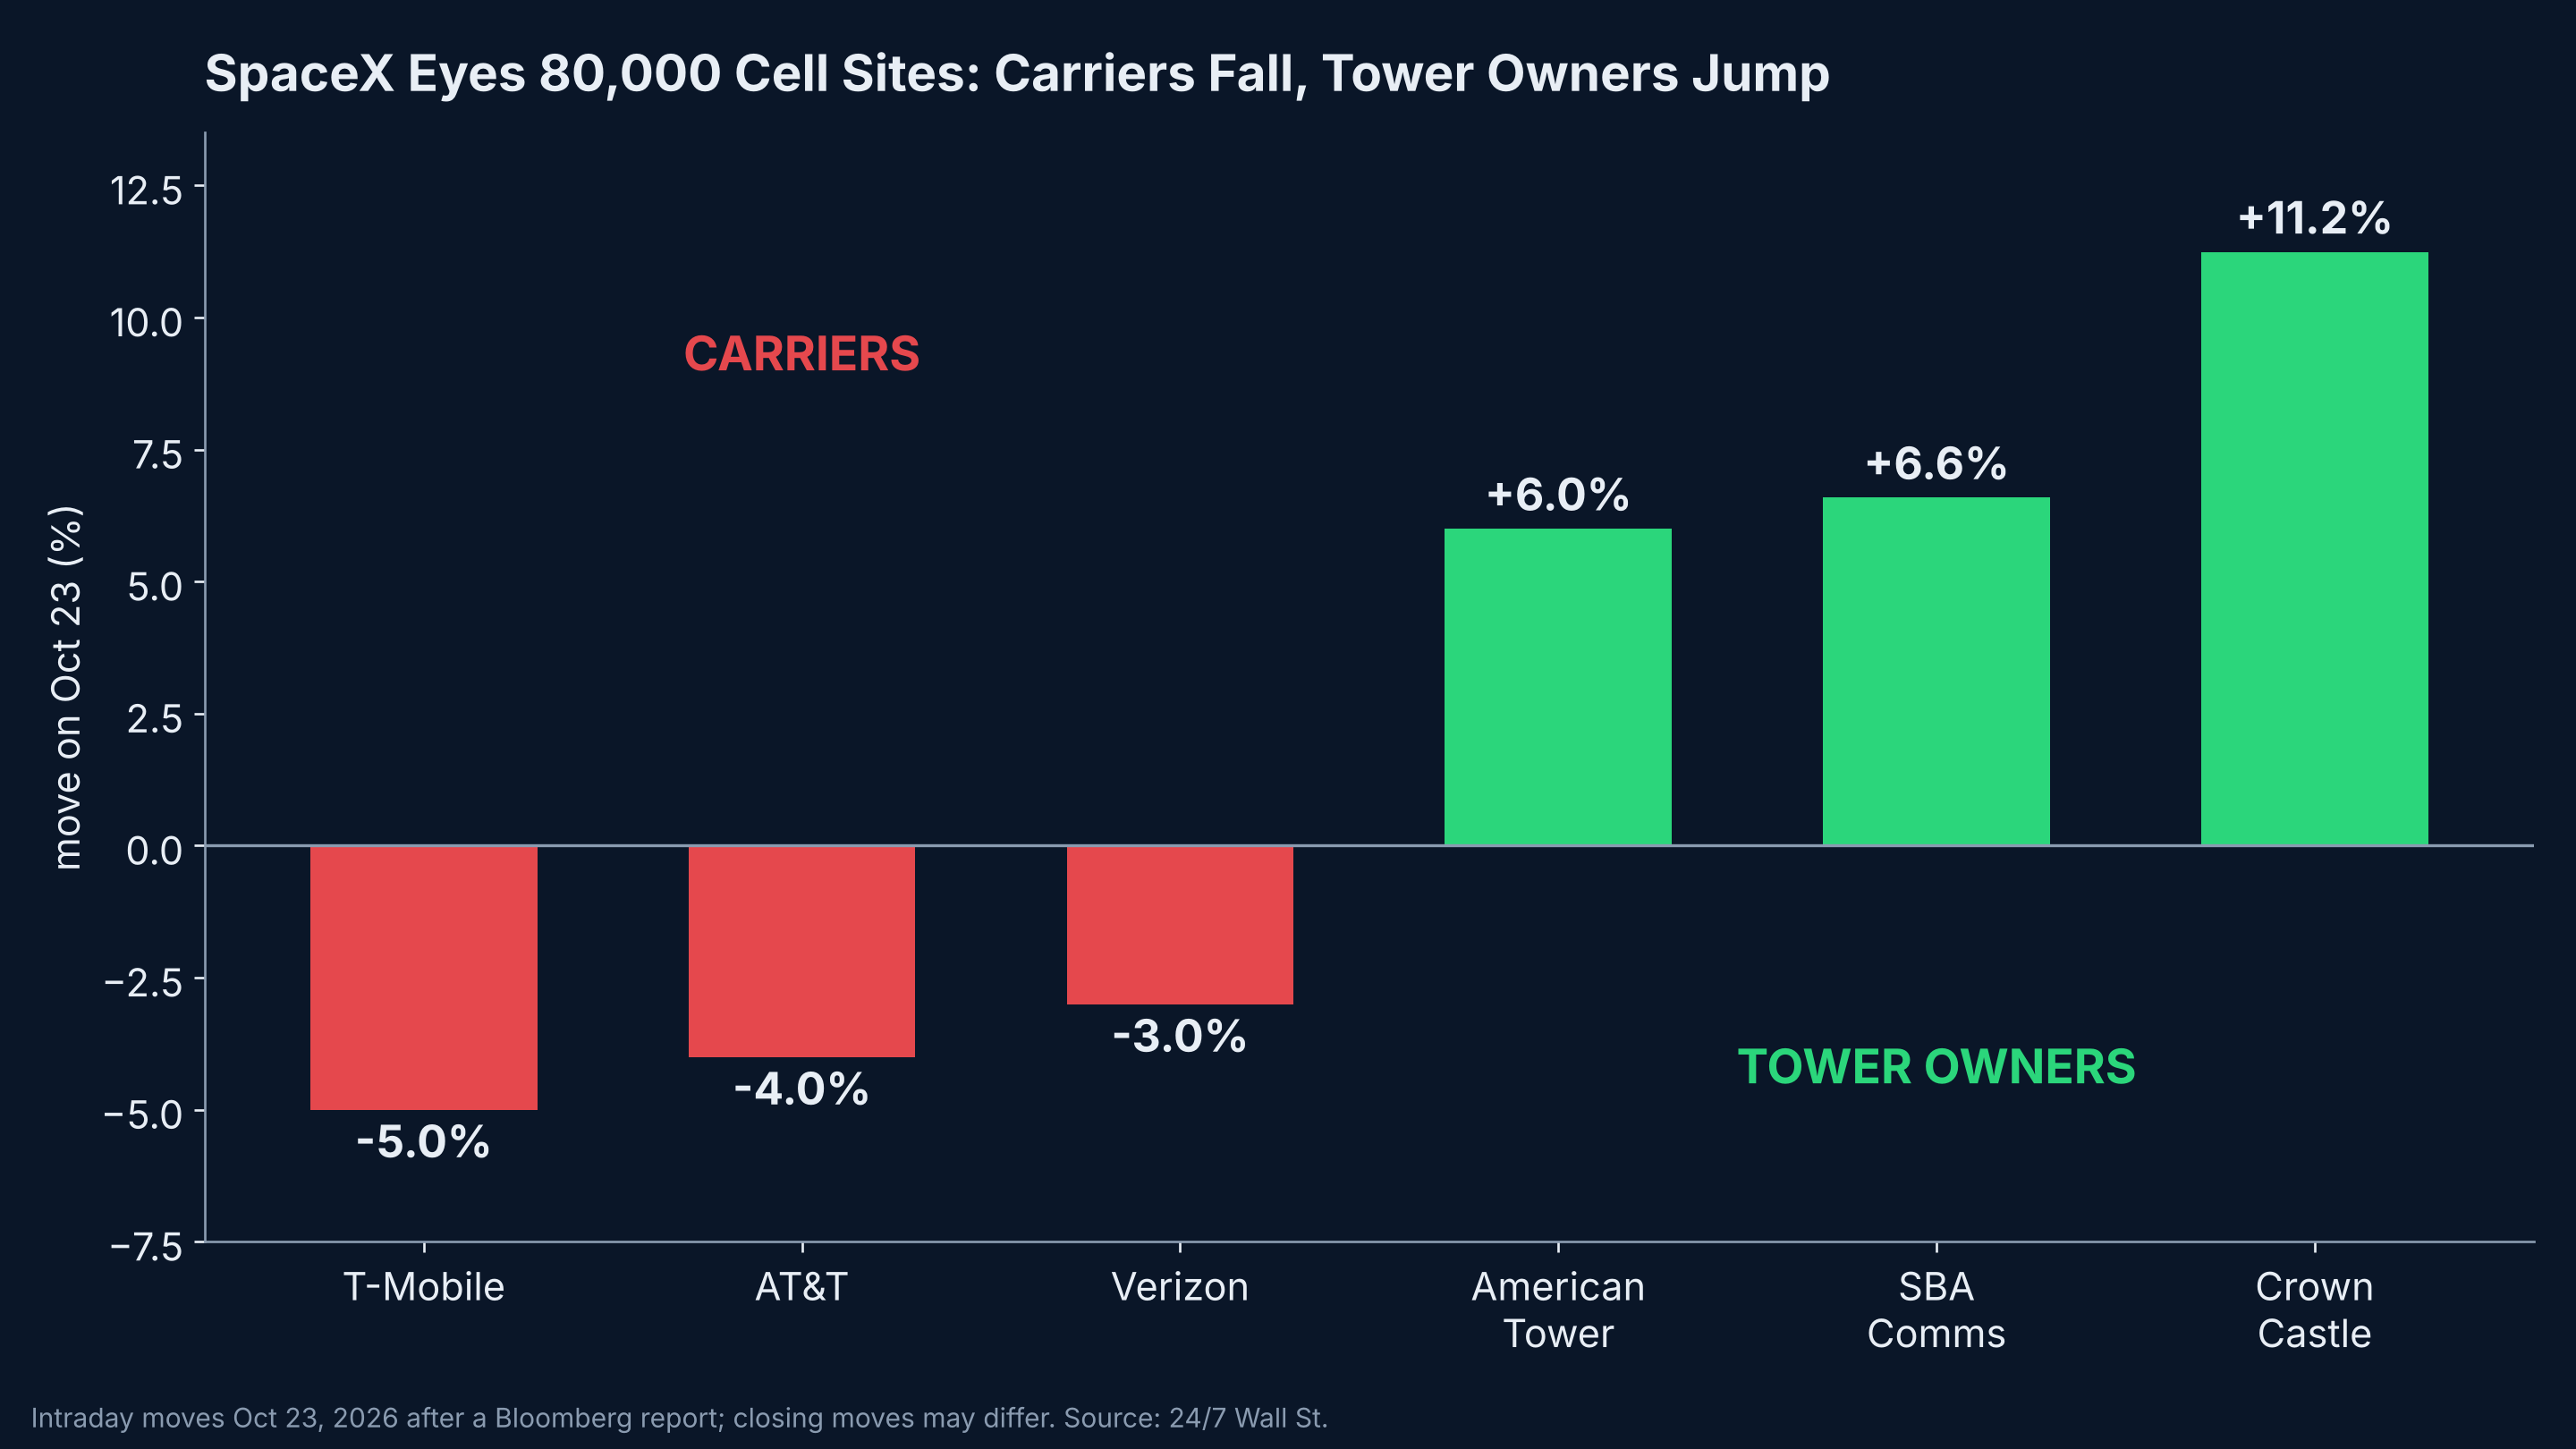
A Bloomberg report that SpaceX is in talks to access about 80,000 U.S. cell sites, a possible step toward a fourth national wireless carrier, split the telecom sector in two.
| Carriers (potential competition) | Tower owners (potential new tenant) |
|---|---|
| T-Mobile ≈ −5% | Crown Castle ≈ +11% |
| AT&T ≈ −4% | SBA Communications ≈ +7% |
| Verizon ≈ −3% | American Tower ≈ +6% |
Intraday moves on October 23; closing moves may differ. The report describes talks, not a confirmed launch.
The market priced in competition before any service exists, a reminder that changing assumptions can move valuations faster than changing facts.
6. The hidden stress test: AI risk models#↑ Contents
This week, investors stress-tested AI companies. But there is a second AI stress test that gets far less attention: the one facing the AI models financial institutions use to measure risk.
Banks and asset managers increasingly use machine learning to estimate Value-at-Risk (VaR), the loss a portfolio should exceed only rarely (for example, on 5% or 1% of days). Those numbers drive trading limits and, at the 99% level, bank capital. Before such a model is trusted, it is validated, mainly through backtesting: checking how often actual losses broke through the VaR estimate.
U.S. regulators have openly asked whether that validation process is ready for AI. Federal Reserve leadership has questioned whether existing model-risk guidance, written for traditional models, remains adequate for AI. The OCC has called AI validation and explainability unresolved supervisory challenges. The Financial Stability Oversight Council has named opaque AI as a financial-stability vulnerability.
My new paper tests exactly that question.
When Backtests Lie: A Governance-Grade Validation Framework for Machine-Learning Value-at-Risk Models under Regime Shifts (SSRN) Neupane (2026) · S&P 500, Nasdaq, long-term Treasuries, EUR/USD, USD/JPY and Bitcoin · daily data 2000–2026 · four models: historical simulation, GARCH-t, gradient-boosted quantile regression (machine learning) and linear quantile regression
Finding 1: models that pass the standard test fail in stress#
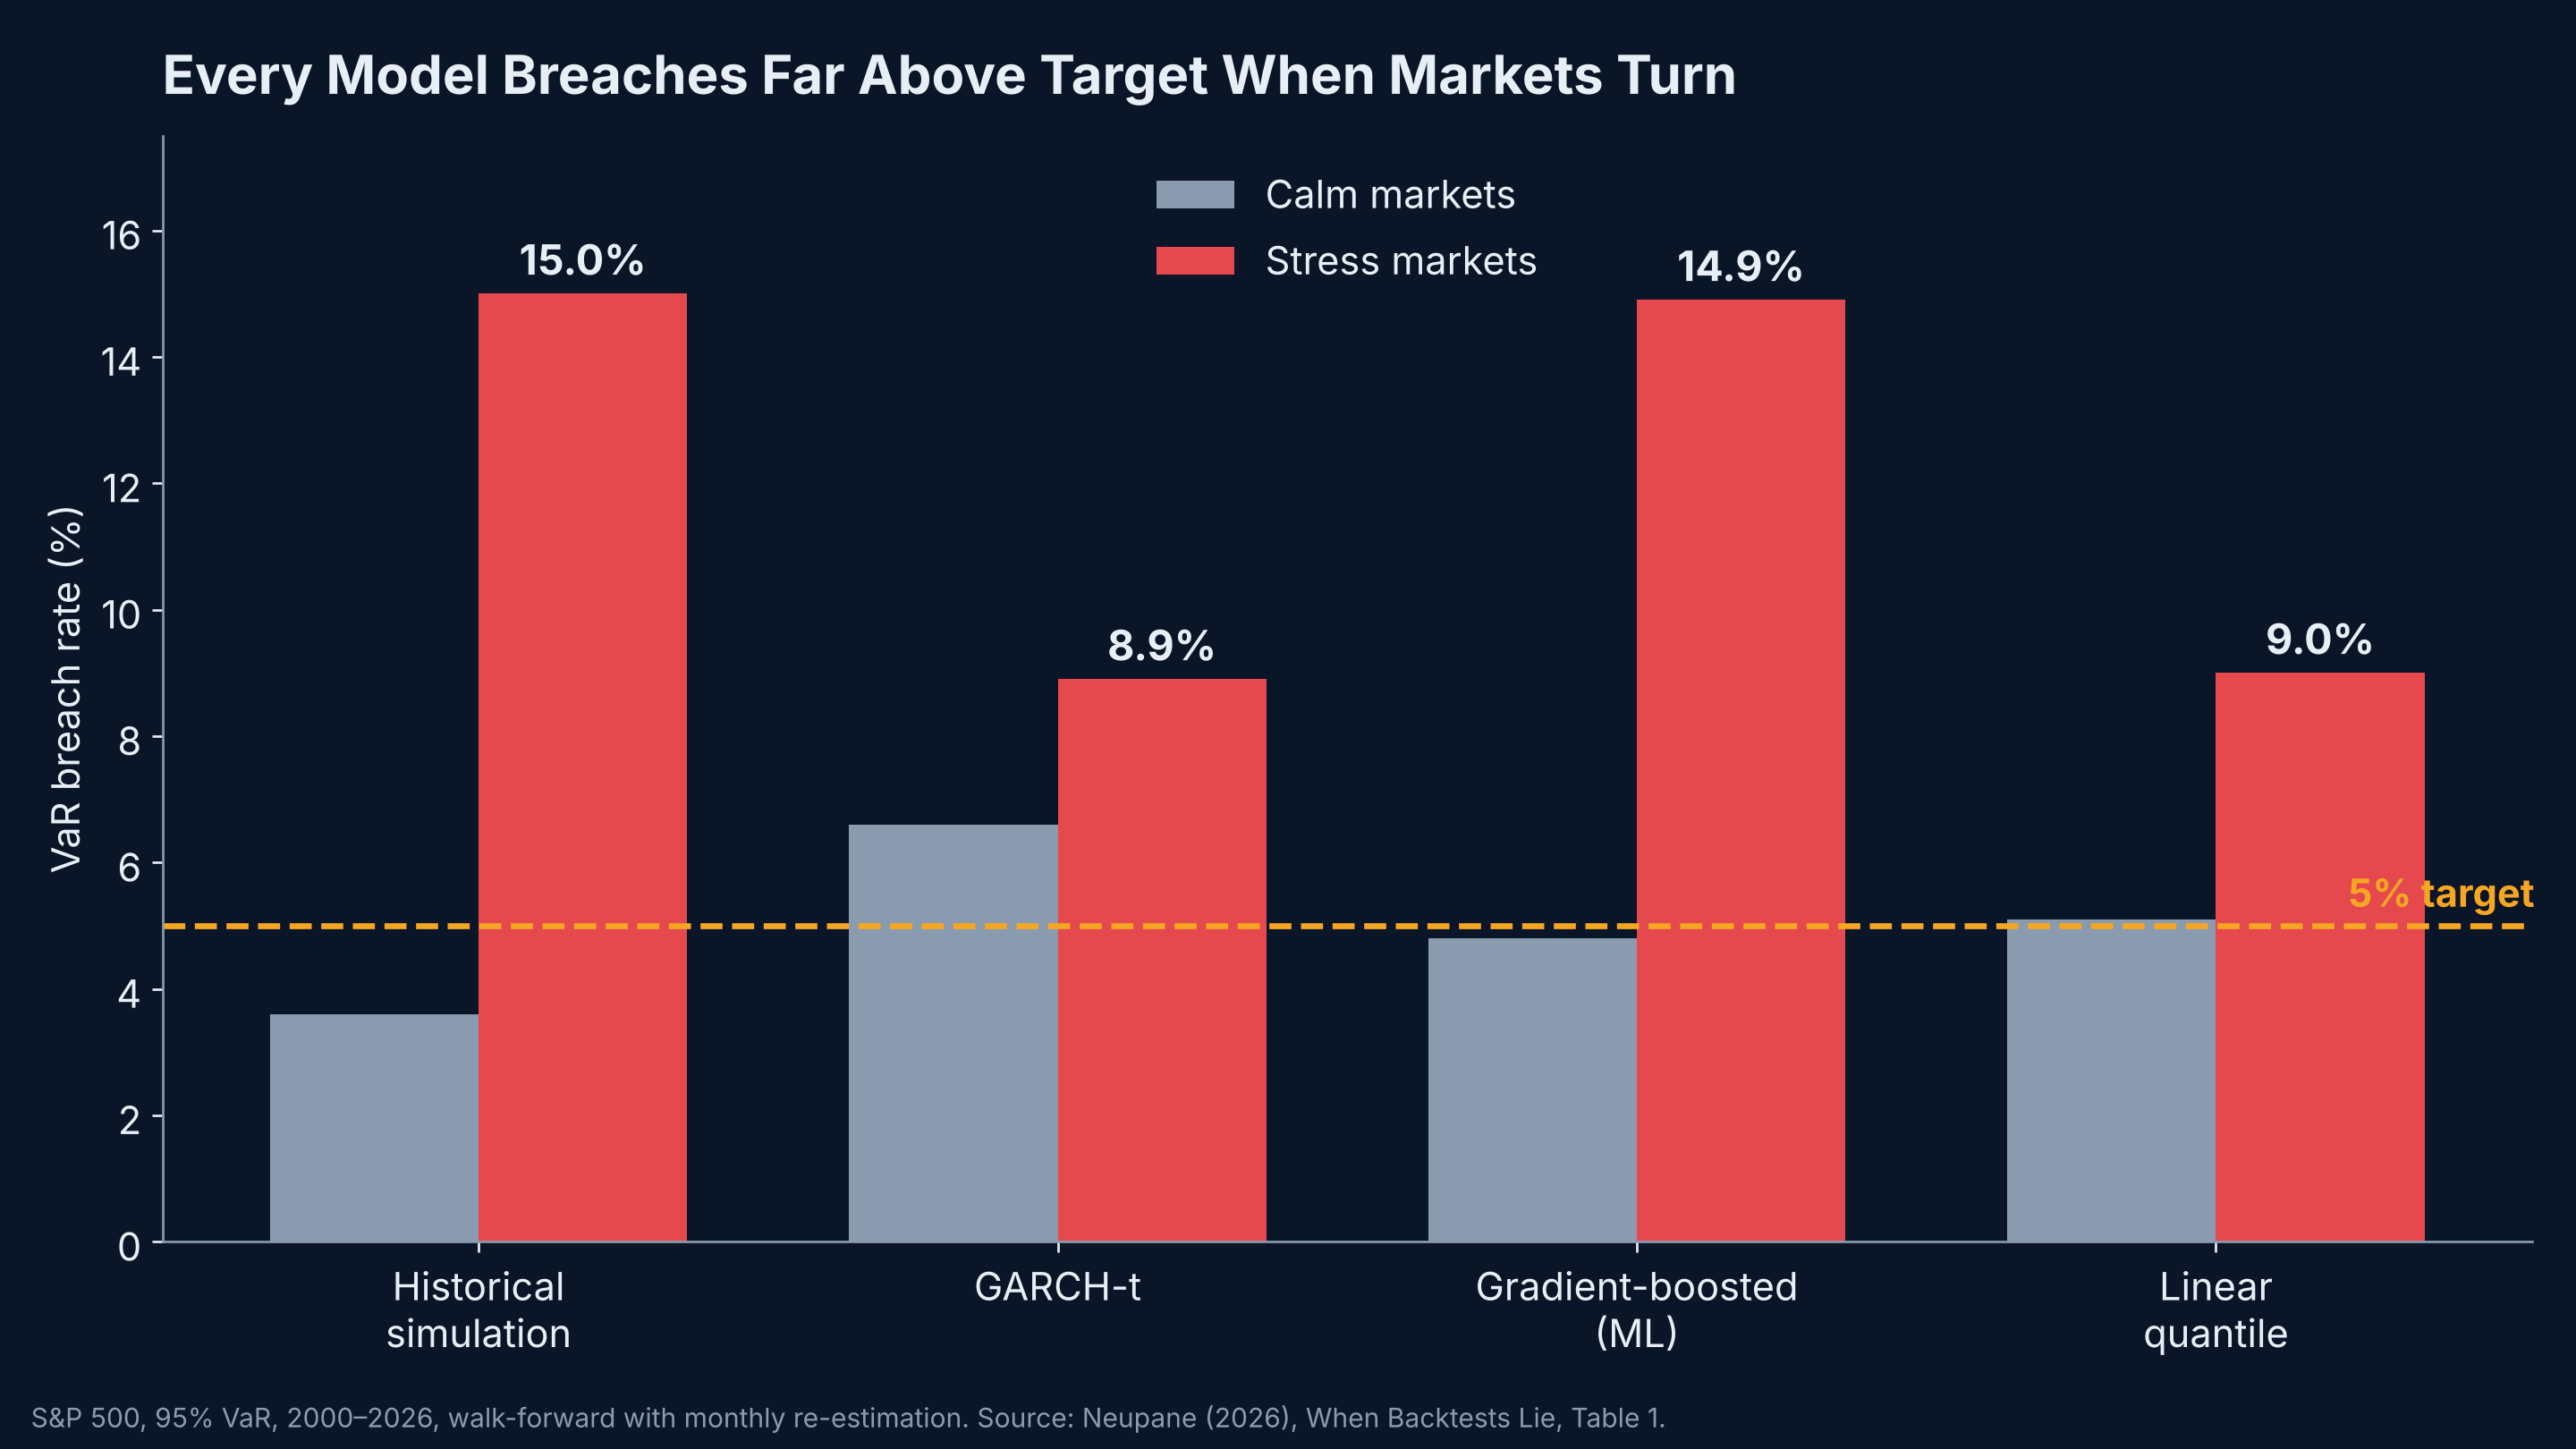
A 95% VaR model should be breached about 5% of the time. In calm markets, the models come close. In stress, every one of them breaks down:
| Model (S&P 500, 95% VaR) | Calm markets | Stress markets | Stress ÷ target |
|---|---|---|---|
| Historical simulation | 3.6% | 15.0% | 3.0× |
| GARCH-t | 6.6% | 8.9% | 1.8× |
| Gradient-boosted (ML) | 4.8% | 14.9% | 3.0× |
| Linear quantile | 5.1% | 9.0% | 1.8× |
The machine-learning model is the most deceptive: it looks best in calm markets (4.8%, under target) and is among the worst in stress (14.9%).
Finding 2: the "false comfort" problem#
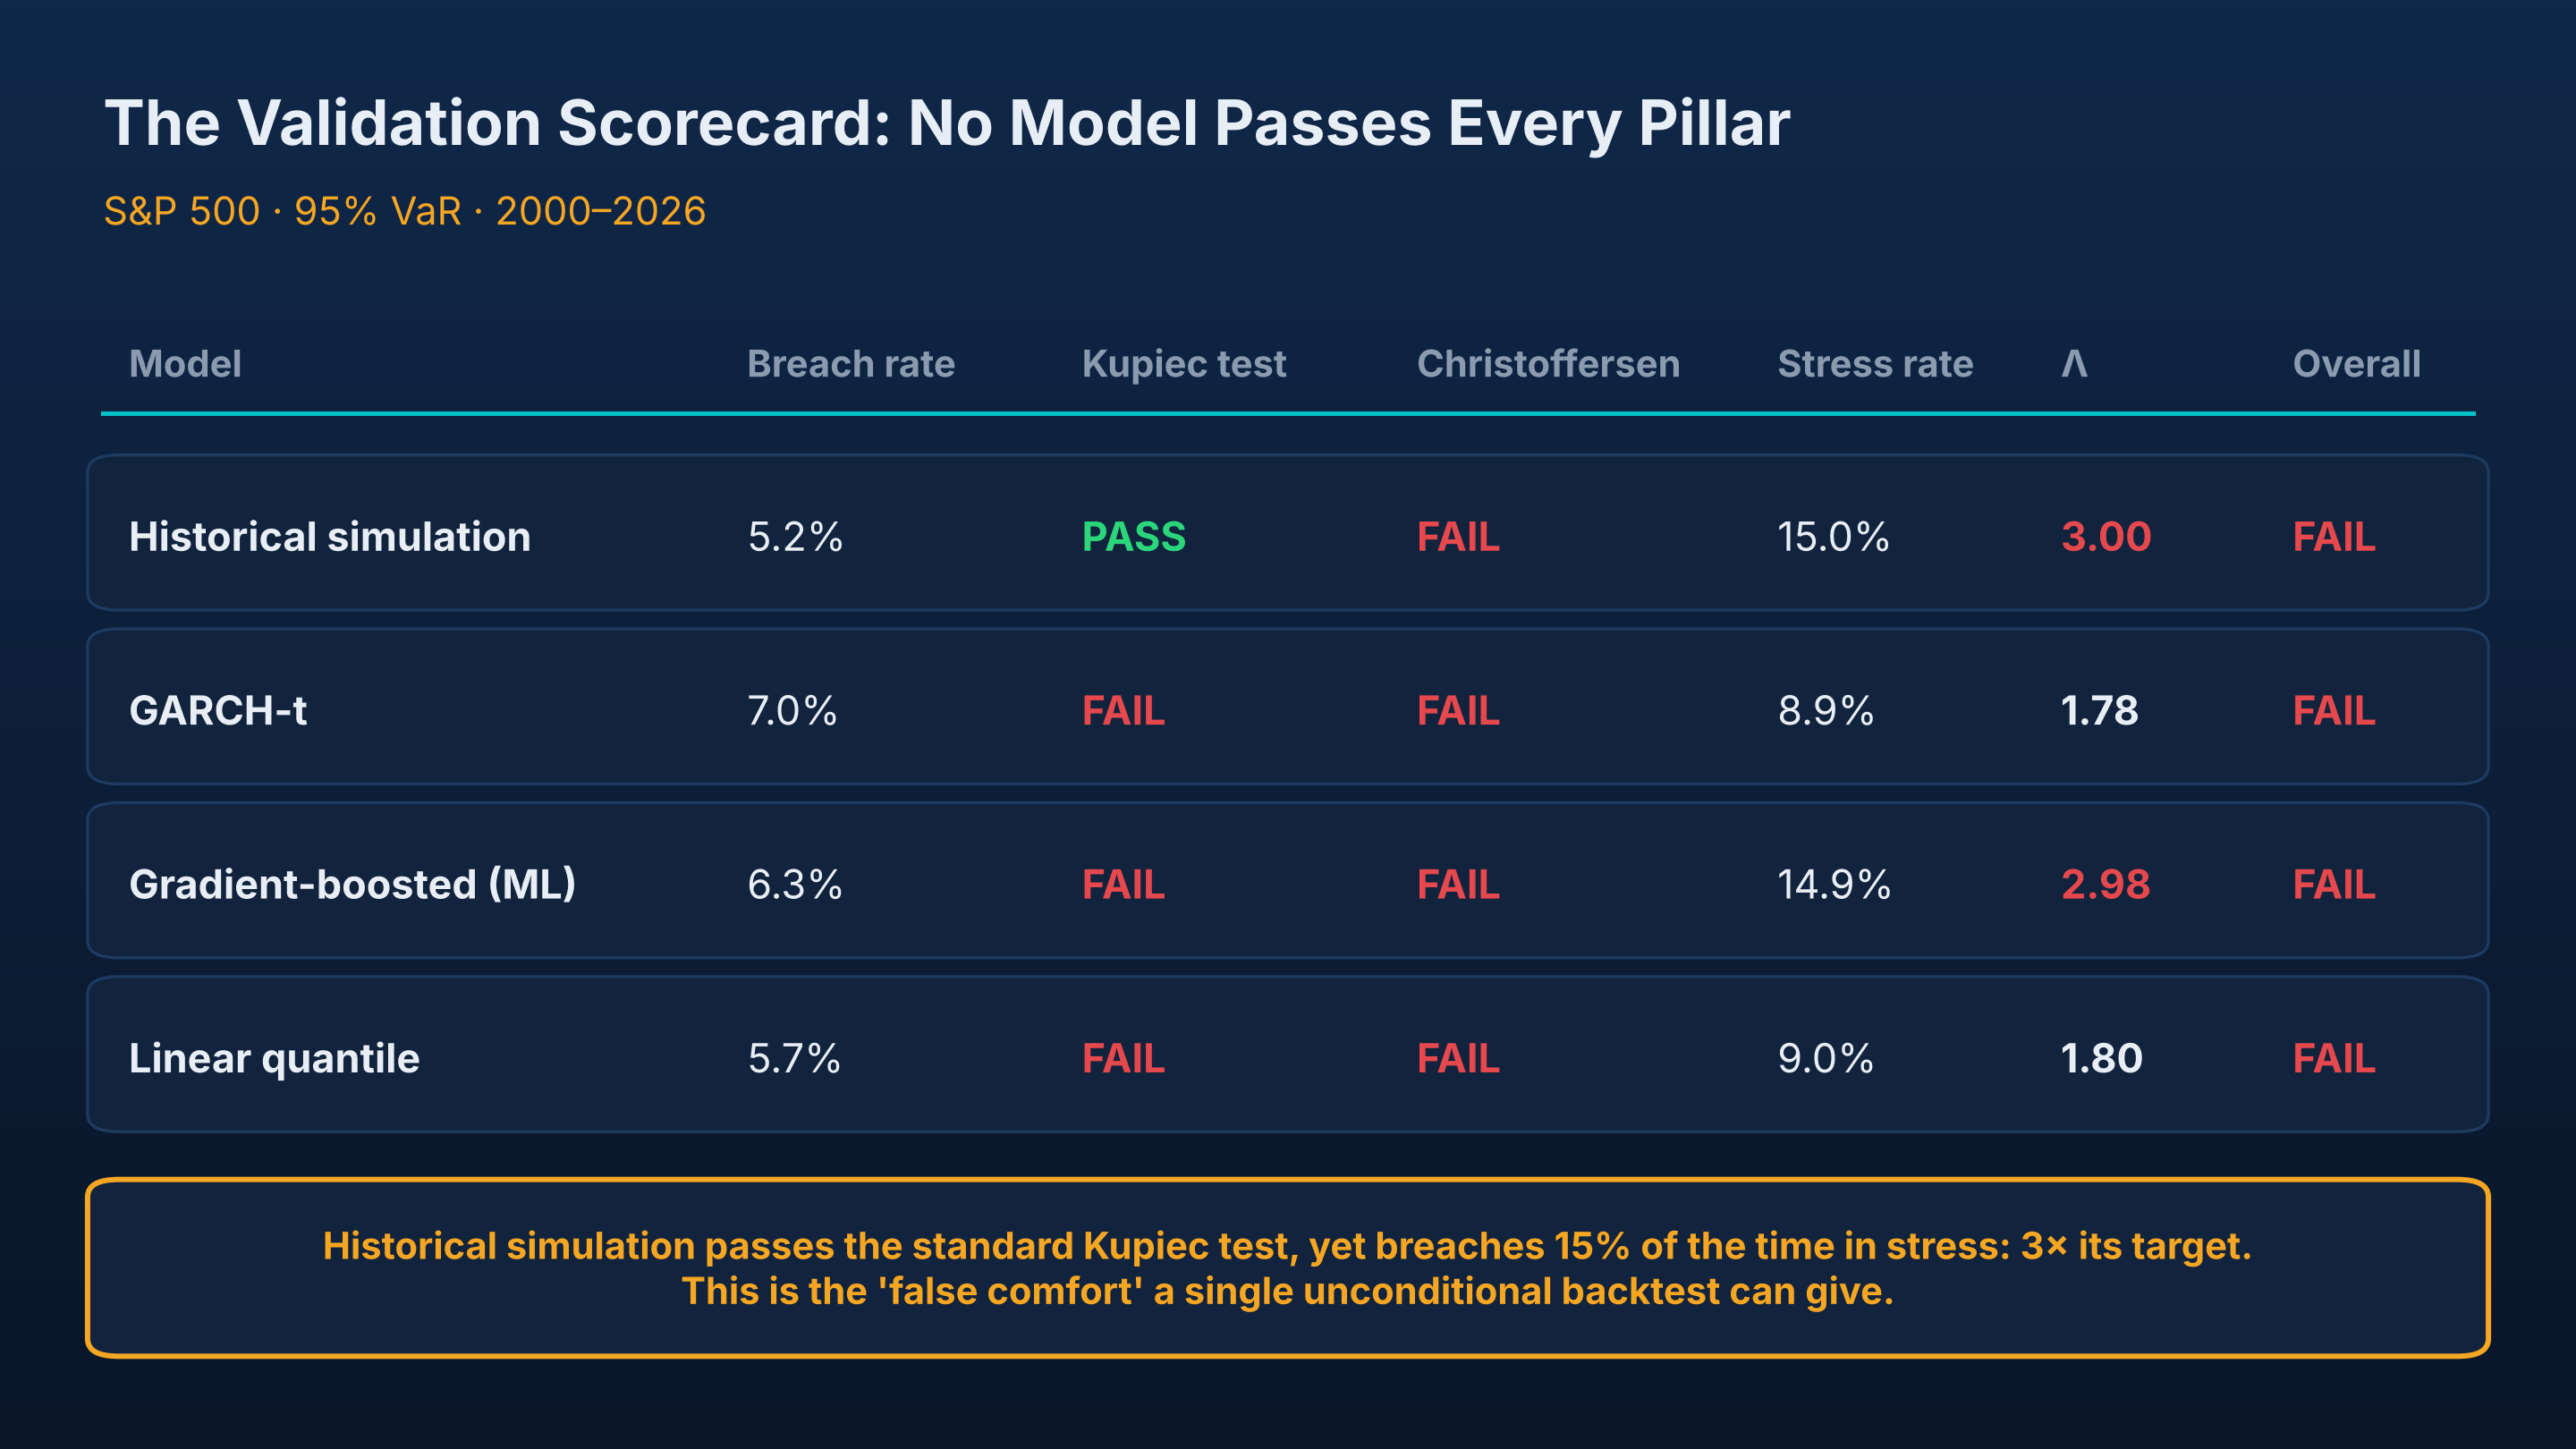
Historical simulation, the industry workhorse, passes the standard Kupiec backtest that anchors the Basel framework (5.2% breach rate vs 5% target). Yet it breaches 15% of the time in stress. It passes the Kupiec test on all six assets, while breaching 2.2 to 3.3 times its target in stress.
A single, full-sample backtest averages the calm and stressed periods together and hides the failure. That is what I call false comfort.
Finding 3: at the capital level, the failure is dramatic#
| Asset | ML model, 95% VaR | ML model, 99% VaR |
|---|---|---|
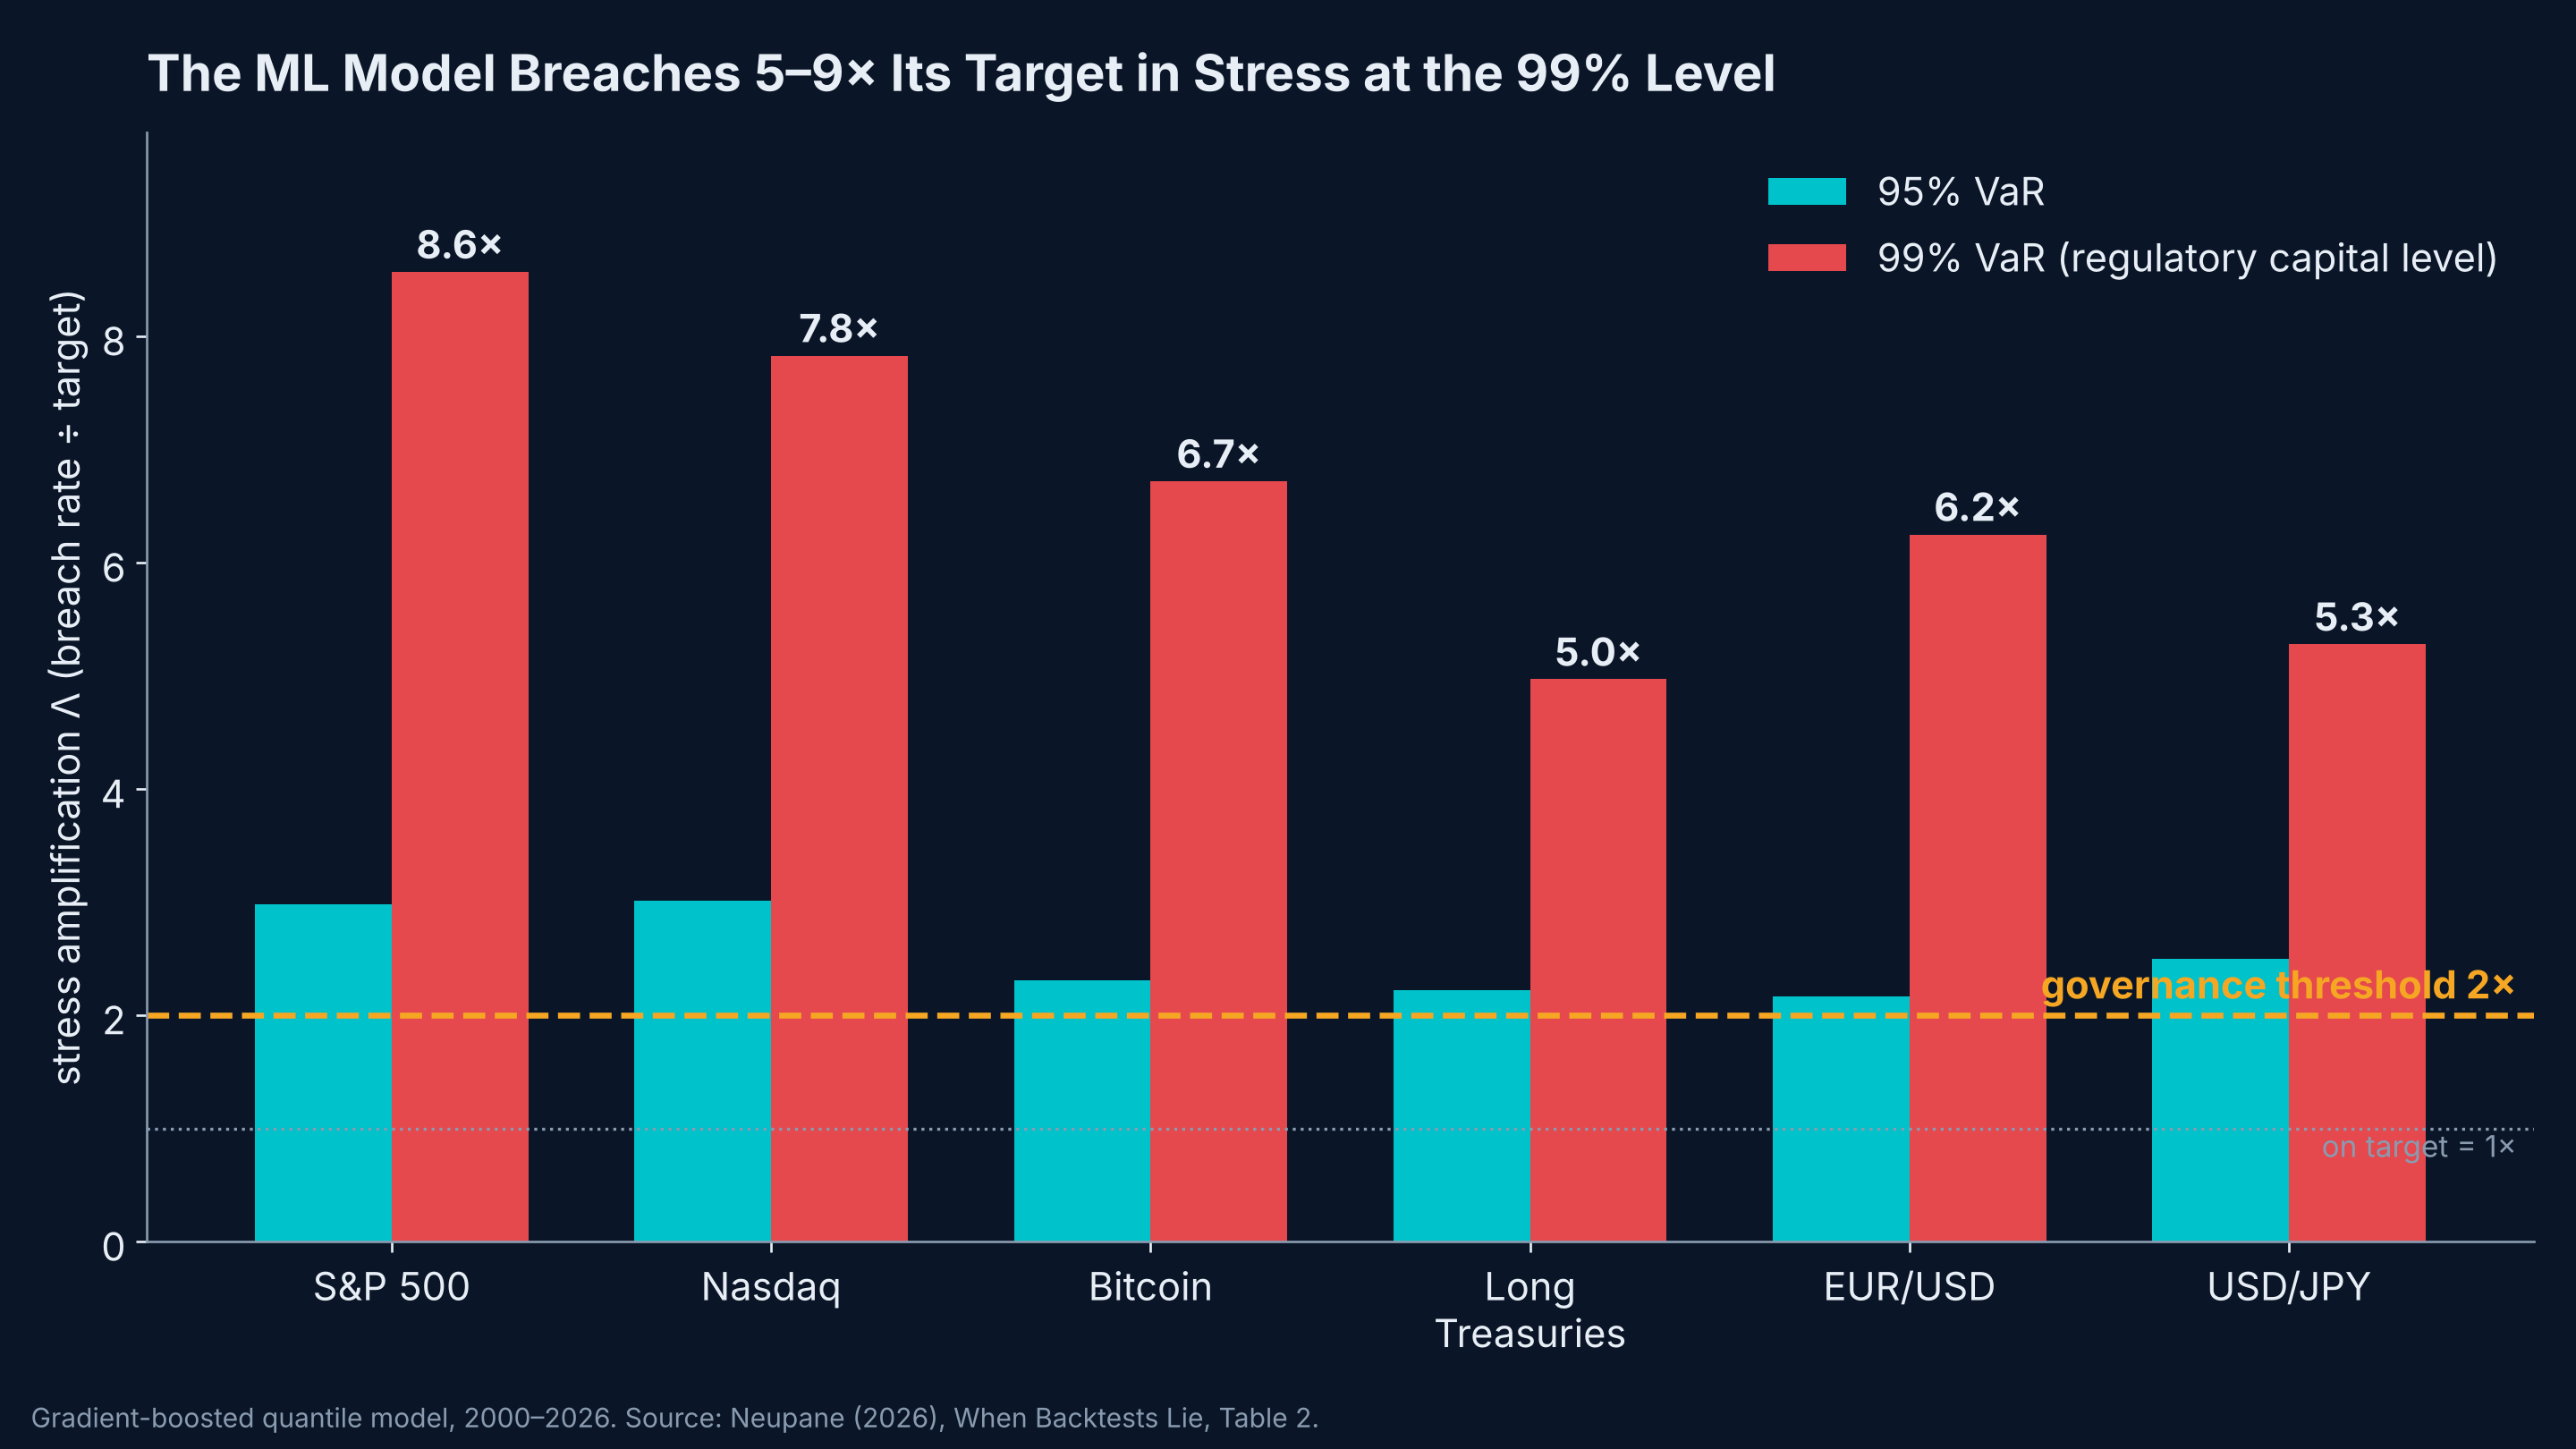
| S&P 500 | 3.0× | 8.6× |
| Nasdaq | 3.0× | 7.8× |
| Bitcoin | 2.3× | 6.7× |
| EUR/USD | 2.2× | 6.3× |
| USD/JPY | 2.5× | 5.3× |
| Long Treasuries | 2.2× | 5.0× |
At the 99% level that underpins regulatory capital, the machine-learning model breaches between five and nine times its target in stress on every equity and currency series.
Finding 4: the regime effect is not an accident#
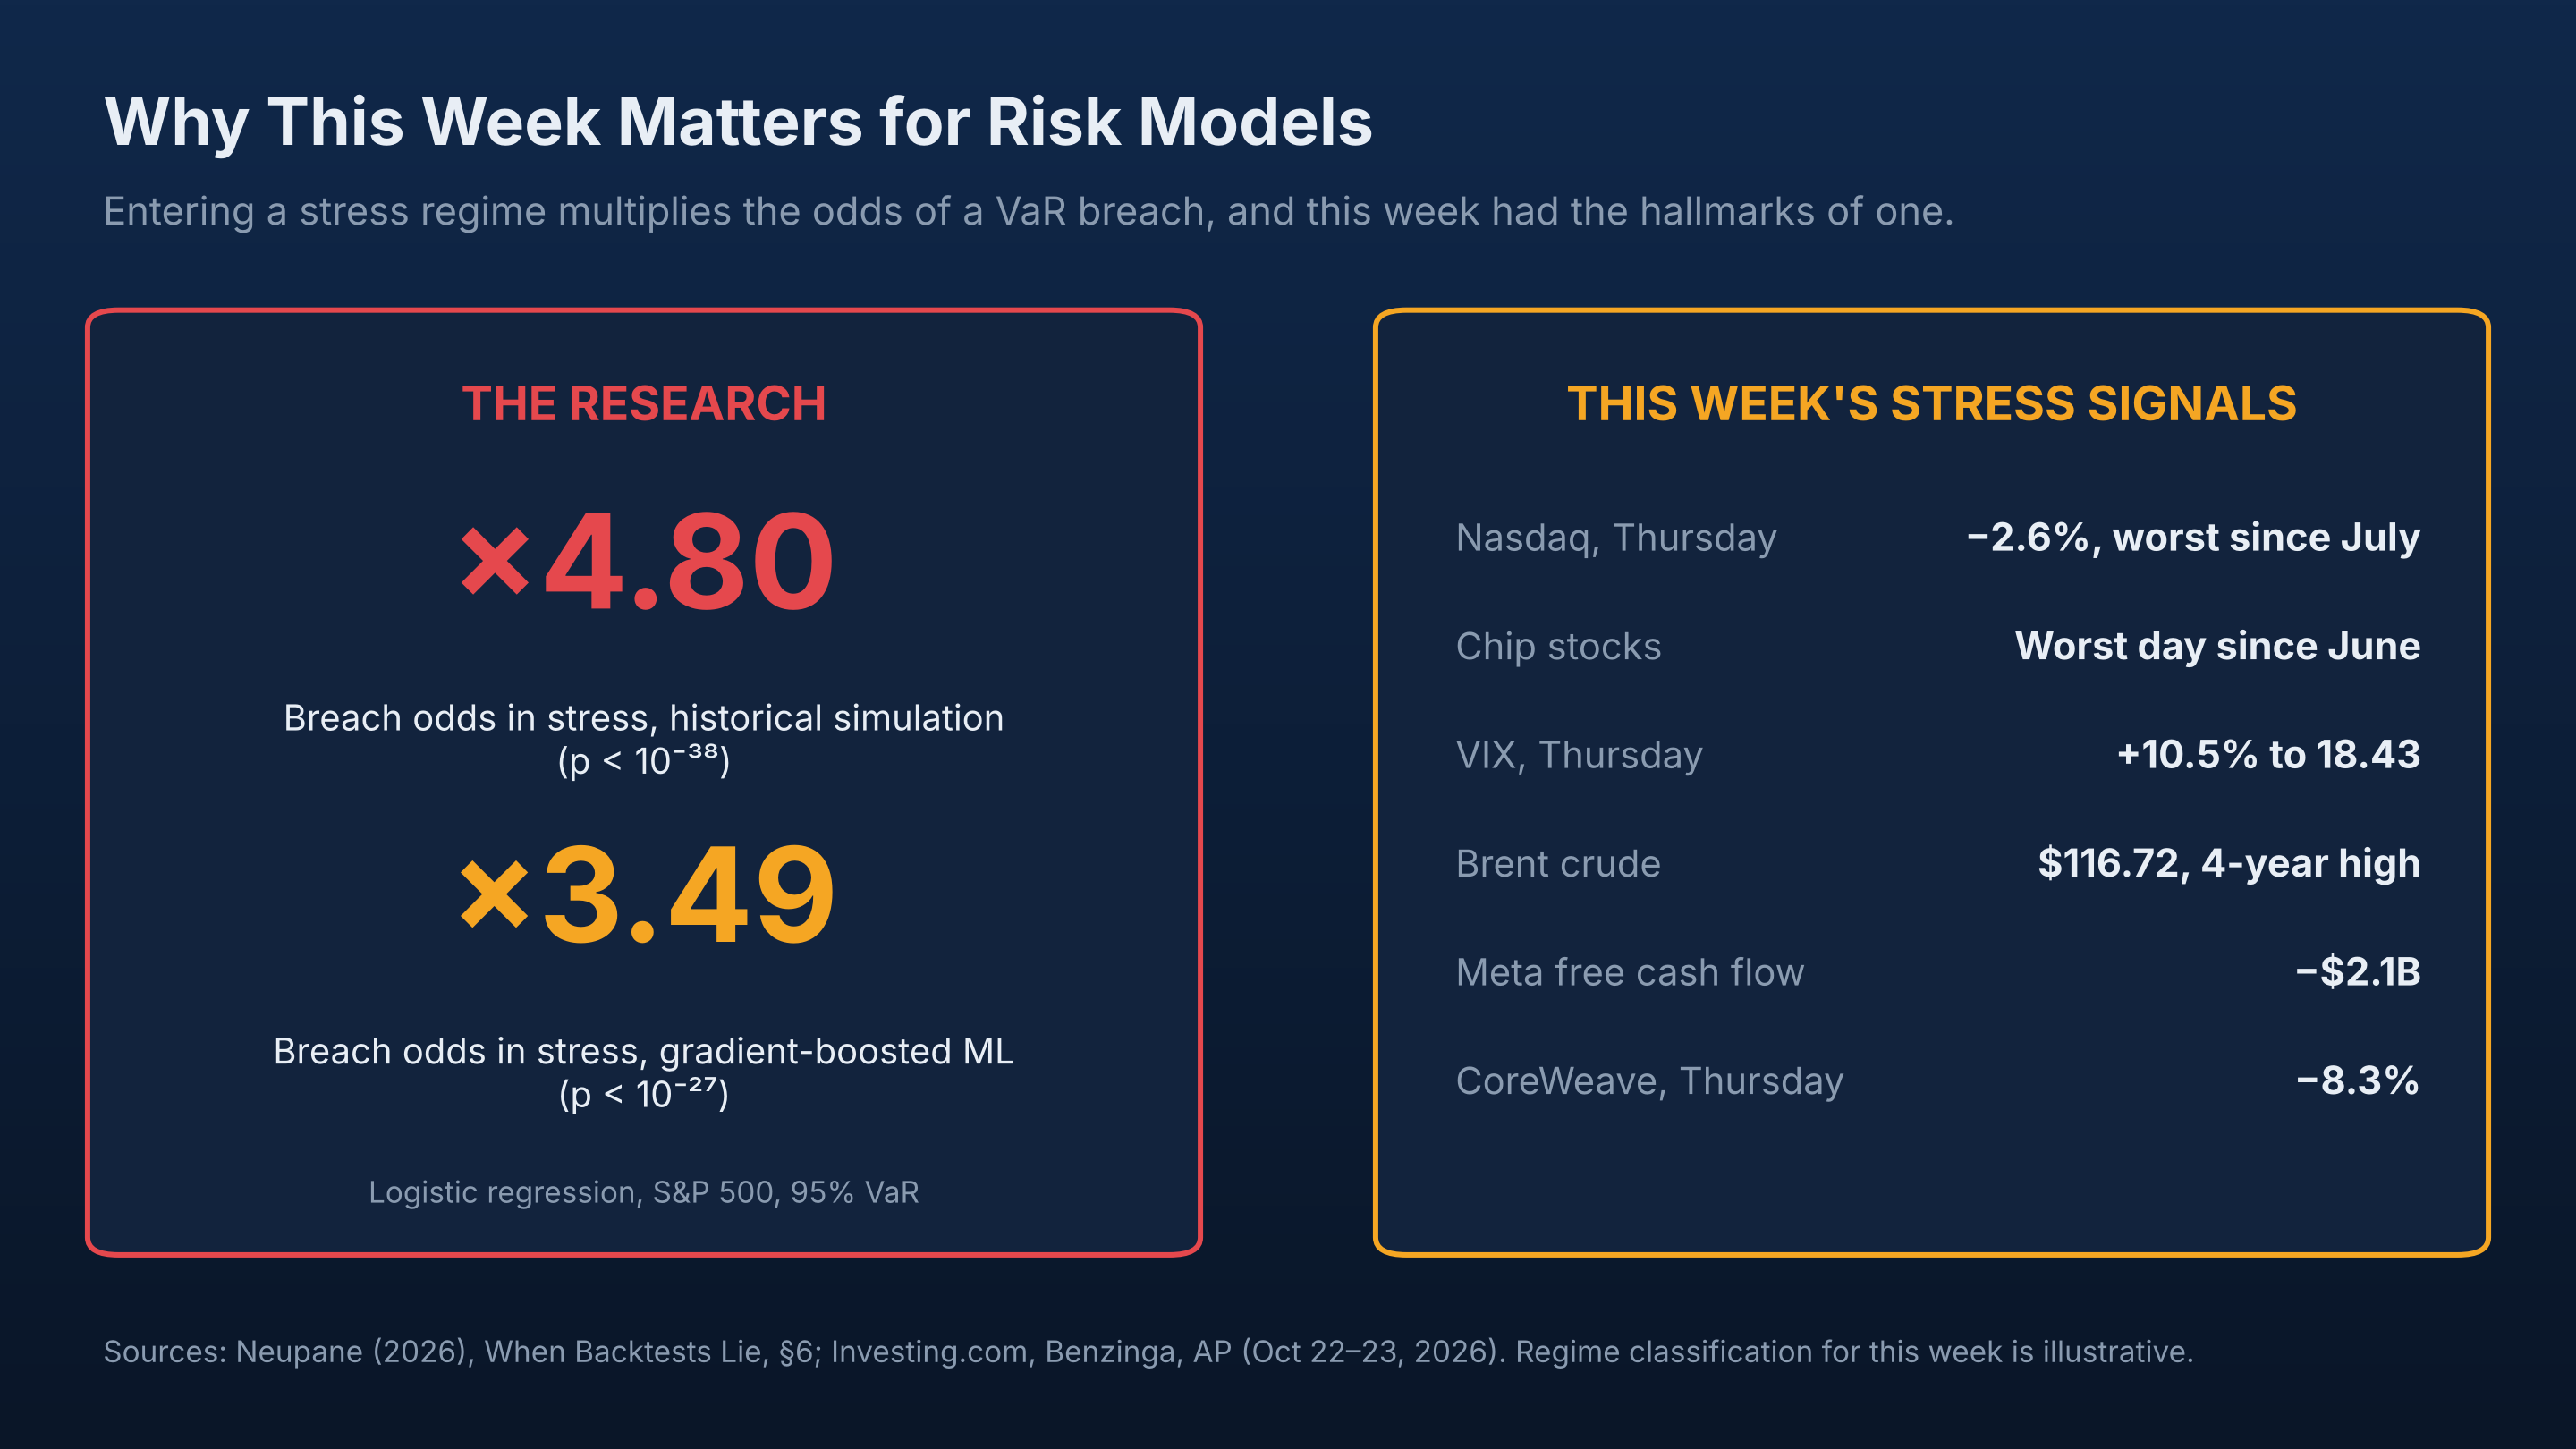
A formal statistical test confirms it. On the S&P 500, entering a stress regime multiplies the odds of a VaR breach by 4.80 for historical simulation (p < 10⁻³⁸) and 3.49 for the machine-learning model (p < 10⁻²⁷). The model's overfitting probability is close to zero, so this fragility is a genuine response to regime change, not an artifact of model selection.
Finding 5: the failures cluster in the crises we remember#
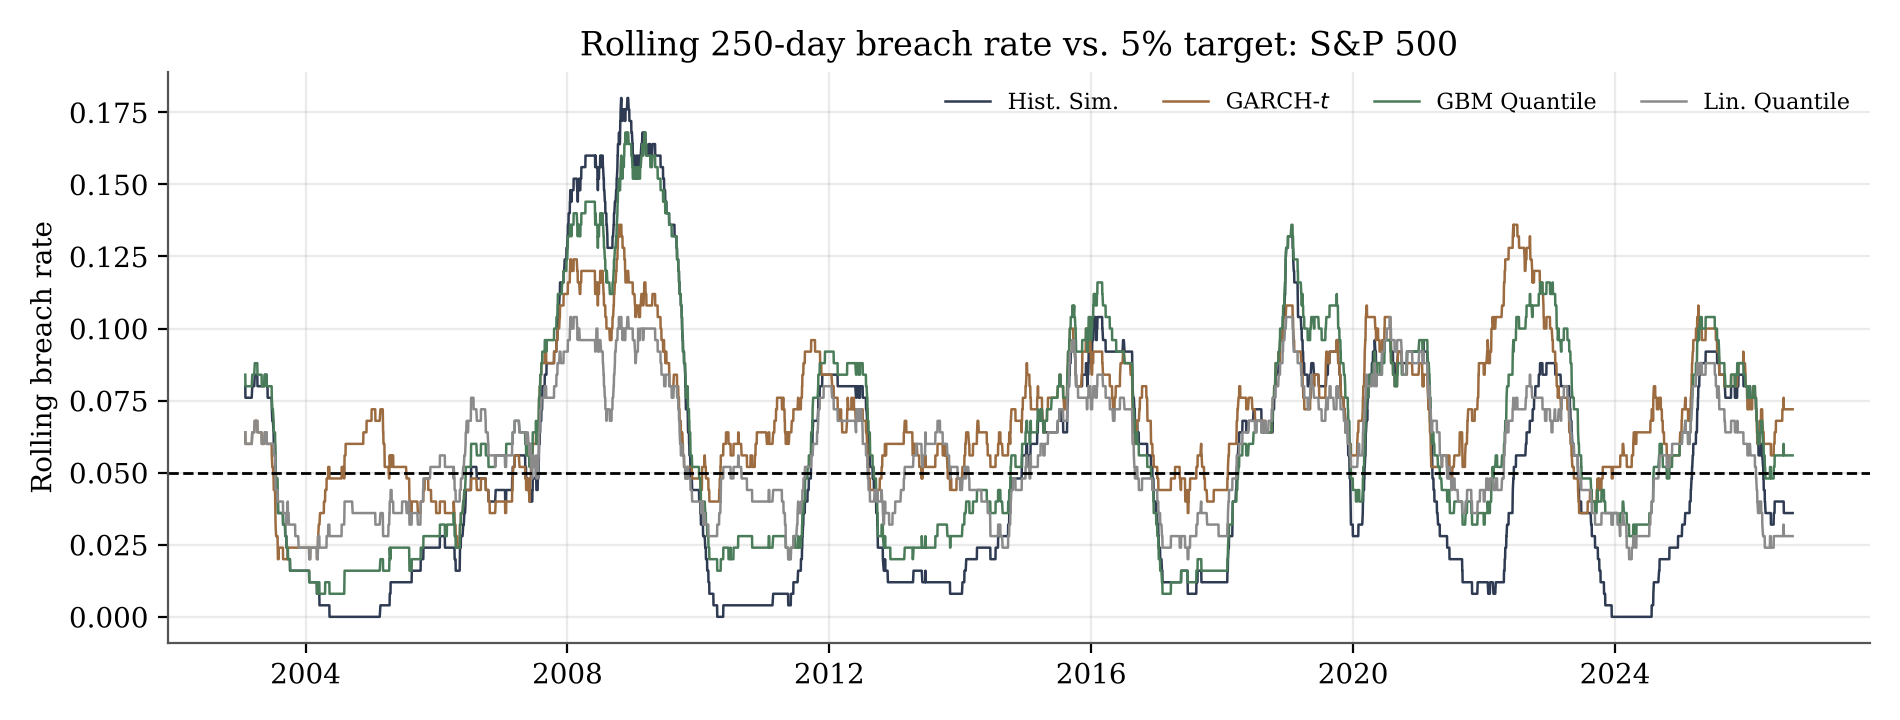
Figure from the paper: rolling 250-day breach rates spike far above the 5% target in 2008, 2020 and 2022.
7. Six ways this week's news connects to the research#↑ Contents
The paper was written before this week. But almost every major story of October 19–23 maps onto one of its findings.
Connection 1: The market stopped trusting averages. Risk validation should too.#
Meta's quarter looked excellent on average: revenue up 26% and above forecasts. The market looked past the average to the one number that mattered under pressure, free cash flow, and the stock fell 7%.
That is exactly the paper's argument about backtesting. A full-sample Kupiec test averages calm and stressed days together. Historical simulation's 5.2% breach rate looks almost perfect against a 5% target, until you split it: 3.6% in calm markets, 15.0% in stress. Investors this week refused to accept an average that hid the stress case. Model validators should apply the same discipline.
Connection 2: Calm index, stressed pockets#
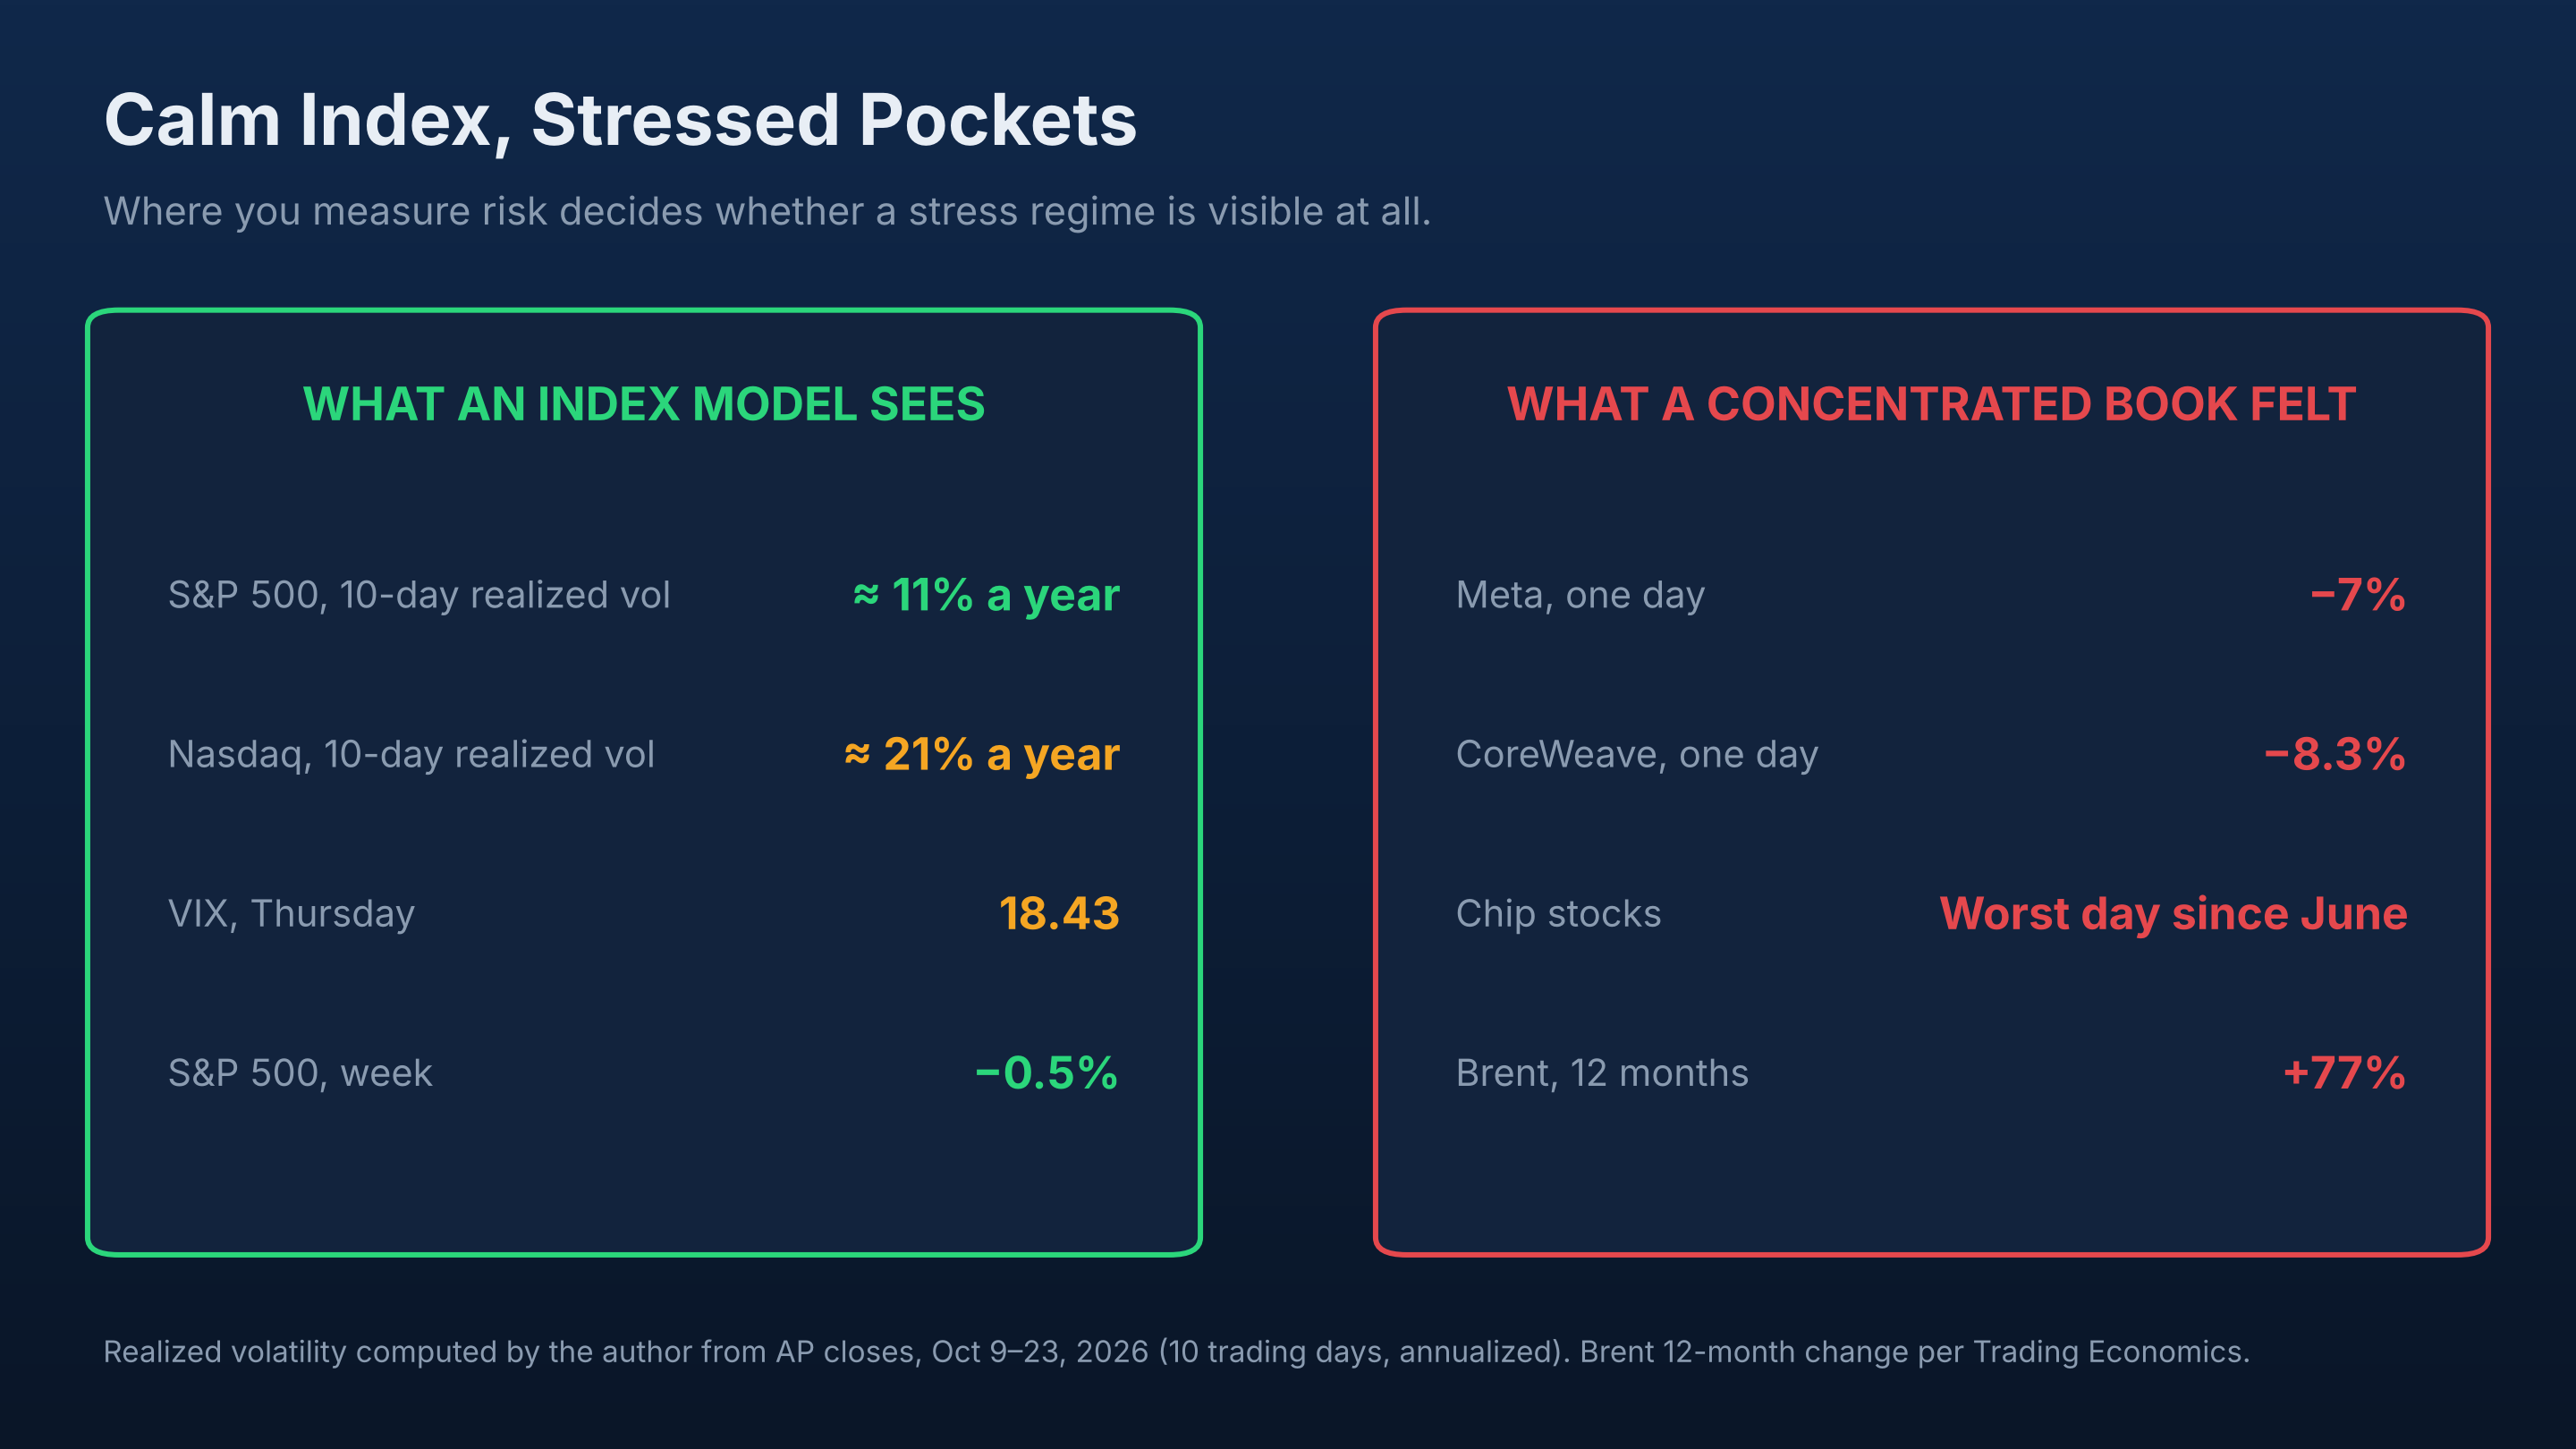
Using the week's daily closes, I estimate the S&P 500's realized volatility over the last 10 trading days at only about 11% a year, calm by historical standards, and the Nasdaq's at about 21%. An index-level model would see little to worry about. Yet inside that calm index, Meta lost 7% and CoreWeave 8.3% in a single day, and chip stocks had their worst day since June.
The paper defines regimes for each asset from its own trailing volatility. The lesson for practice: a regime can be invisible at the index level and severe at the level where a desk actually holds its risk. A trading book concentrated in AI and semiconductors entered stress this week even if the S&P 500 did not. Regime-conditional validation has to be run at the level of the exposure, not just the benchmark.
Connection 3: Losses arrive in clusters, and models adapt late#
Thursday's selloff was, in one strategist's words, "the most widespread selling of the AI trade we have seen all year." Losses hit Meta, the chip makers, CoreWeave, Microsoft, Oracle, Alphabet and Amazon on the same day.
The paper's models all fail the Christoffersen independence test on the S&P 500, which means their breaches cluster rather than arriving randomly. The machine-learning model in the paper learns from lagged returns and trailing volatility, so it adjusts after volatility has already risen. The first days of a regime shift are therefore when breaches bunch together. (This is an interpretation of the mechanism, consistent with the paper's results.)
Connection 4: From the trading desk to bank capital#
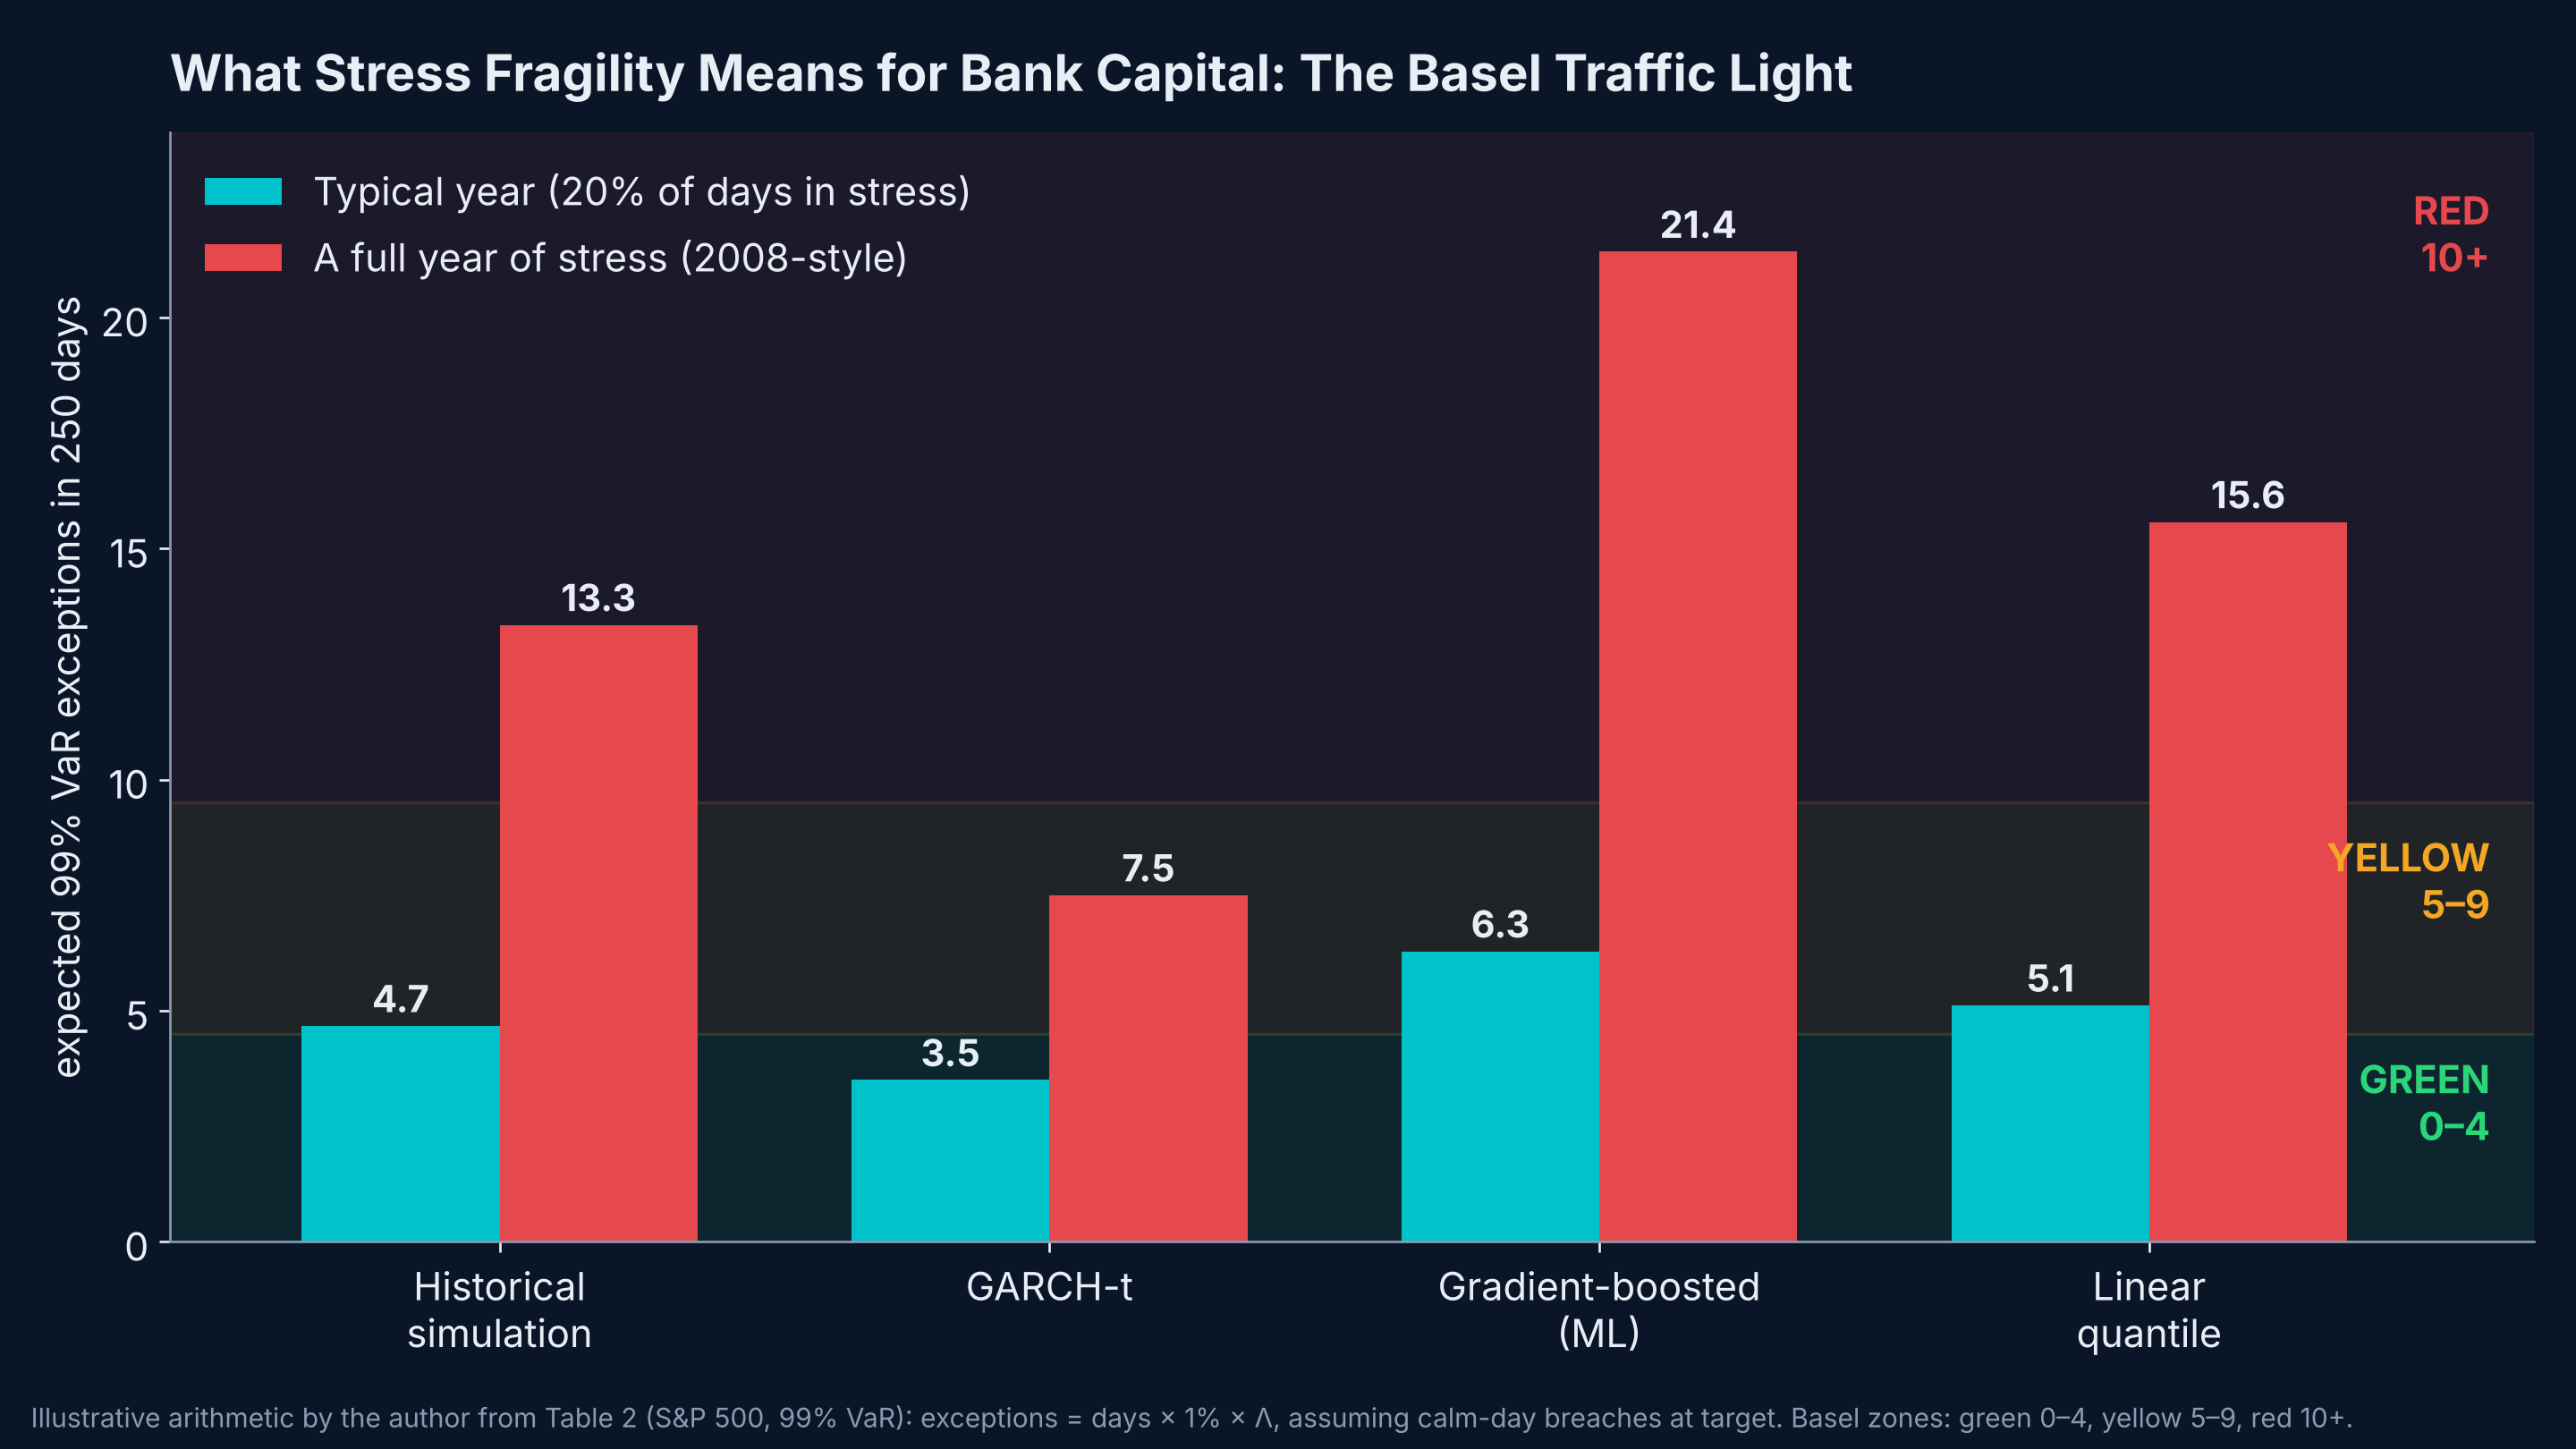
Under the Basel backtesting framework, a bank counts how often its 99% VaR was exceeded over 250 trading days: 0–4 exceptions is green, 5–9 yellow, 10 or more red, with capital add-ons in the yellow and red zones.
Using the paper's stress amplification at the 99% level, here is the illustrative arithmetic:
| Model (S&P 500, 99% VaR) | Λ in stress | Typical year (20% of days in stress) | Full year of stress |
|---|---|---|---|
| Historical simulation | 5.34 | ≈ 4.7 (green, on the edge) | ≈ 13.3 (red) |
| GARCH-t | 3.00 | ≈ 3.5 (green) | ≈ 7.5 (yellow) |
| Gradient-boosted (ML) | 8.57 | ≈ 6.3 (yellow) | ≈ 21.4 (red) |
| Linear quantile | 6.23 | ≈ 5.1 (yellow) | ≈ 15.6 (red) |
Author's illustrative calculation: exceptions = days × 1% × Λ, assuming calm-day breaches at the target rate.
The point is not the exact numbers. It is that a model that looks fine in a calm year can move a bank into the red zone in a stressed one, and the switch happens exactly when capital matters most.
Connection 5: The regulatory gap is real, and current#
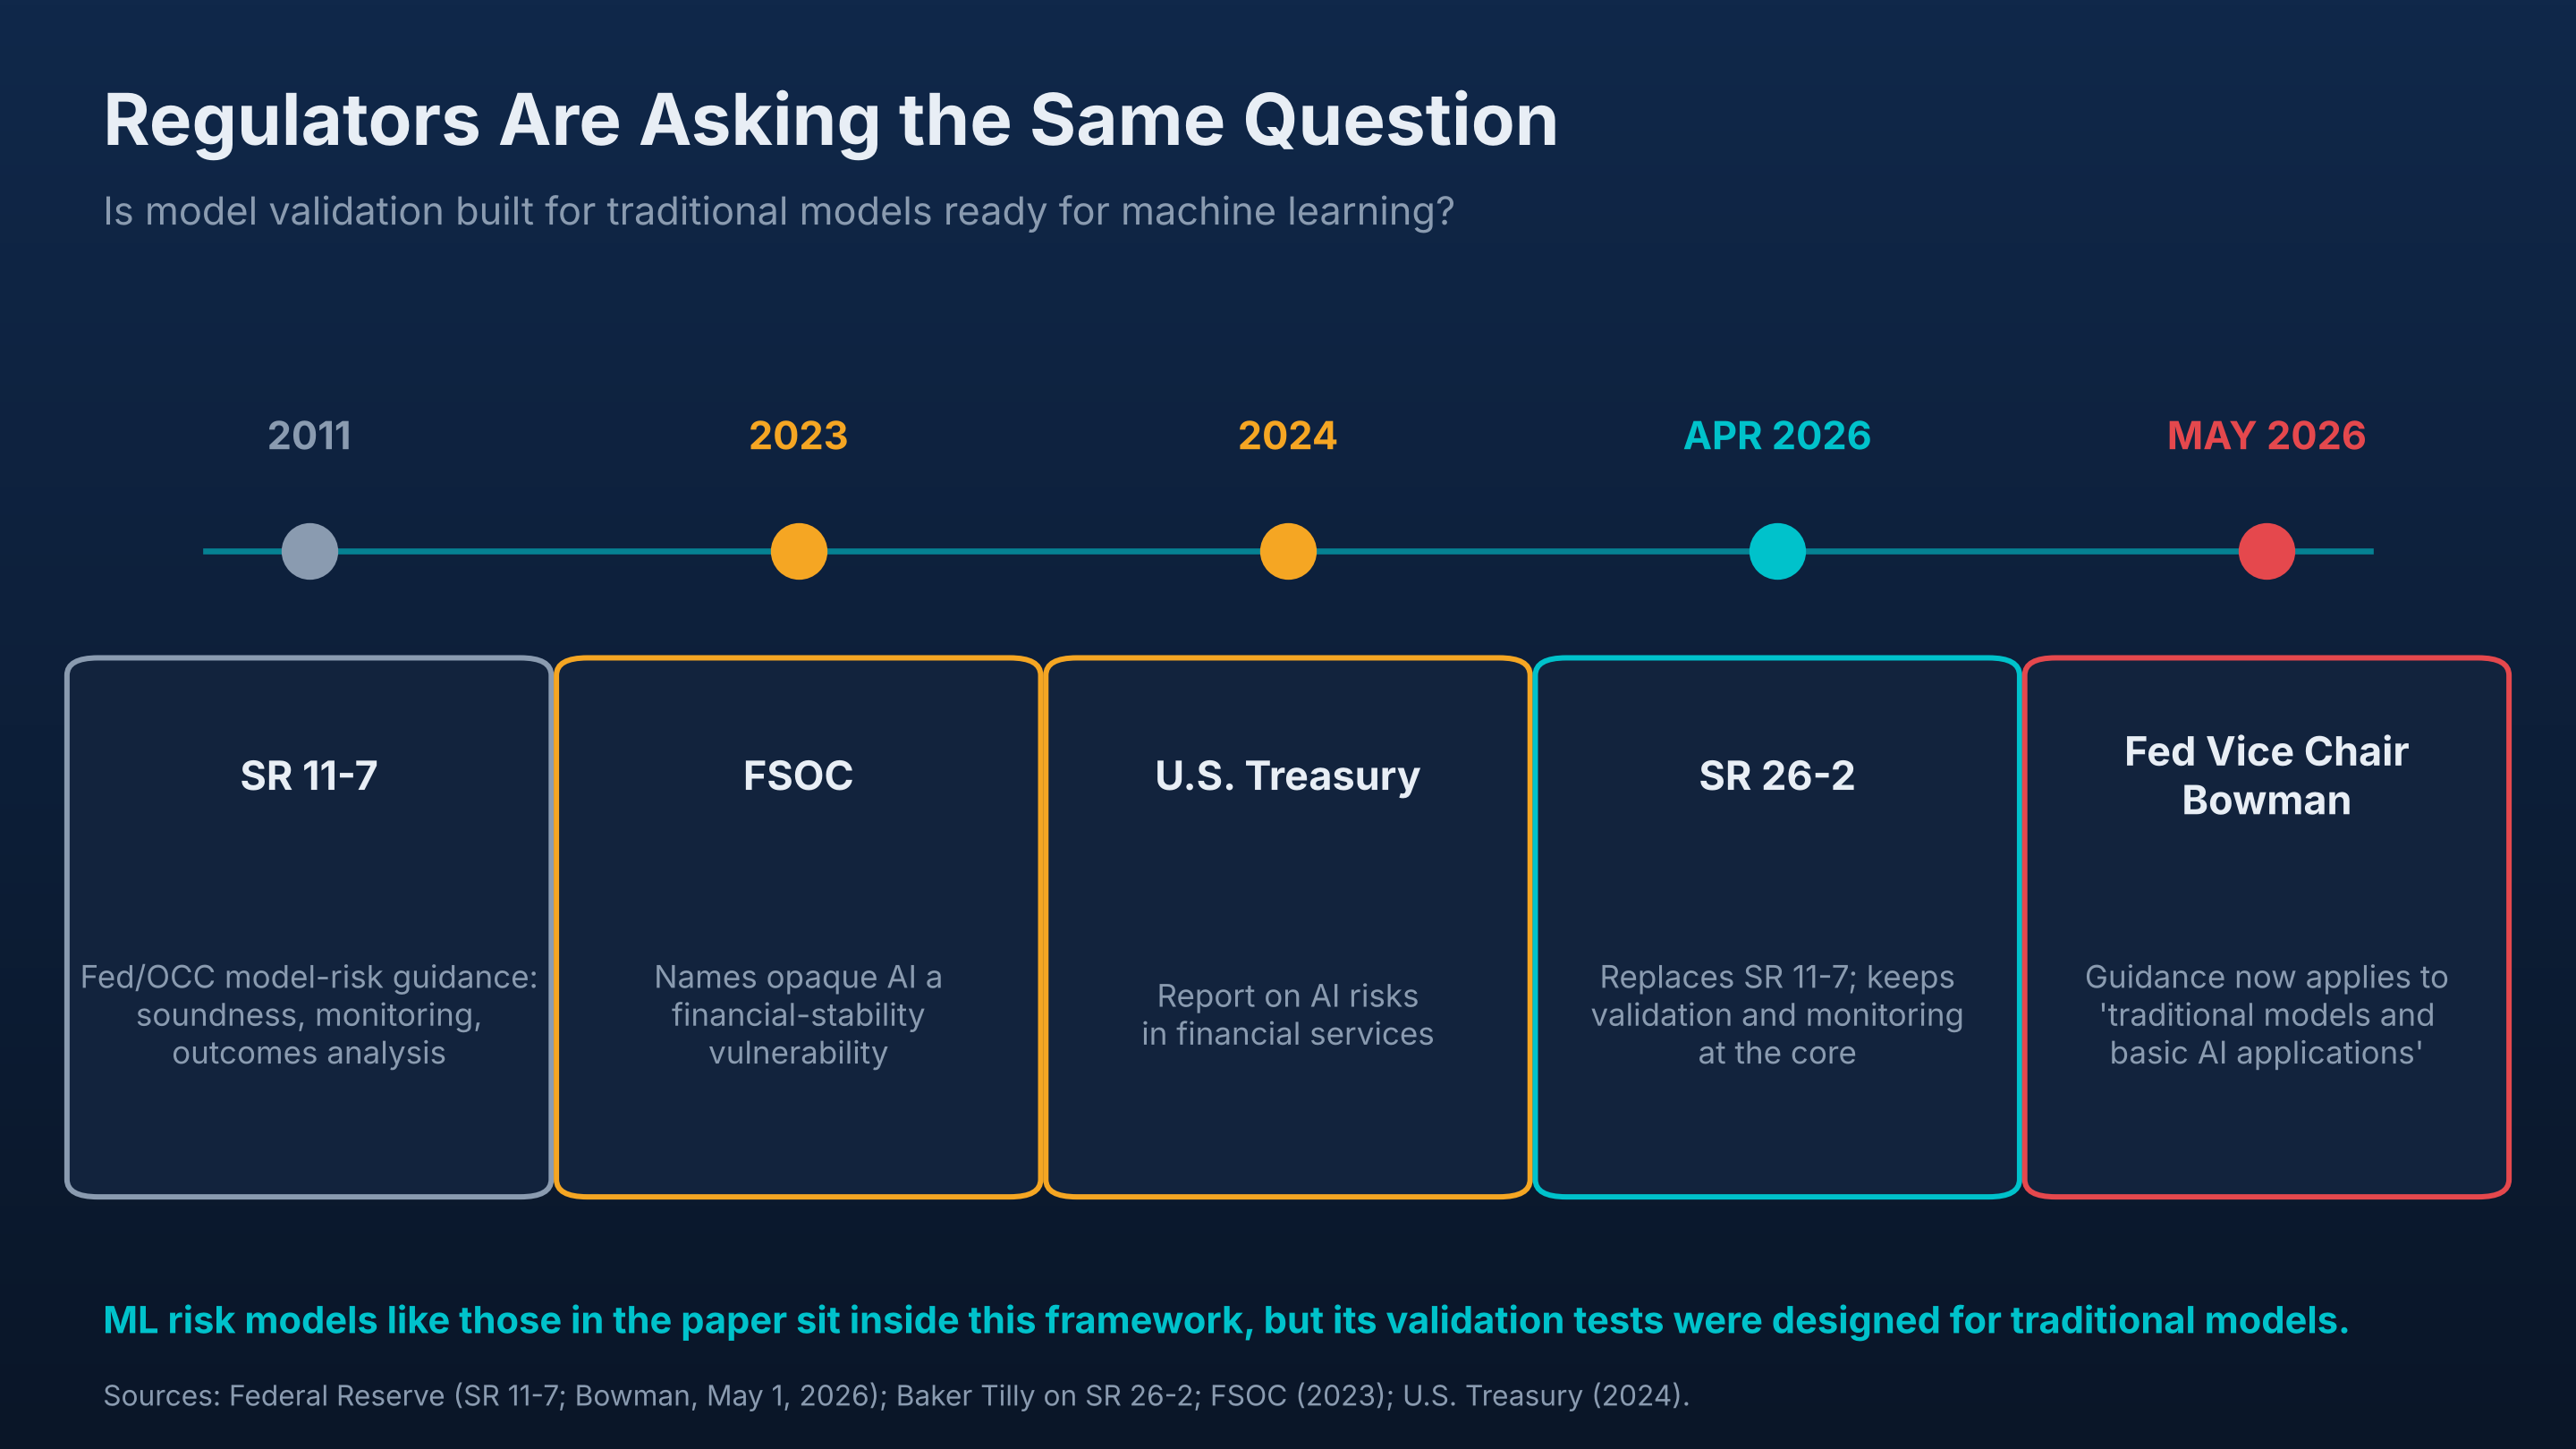
| Date | Development |
|---|---|
| 2011 | SR 11-7 sets the model-risk framework: conceptual soundness, ongoing monitoring, outcomes analysis |
| 2023 | FSOC names opaque, hard-to-explain AI a financial-stability vulnerability |
| 2024 | U.S. Treasury examines AI risks across financial services |
| April 17, 2026 | The Fed, FDIC and OCC issue SR 26-2, replacing SR 11-7 while keeping independent validation and ongoing monitoring at the core |
| May 1, 2026 | Fed Vice Chair Bowman: the revised guidance "now applies narrowly to traditional models and basic AI applications," with newer AI to be governed separately |
Machine-learning VaR models like those in the paper sit inside this framework. They are the "basic AI applications" the guidance still covers, yet the outcomes-analysis tools banks use to validate them were designed for traditional models. The paper's scorecard is a concrete way to close that gap without waiting for new rules.
Connection 6: Oil is a regime shift in its own right#
Brent is up about 77% over 12 months and hit $116.72 on Friday, its highest since June 2022. For any portfolio exposed to energy, inflation or rates, the volatility environment has shifted. The paper's models are estimated on a rolling 500-day window, so a model fitted largely on calmer data can understate risk until the new regime fills the window. That is precisely the period when the paper finds breaches multiply.
8. Why this week matters for risk models#↑ Contents
This week had the hallmarks of the conditions the paper studies, even if the broad index stayed calm:
| Stress signal | This week |
|---|---|
| Nasdaq | −2.6% Thursday, worst since July |
| Chip stocks | Worst day since June |
| VIX | +10.5% to 18.43 on Thursday |
| Brent crude | $116.72, a four-year high |
| AI credit | CoreWeave −8.3% in one day |
(Whether a given series formally enters the paper's stress regime depends on its trailing 21-day volatility relative to its own history; this is an illustrative reading.)
The uncomfortable implication: the weeks when markets turn are exactly the weeks when risk models are most likely to understate risk, and a model that sailed through its annual backtest can give no warning.
9. The fix: a governance-grade validation scorecard#↑ Contents
The paper proposes a single scorecard that a model-risk team or bank examiner can apply. Each test maps to a pillar of U.S. model-risk guidance (SR 11-7, whose core validation and monitoring pillars carry into its April 2026 replacement, SR 26-2), and a model passes only if it passes every pillar.
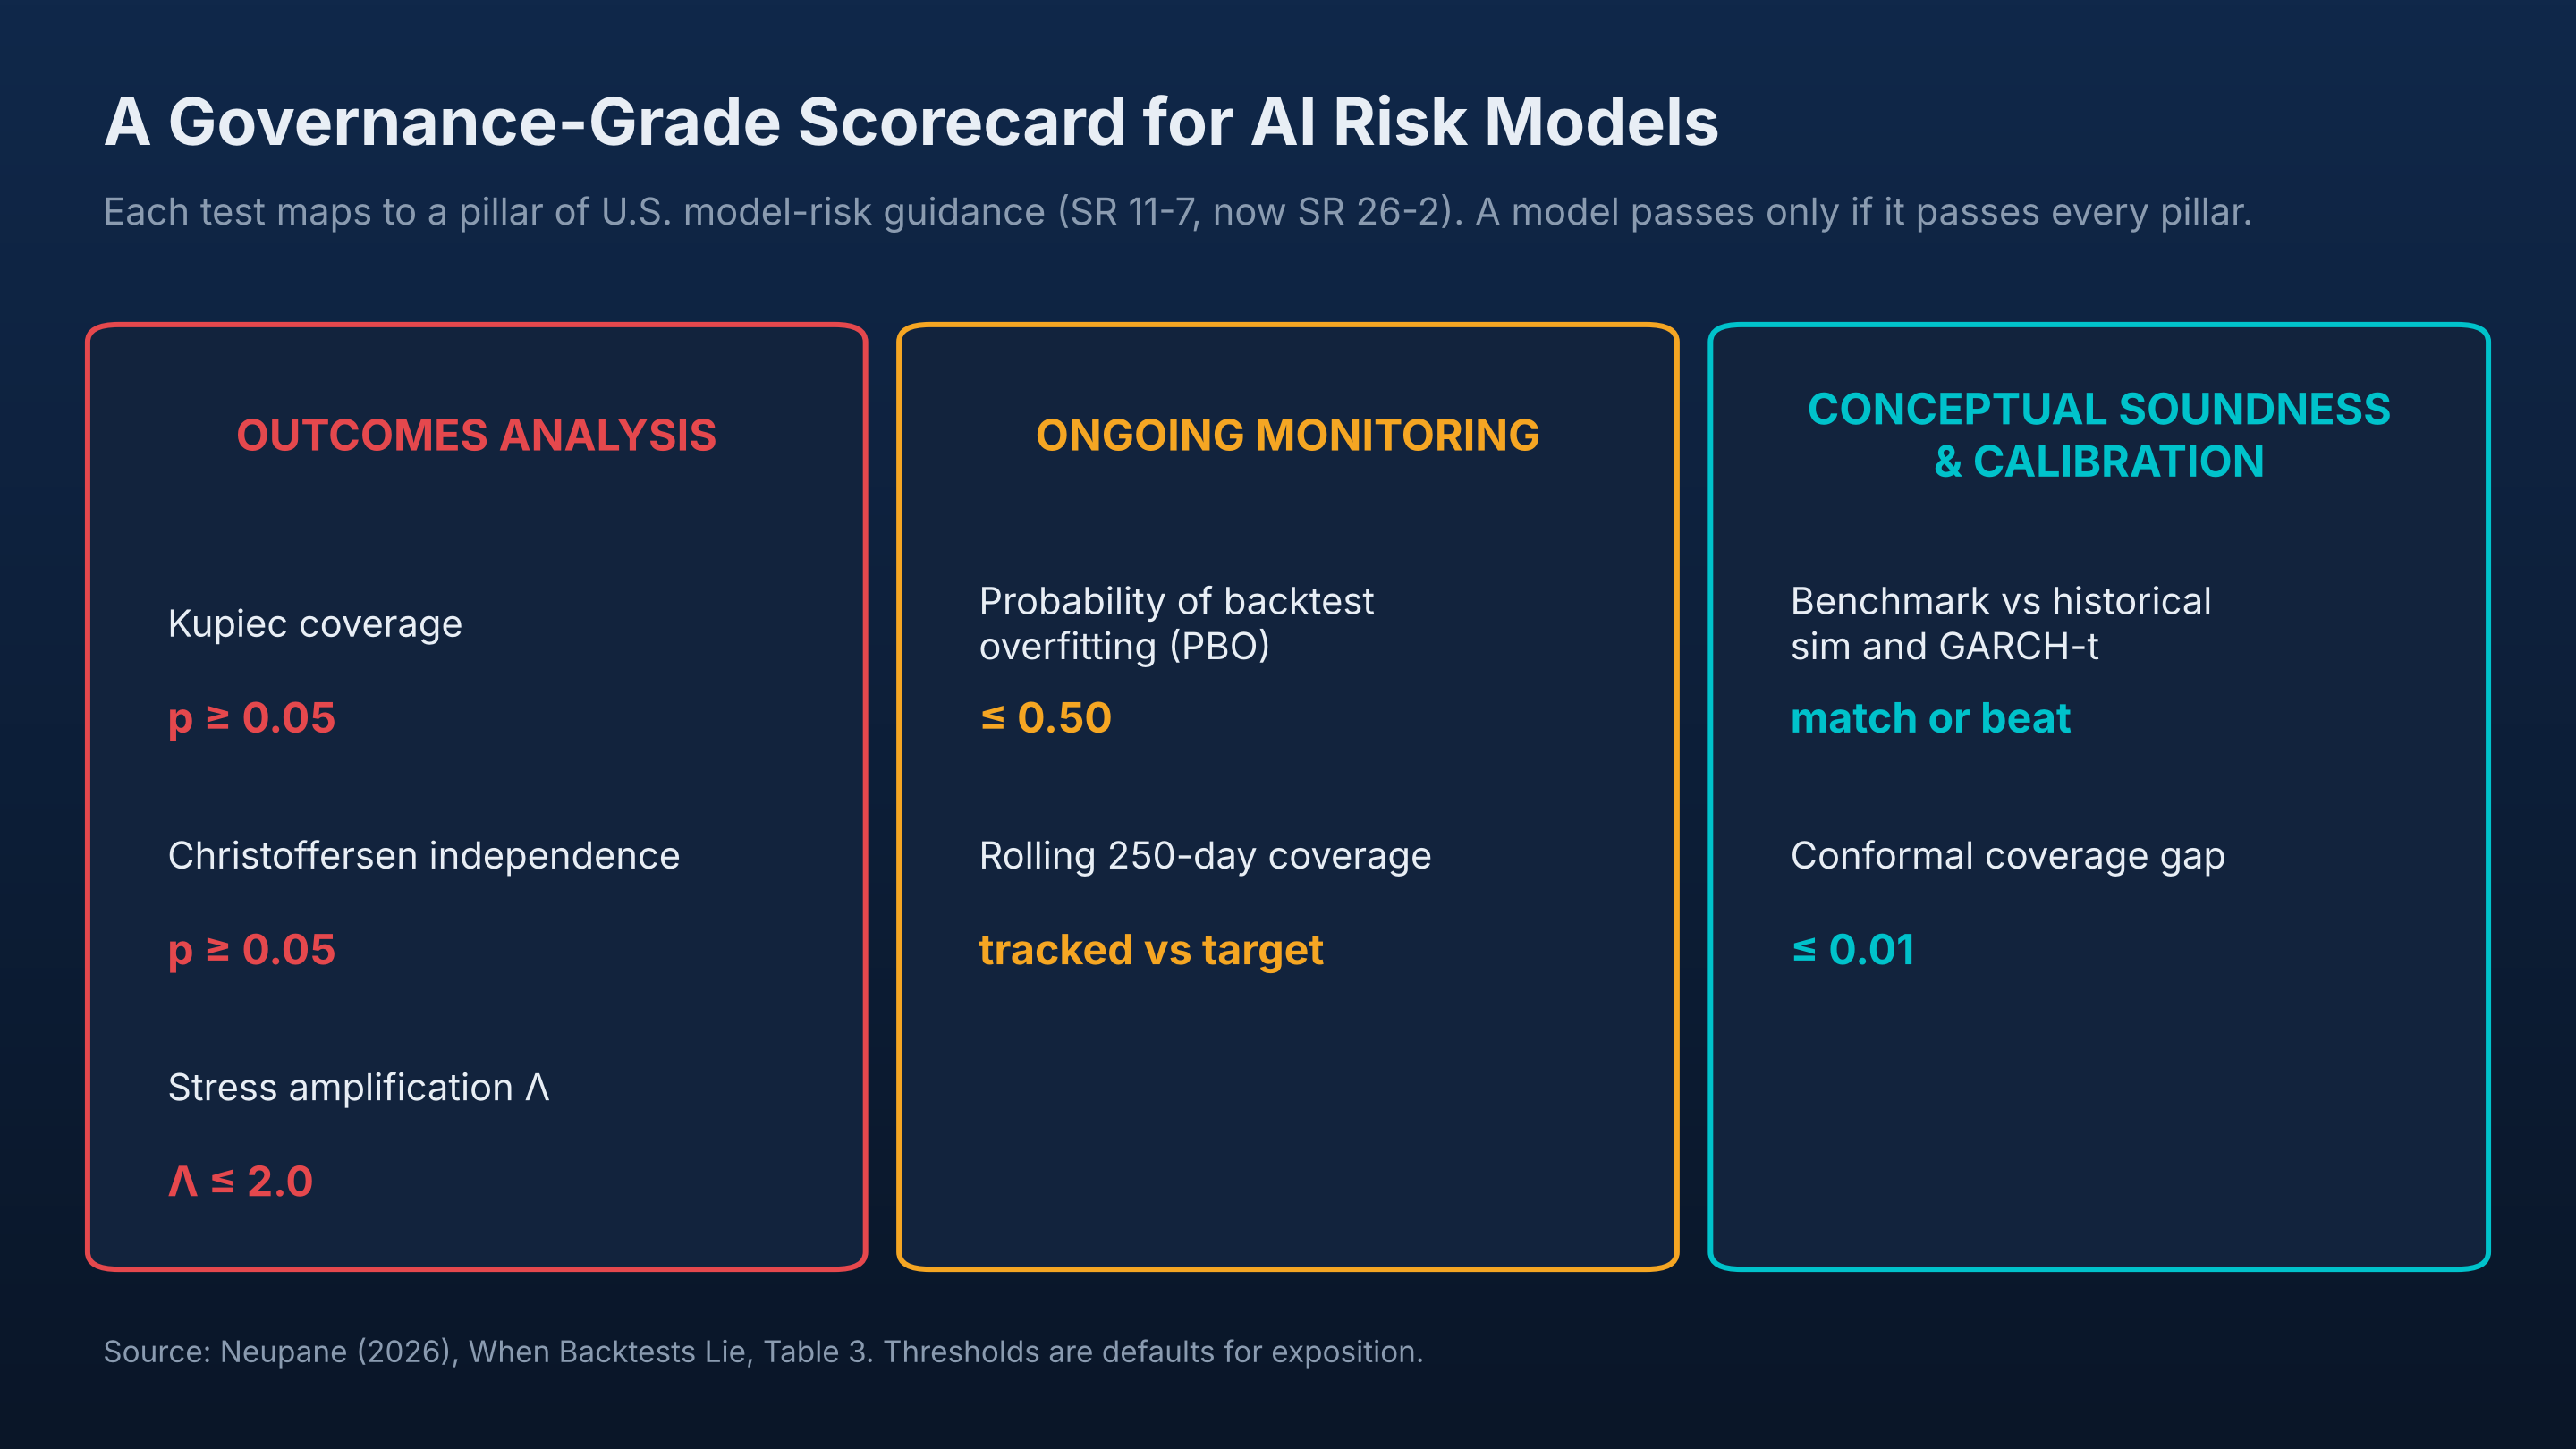
| Test | Governance pillar | Default criterion |
|---|---|---|
| Kupiec coverage | Outcomes analysis | p ≥ 0.05 |
| Christoffersen independence | Outcomes analysis | p ≥ 0.05 |
| Stress amplification Λ | Outcomes analysis | Λ ≤ 2.0 |
| Probability of backtest overfitting | Ongoing monitoring | ≤ 0.50 |
| Conformal coverage gap | Calibration | ≤ 0.01 |
The key addition is stress amplification (Λ): the breach rate in stressed markets divided by the target. It makes regime fragility a visible, auditable result instead of something a full-sample average quietly hides.
What institutions can do now:
| # | Action | Why |
|---|---|---|
| 1 | Split every backtest by regime | A passing full-sample result can hide a 3× failure in stress |
| 2 | Report stress amplification Λ alongside the Kupiec result | One number that shows how a model behaves when it matters |
| 3 | Validate at the 99% level, not just 95% | Fragility is far larger at the capital-relevant level |
| 4 | Don't trust calm-market performance from ML models | The best calm-market model can be the most fragile in stress |
| 5 | Test for overfitting | Separates genuine fragility from selection artifacts |
| 6 | Recalibrate, but don't stop there | Conformal recalibration helps coverage but does not by itself fix regime fragility |
10. What to watch next week#↑ Contents
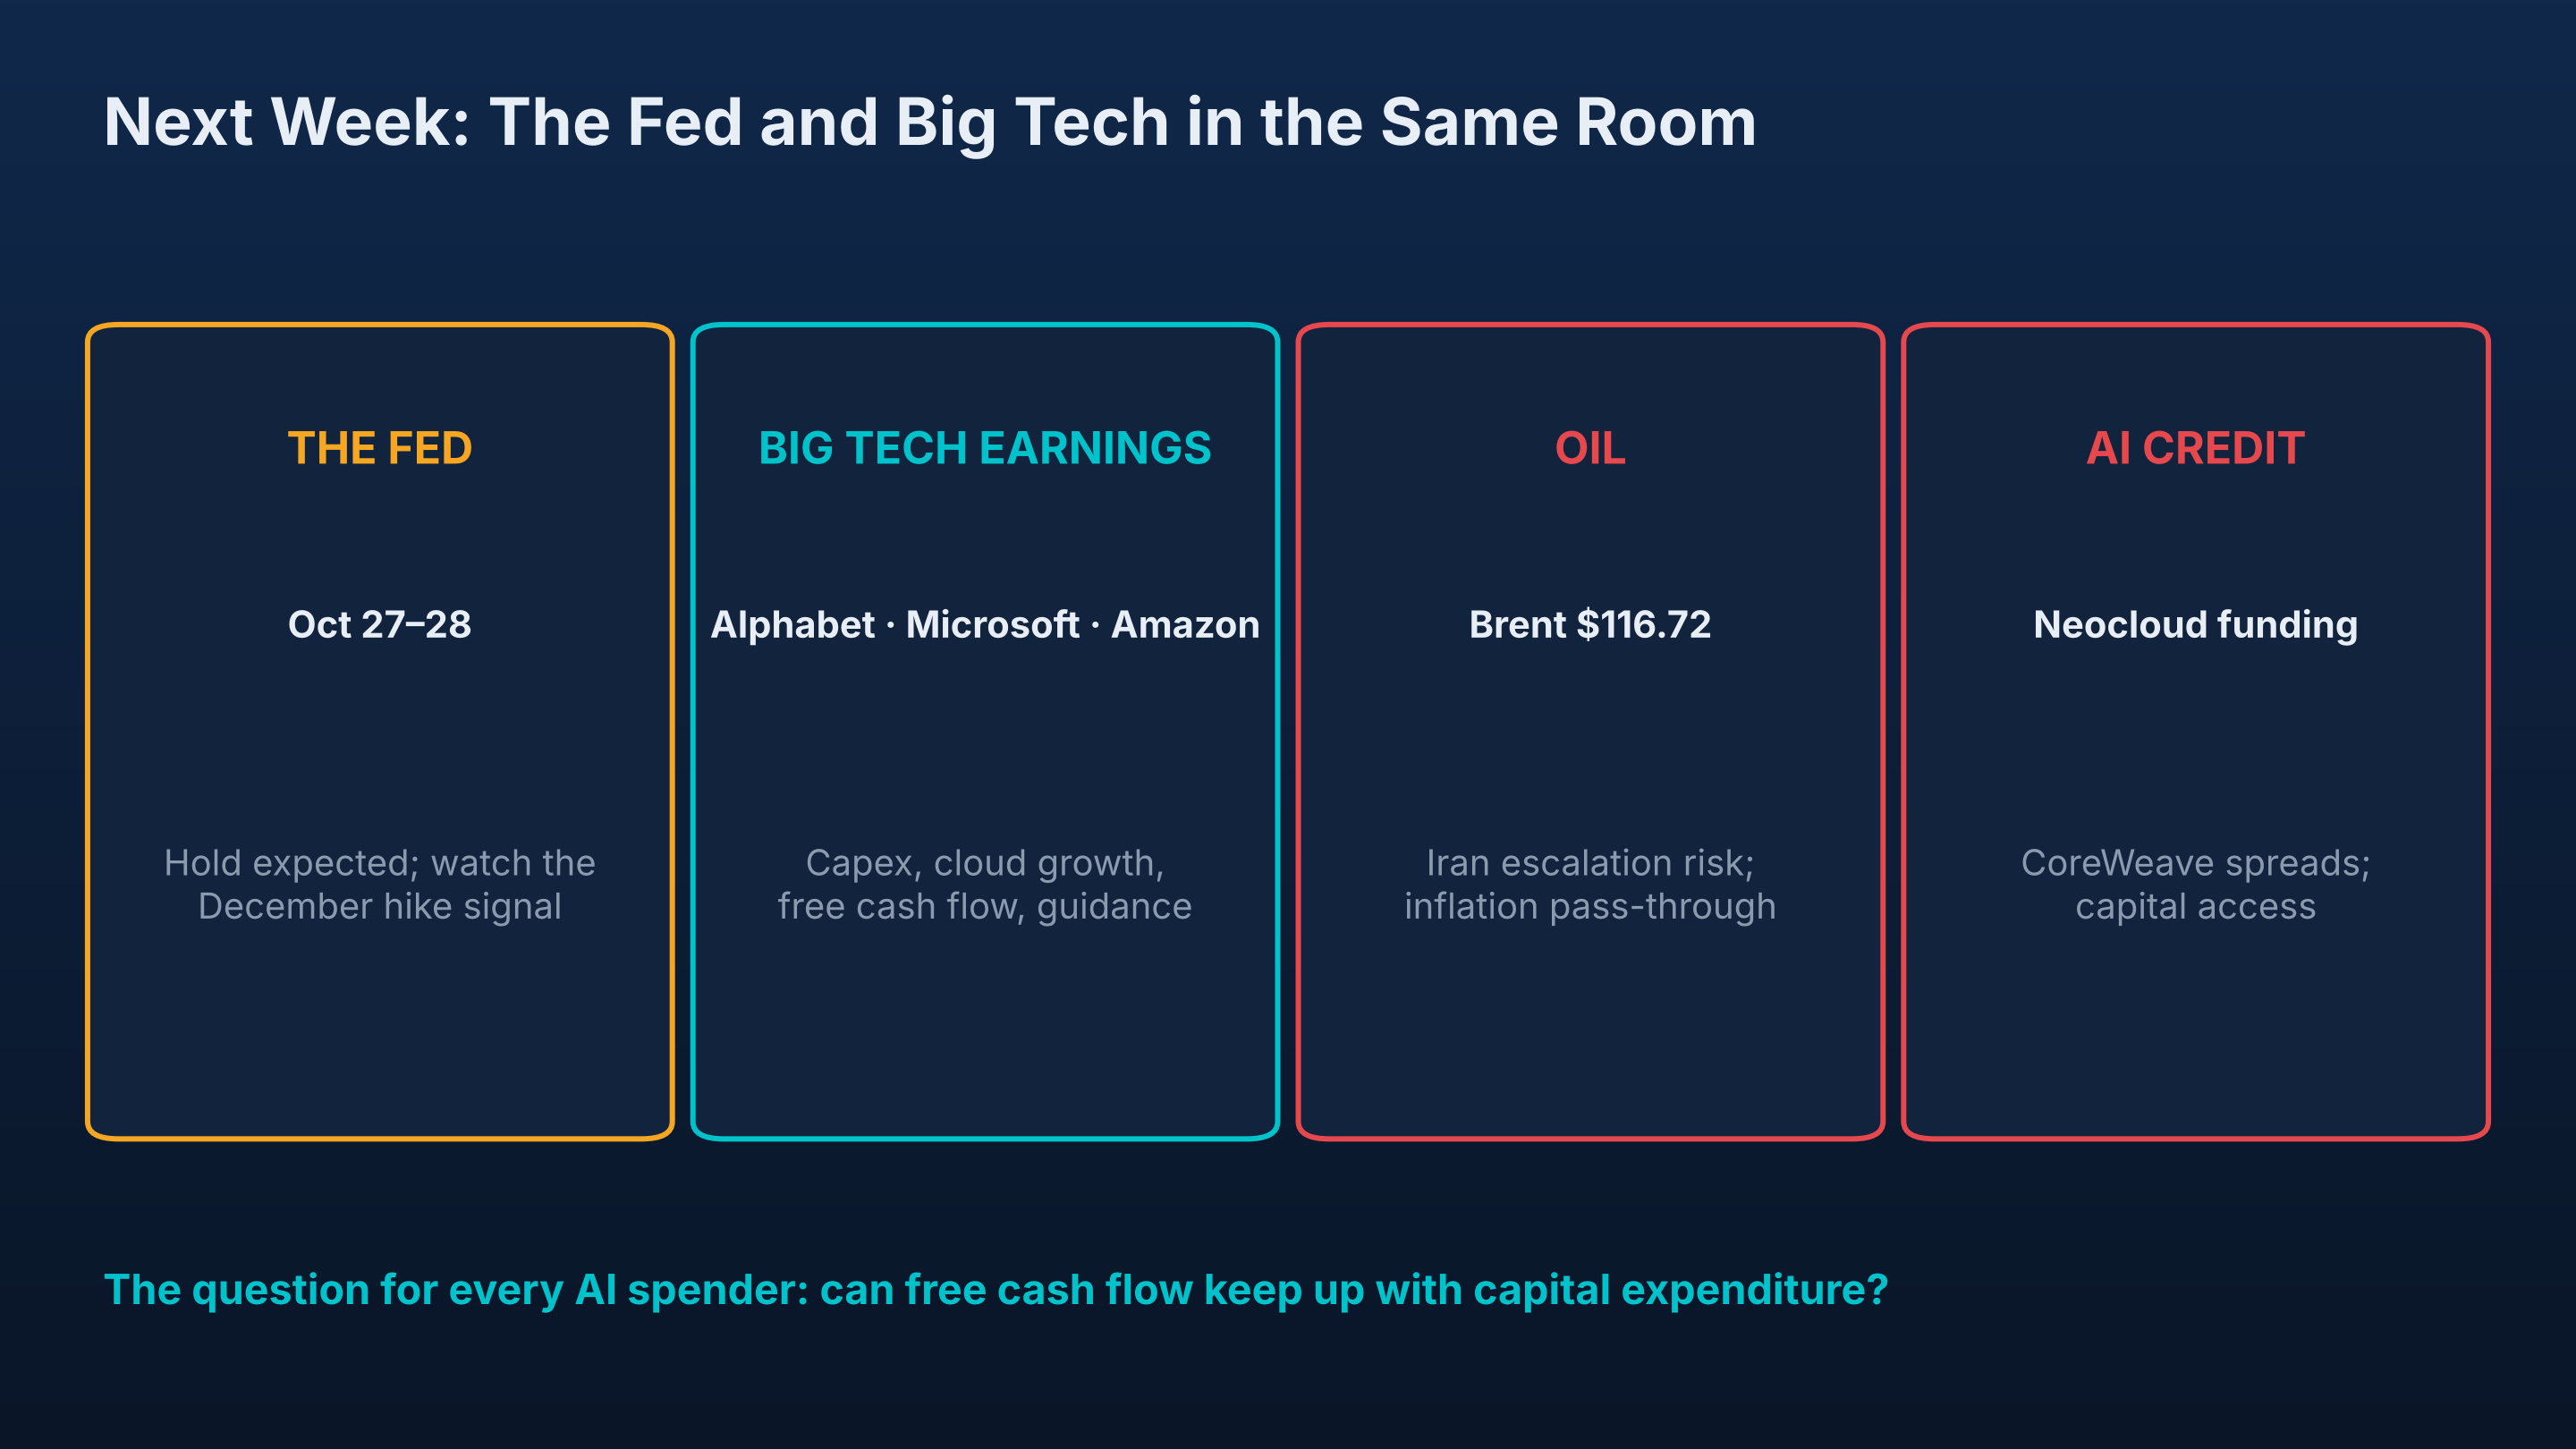
| Signal | Why it matters |
|---|---|
| The Fed, October 27–28 | A hold is expected; the December signal matters more with oil above $116 |
| Alphabet, Microsoft, Amazon earnings | Capex, cloud growth and free cash flow: does the cash keep up with the spending? |
| Oil and the Middle East | The fastest path to higher inflation and higher rates |
| AI credit | Neocloud bond spreads and access to capital |
| Volatility | If stress persists, risk models are entering the regime where they are least reliable |
The bottom line#↑ Contents
This week, the market began holding AI to a simple standard: show the cash. Meta's spending outran its cash flow and the stock fell 7%. SpaceX and Super Micro showed real returns and were rewarded.
Risk managers should apply the same standard to their own AI. A machine-learning risk model that looks excellent in calm markets has not proven anything until it has been tested in stress. My research shows that the standard backtest often cannot tell the difference.
The models that measure financial risk need the same scrutiny Wall Street is now applying to AI itself. A backtest that only looks at the average will pass the model that fails when it matters most.
Your take#
Should regulators require regime-conditional backtesting for AI-based risk models, or is the standard backtest good enough? Share your perspective in the comments.
Read the research
When Backtests Lie: A Governance-Grade Validation Framework for Machine-Learning Value-at-Risk Models under Regime Shifts (SSRN) papers.ssrn.com/sol3/papers.cfm?abstract_id=7652318 Replication code and data: github.com/nirajneupane17/ml-var-validation
Also by the author: Conditional Tail Episode Risk (SSRN) · Systemic Tail Episode Risk (SSRN)
About the author#
Niraj Neupane, CA (ICAI), is a quantitative researcher whose work focuses on validating machine-learning risk models and measuring path-dependent and systemic tail risk for financial institutions and regulators. He is the founder of Korvane, an AI-powered trade, risk and validation platform, and Calderyn Institute, which trains professionals in quantitative finance and AI engineering. ORCID: 0009-0003-7026-7026.
Views expressed are the author's own and do not represent any employer.
Sources#
Markets
- AP via La Nación, How major US stock indexes fared, Oct 19–23, 2026: https://www.lanacion.com.ar/usa/how-major-us-stock-indexes-fared-friday-10232026-nid23102026/
- Investing.com, Nasdaq posts worst day since June as AI financing worries batter risk sentiment (Oct 22, 2026): https://www.investing.com/news/stock-market-news/us-stock-futures-fall-as-investors-weigh-tesla-meta-earnings-4964498
- Benzinga, Meta sinks 6%, 10-year yield falls below 5% (Oct 22, 2026): https://www.benzinga.com/markets/equities/26/10/62539017/meta-ai-spending-10-year-yield-below-5-stock-market-today
- Trading Economics, Brent crude: https://tradingeconomics.com/commodity/brent-crude-oil/news/537190
Companies
- Crypto Briefing, Meta posts first negative free cash flow in over a decade: https://cryptobriefing.com/meta-negative-free-cash-flow-ai-spending/
- Tesla North, SpaceX Q3 2026 results: https://teslanorth.com/2026/10/20/spacex-q3-2026-results/
- Tradingpedia, Super Micro surges on upgraded AI revenue and margins: https://www.tradingpedia.com/2026/10/21/super-micro-surges-on-upgraded-ai-revenue-and-margins/
- 24/7 Wall St., Telecom stocks fall as SpaceX eyes 80,000 cell sites: https://247wallst.com/investing/2026/10/23/telecom-stocks-fall-as-spacex-eyes-80000-cell-sites-t-mobile-sinks-5-att-drops-4-verizon-slides-3/
Research
- Neupane, N. (2026). When Backtests Lie: A Governance-Grade Validation Framework for Machine-Learning Value-at-Risk Models under Regime Shifts. SSRN 7652318. https://papers.ssrn.com/sol3/papers.cfm?abstract_id=7652318 Code: https://github.com/nirajneupane17/ml-var-validation
- Neupane, N. (2026). Conditional Tail Episode Risk. SSRN 7502499.
- Neupane, N. (2026). Systemic Tail Episode Risk. SSRN 7534899.
- Board of Governors of the Federal Reserve System & OCC (2011). Supervisory Guidance on Model Risk Management, SR Letter 11-7.
- Baker Tilly, Updated interagency guidance on model risk management (SR 26-2, April 17, 2026): https://www.bakertilly.com/insights/updated-interagency-guidance-on-model-risk-management
- Bowman, M. W. (2026). Artificial intelligence in the financial system. Speech, May 1, 2026: https://www.federalreserve.gov/newsevents/speech/bowman20260501a.htm
- Basel Committee on Banking Supervision (1996). Supervisory Framework for the Use of "Backtesting" in Conjunction with the Internal Models Approach to Market Risk Capital Requirements.
- Kupiec, P. H. (1995). Techniques for verifying the accuracy of risk measurement models. Journal of Derivatives, 3(2), 73–84.
- Christoffersen, P. F. (1998). Evaluating interval forecasts. International Economic Review, 39(4), 841–862.