MARKETS · GOVERNANCE · CONCENTRATION · TAIL RISK · NEW RESEARCH
By Niraj Neupane, CA (ICAI) Quantitative Researcher, Korvane · Financial Economist, Calderyn Institute · Founder, Wall Street Feed
The week by the numbers#↑ Contents
| −12.7% | Nvidia's weekly decline, from $186.64 to $162.85 |
| ≈ $580B | Nvidia market value lost in five sessions (author's estimate) |
| +2.2% | S&P 500 for the same week |
| +13.3% | AMD on Monday, the day Nvidia fell 4.3% |
| −14% | Nvidia's intraday low on Thursday, the day its CEO resigned |
| 1st | The board's first-ever chairman, appointed the same day |
| 10–44% | How much Expected Shortfall models understate stress-regime losses, from my new SSRN paper |
Key takeaways
What happened. Nvidia's board opened an independent investigation on November 8. On November 12, Jensen Huang resigned as CEO and director, effective immediately. CFO Colette Kress became interim CEO, and Harvey C. Jones became the board's first-ever chairman.
The paradox. Nvidia fell about 12.7% for the week. The S&P 500 rose 2.2%, the Nasdaq 1.9% and the Dow 1.8%.
What the market decided. It priced a company-specific governance shock, not a verdict on AI demand. Money stayed in AI and moved to Nvidia's rivals.
What the market and its models may be missing. Key-person risk at the center of the AI supply chain is not fully idiosyncratic, and it is invisible to any risk model calibrated on return history. My new paper, When the Tail Lies Too, now live on SSRN, shows that even for ordinary market stress, the capital measure banks rely on understates losses by 10% to 44% exactly when it matters most.
What's in this report#
- The week by the numbers
- 1. Five sessions, one timeline
- 2. The rotation: the money stayed in AI
- 3. From one trade to a stock-specific shock
- 4. The index arithmetic: concentration cuts both ways
- 5. Key-person risk: what the market is actually pricing
- 6. What the risk models could not see
- 7. New research: When the Tail Lies Too
- 8. The case against my reading
- 9. The macro backdrop: a rebound against rising rates
- 10. What to watch
- The bottom line
1. Five sessions, one timeline#↑ Contents
| Date | Event | Nvidia | Market |
|---|---|---|---|
| Fri Nov 6 | Prior close | $186.64 (≈ $4.54T) | |
| Sun Nov 8 | Board announces an independent investigation, overseen by independent directors with outside counsel; says it has no reason to believe national security or company secrets were compromised | ||
| Mon Nov 9 | First trading day after the announcement | −4.27% to $178.67 | S&P 500 +2.35%, best day since April 8 |
| Tue Nov 10 | October CPI hotter than expected; 10-year briefly tops 5% | 2-year yield +17bp | |
| Thu Nov 12 | Huang resigns as CEO and director; Kress named interim CEO; Harvey C. Jones named first-ever chairman; search for a permanent CEO opens | down as much as 14% intraday; closed down more than 4% at $166.19 | indexes lower |
| Fri Nov 13 | −2.0% to $162.85 (≈ $3.96T) | S&P 500 −0.75% | |
| Week | ≈ −12.7%, about $580 billion of market value | S&P 500 +2.2% |
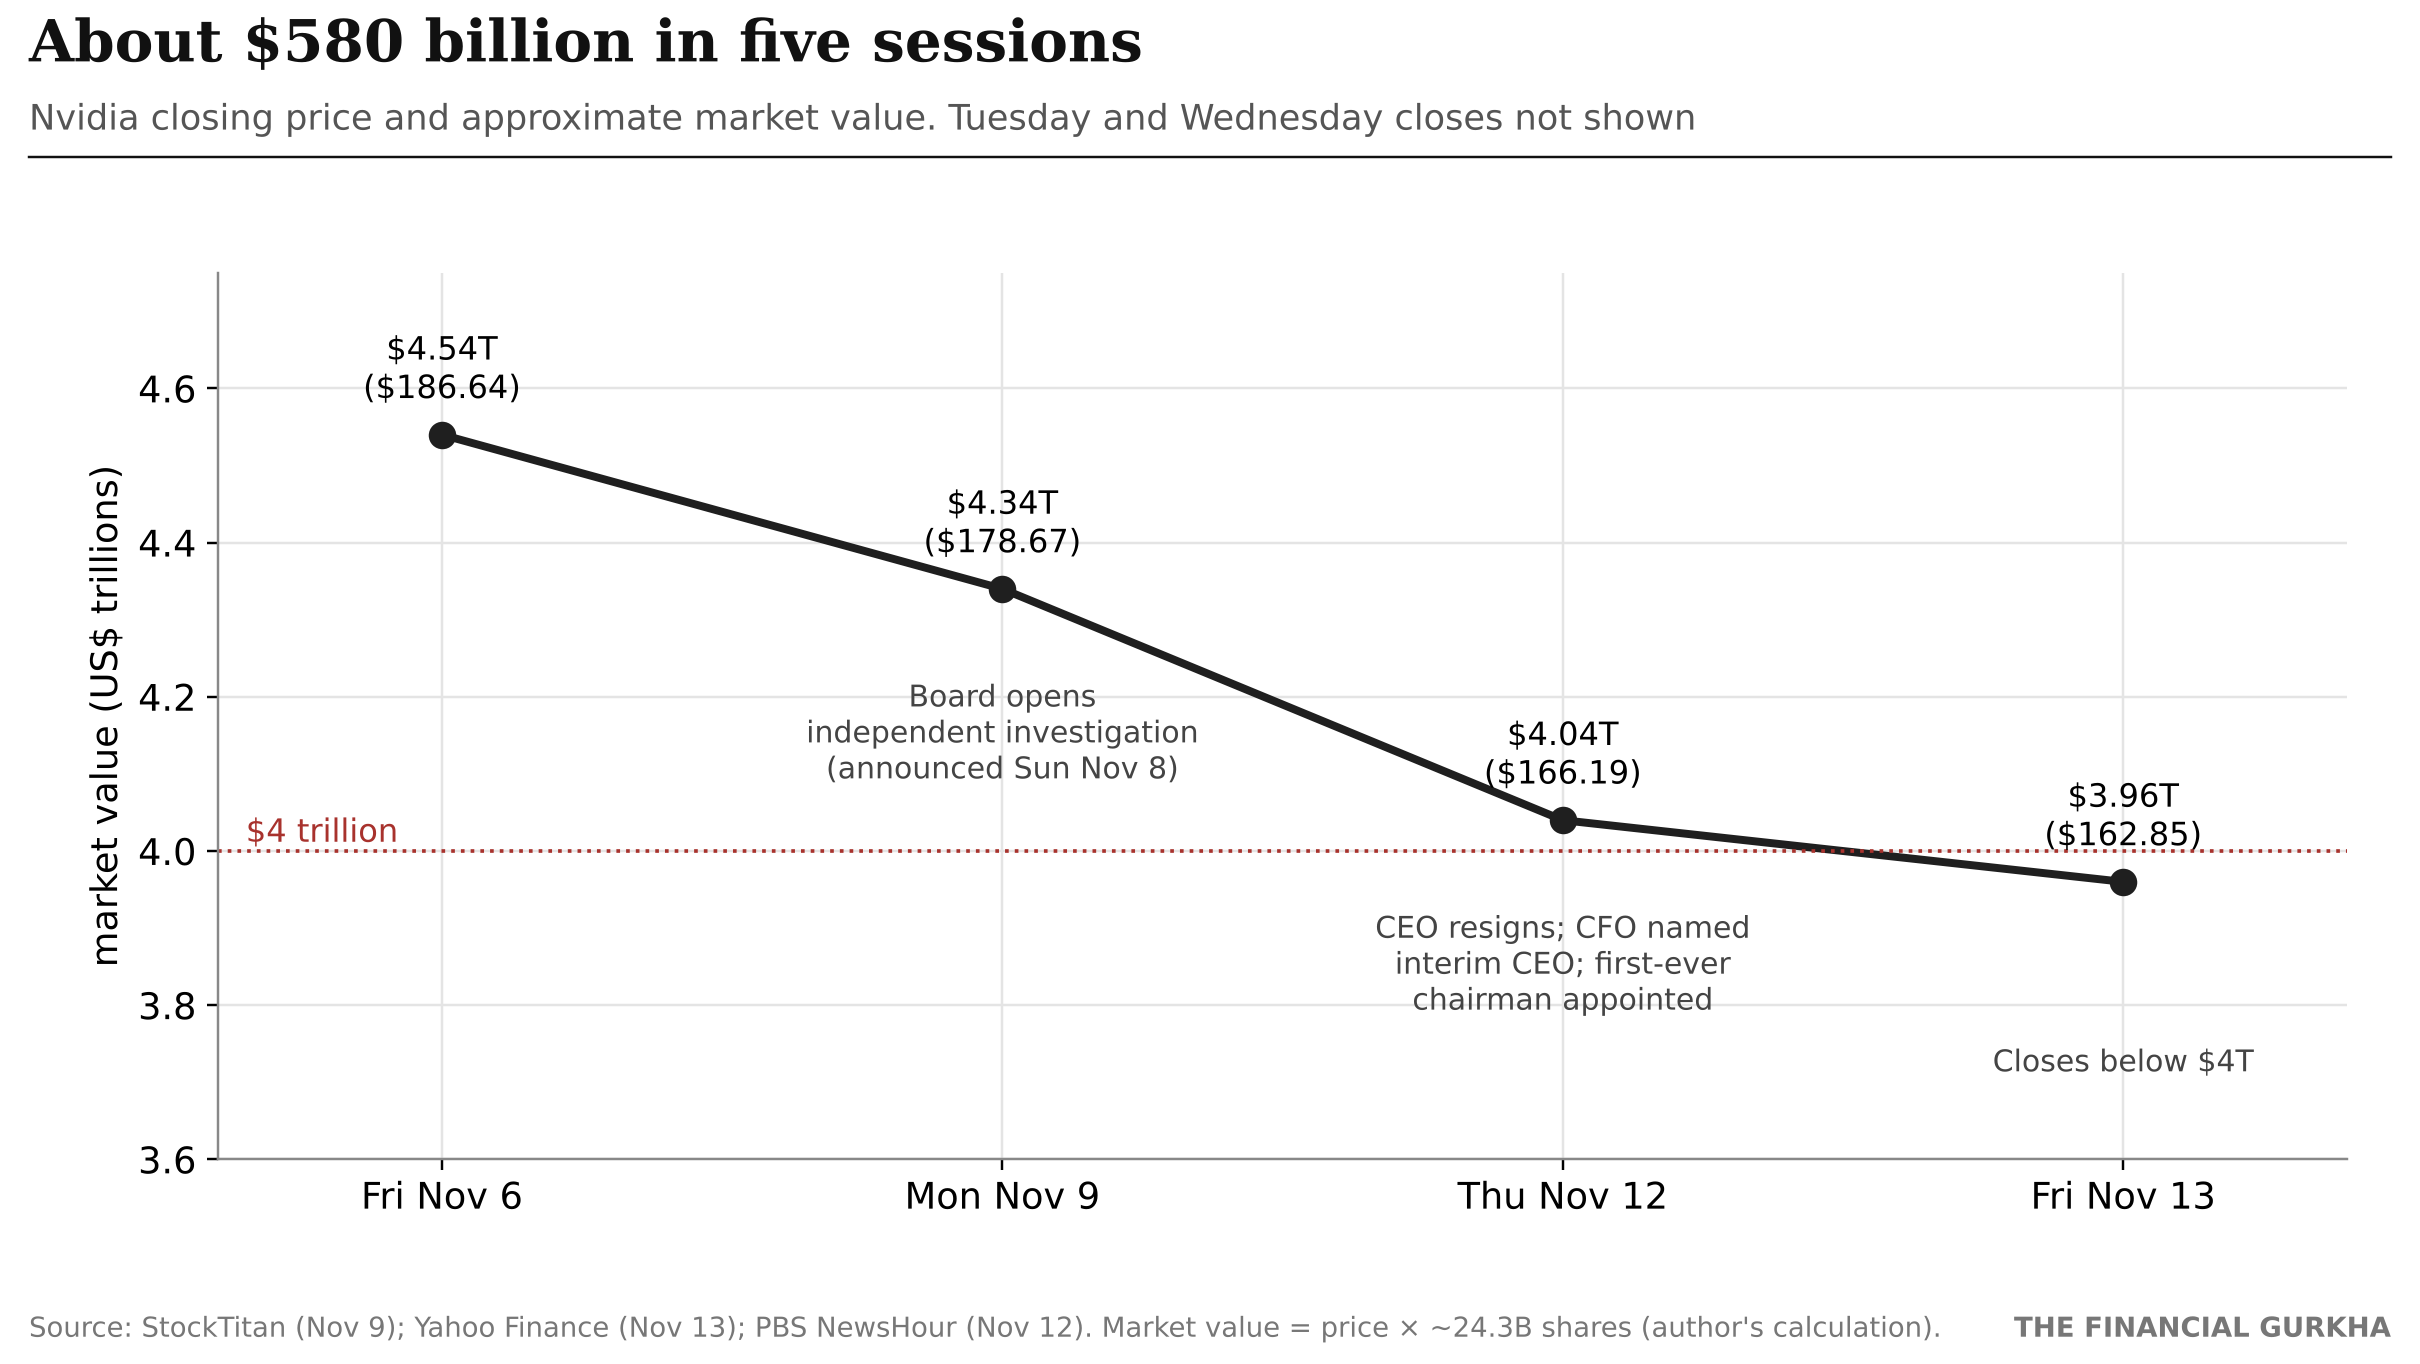
Market value is the author's estimate: closing price × about 24.3 billion shares outstanding.
For context, the value Nvidia lost in five sessions is larger than the entire market value of the vast majority of S&P 500 companies. And yet the index rose.
2. The rotation: the money stayed in AI#↑ Contents
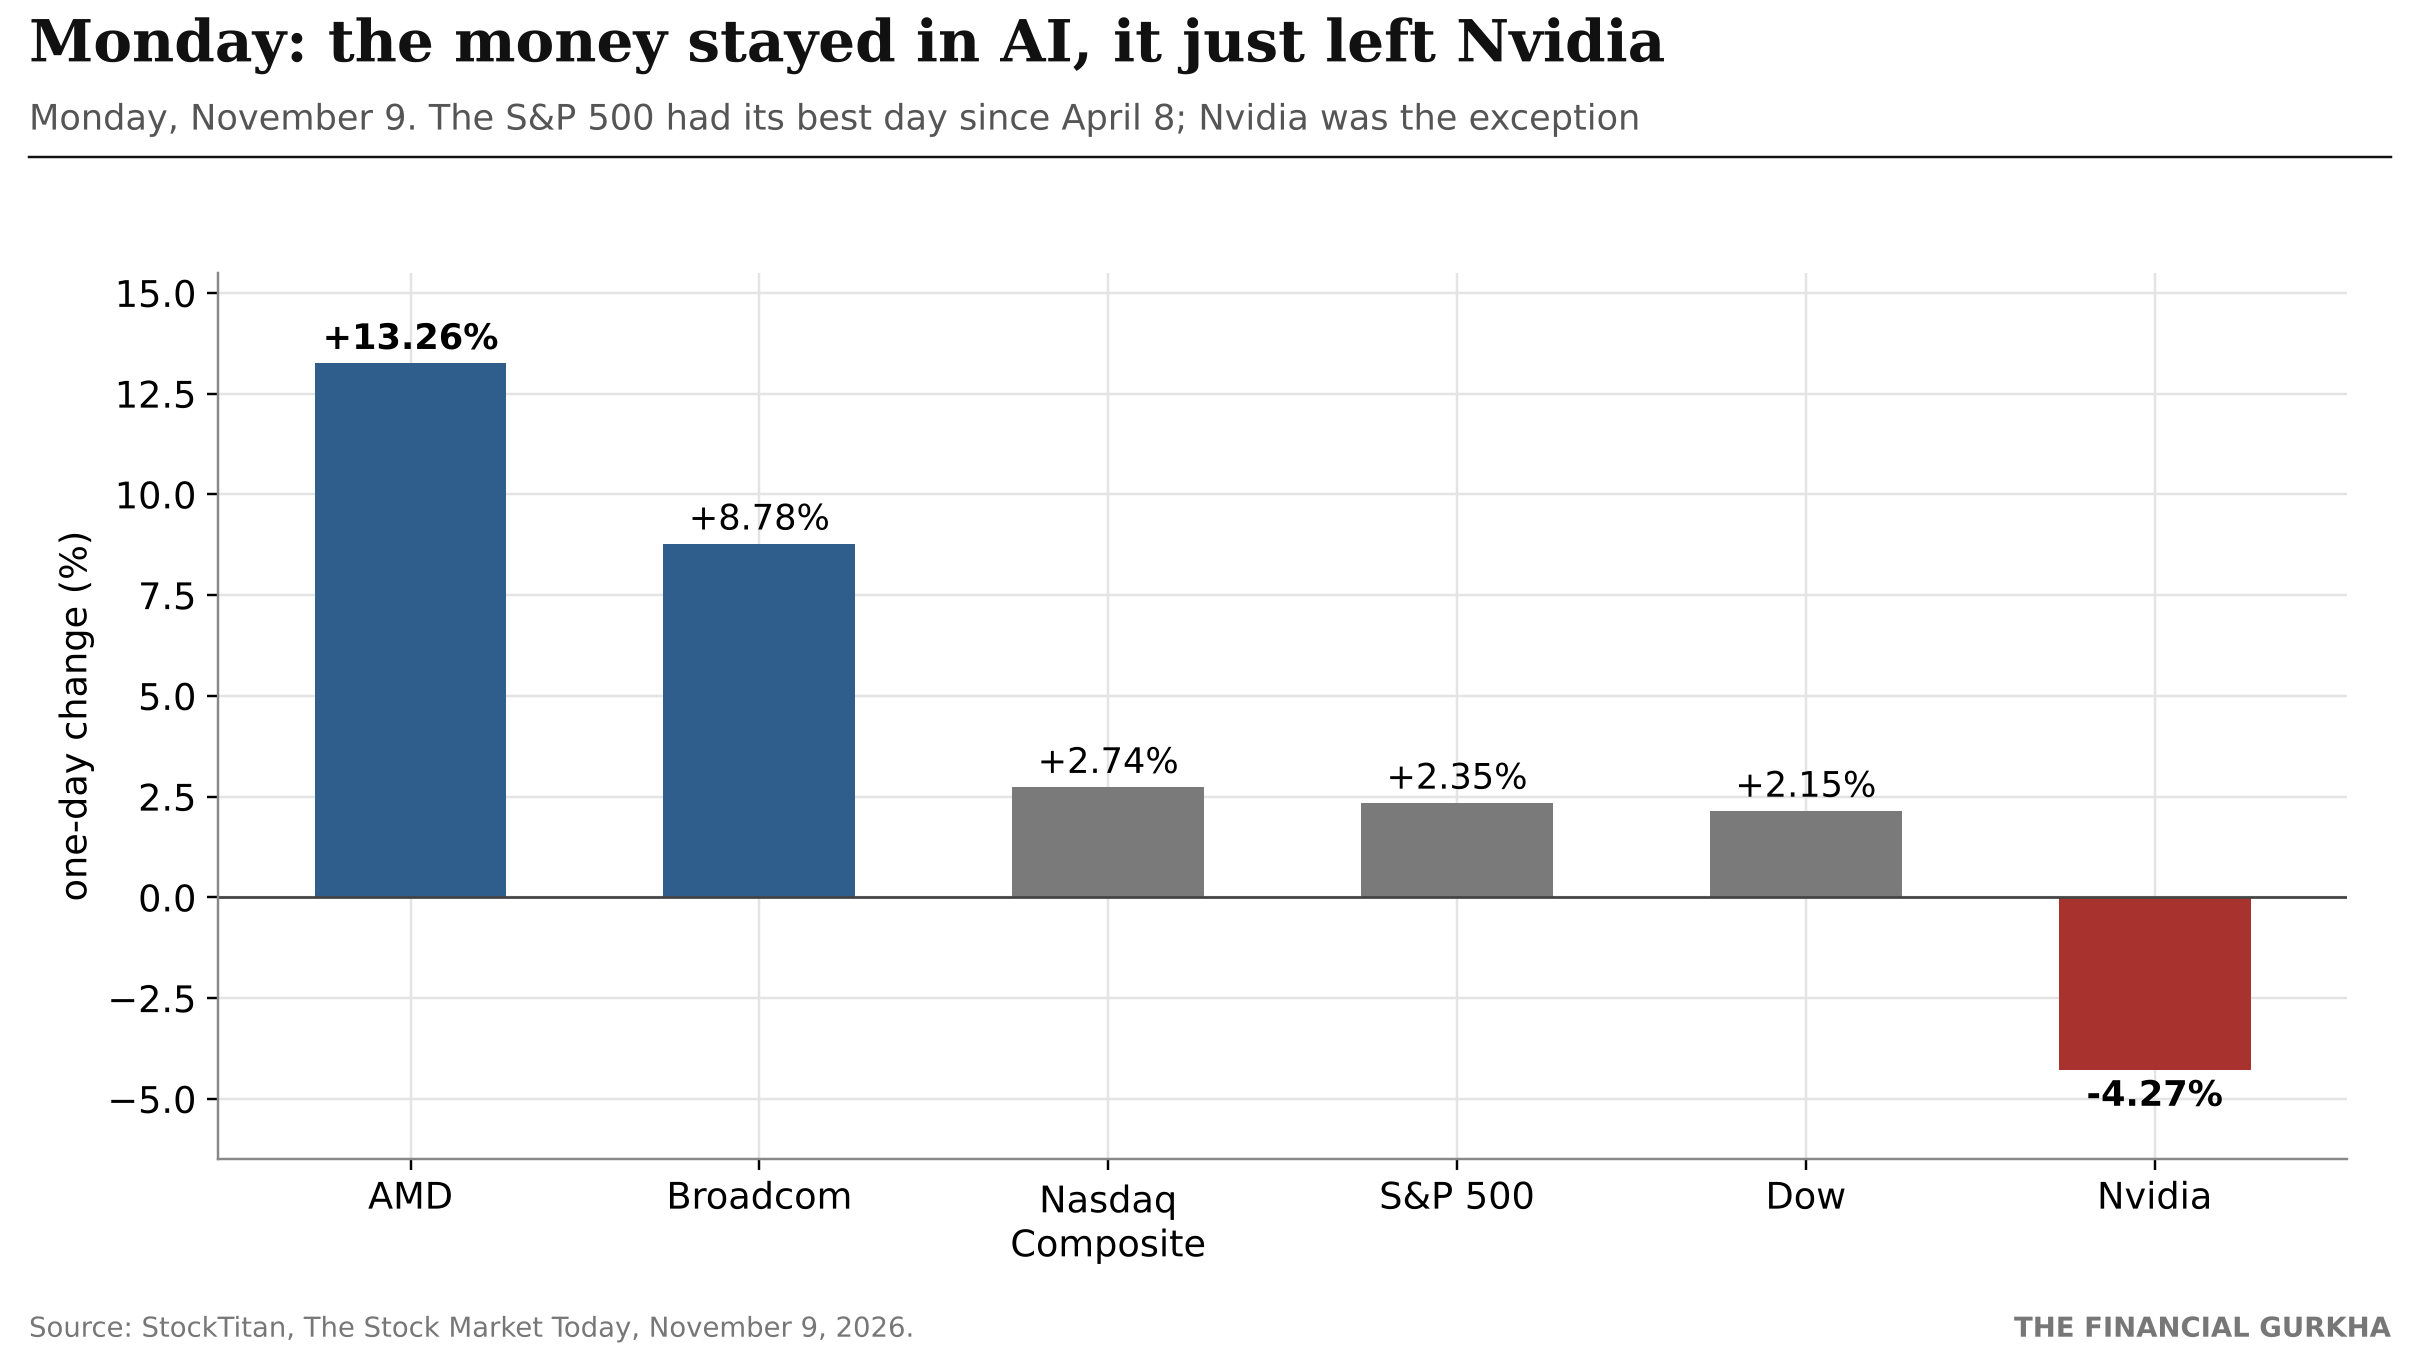
| Monday, Nov 9 | One-day change |
|---|---|
| AMD | +13.26% |
| Broadcom | +8.78% |
| Nasdaq Composite | +2.74% |
| S&P 500 | +2.35% |
| Dow | +2.15% (+1,104 points) |
| Nvidia | −4.27% |
This is the single most informative day of the week. If investors had read the Nvidia news as a threat to AI demand, Nvidia's closest competitors should have fallen with it. Instead, AMD had one of its best days of the year and Broadcom rose nearly 9%.
The market drew a clear line: the AI build-out is intact; the question is who captures it. Every dollar of hyperscaler spending that is now slightly less certain to flow to Nvidia is, at the margin, a dollar that could flow to AMD's accelerators or Broadcom's custom chips. Monday's tape was that thought, priced in one session.
That reading has a weak point, which I return to in Section 8: by Friday, AMD was down about 9% on the day, along with the rest of the chip group. The rotation was real, but it was not a safe harbor.
3. From one trade to a stock-specific shock#↑ Contents
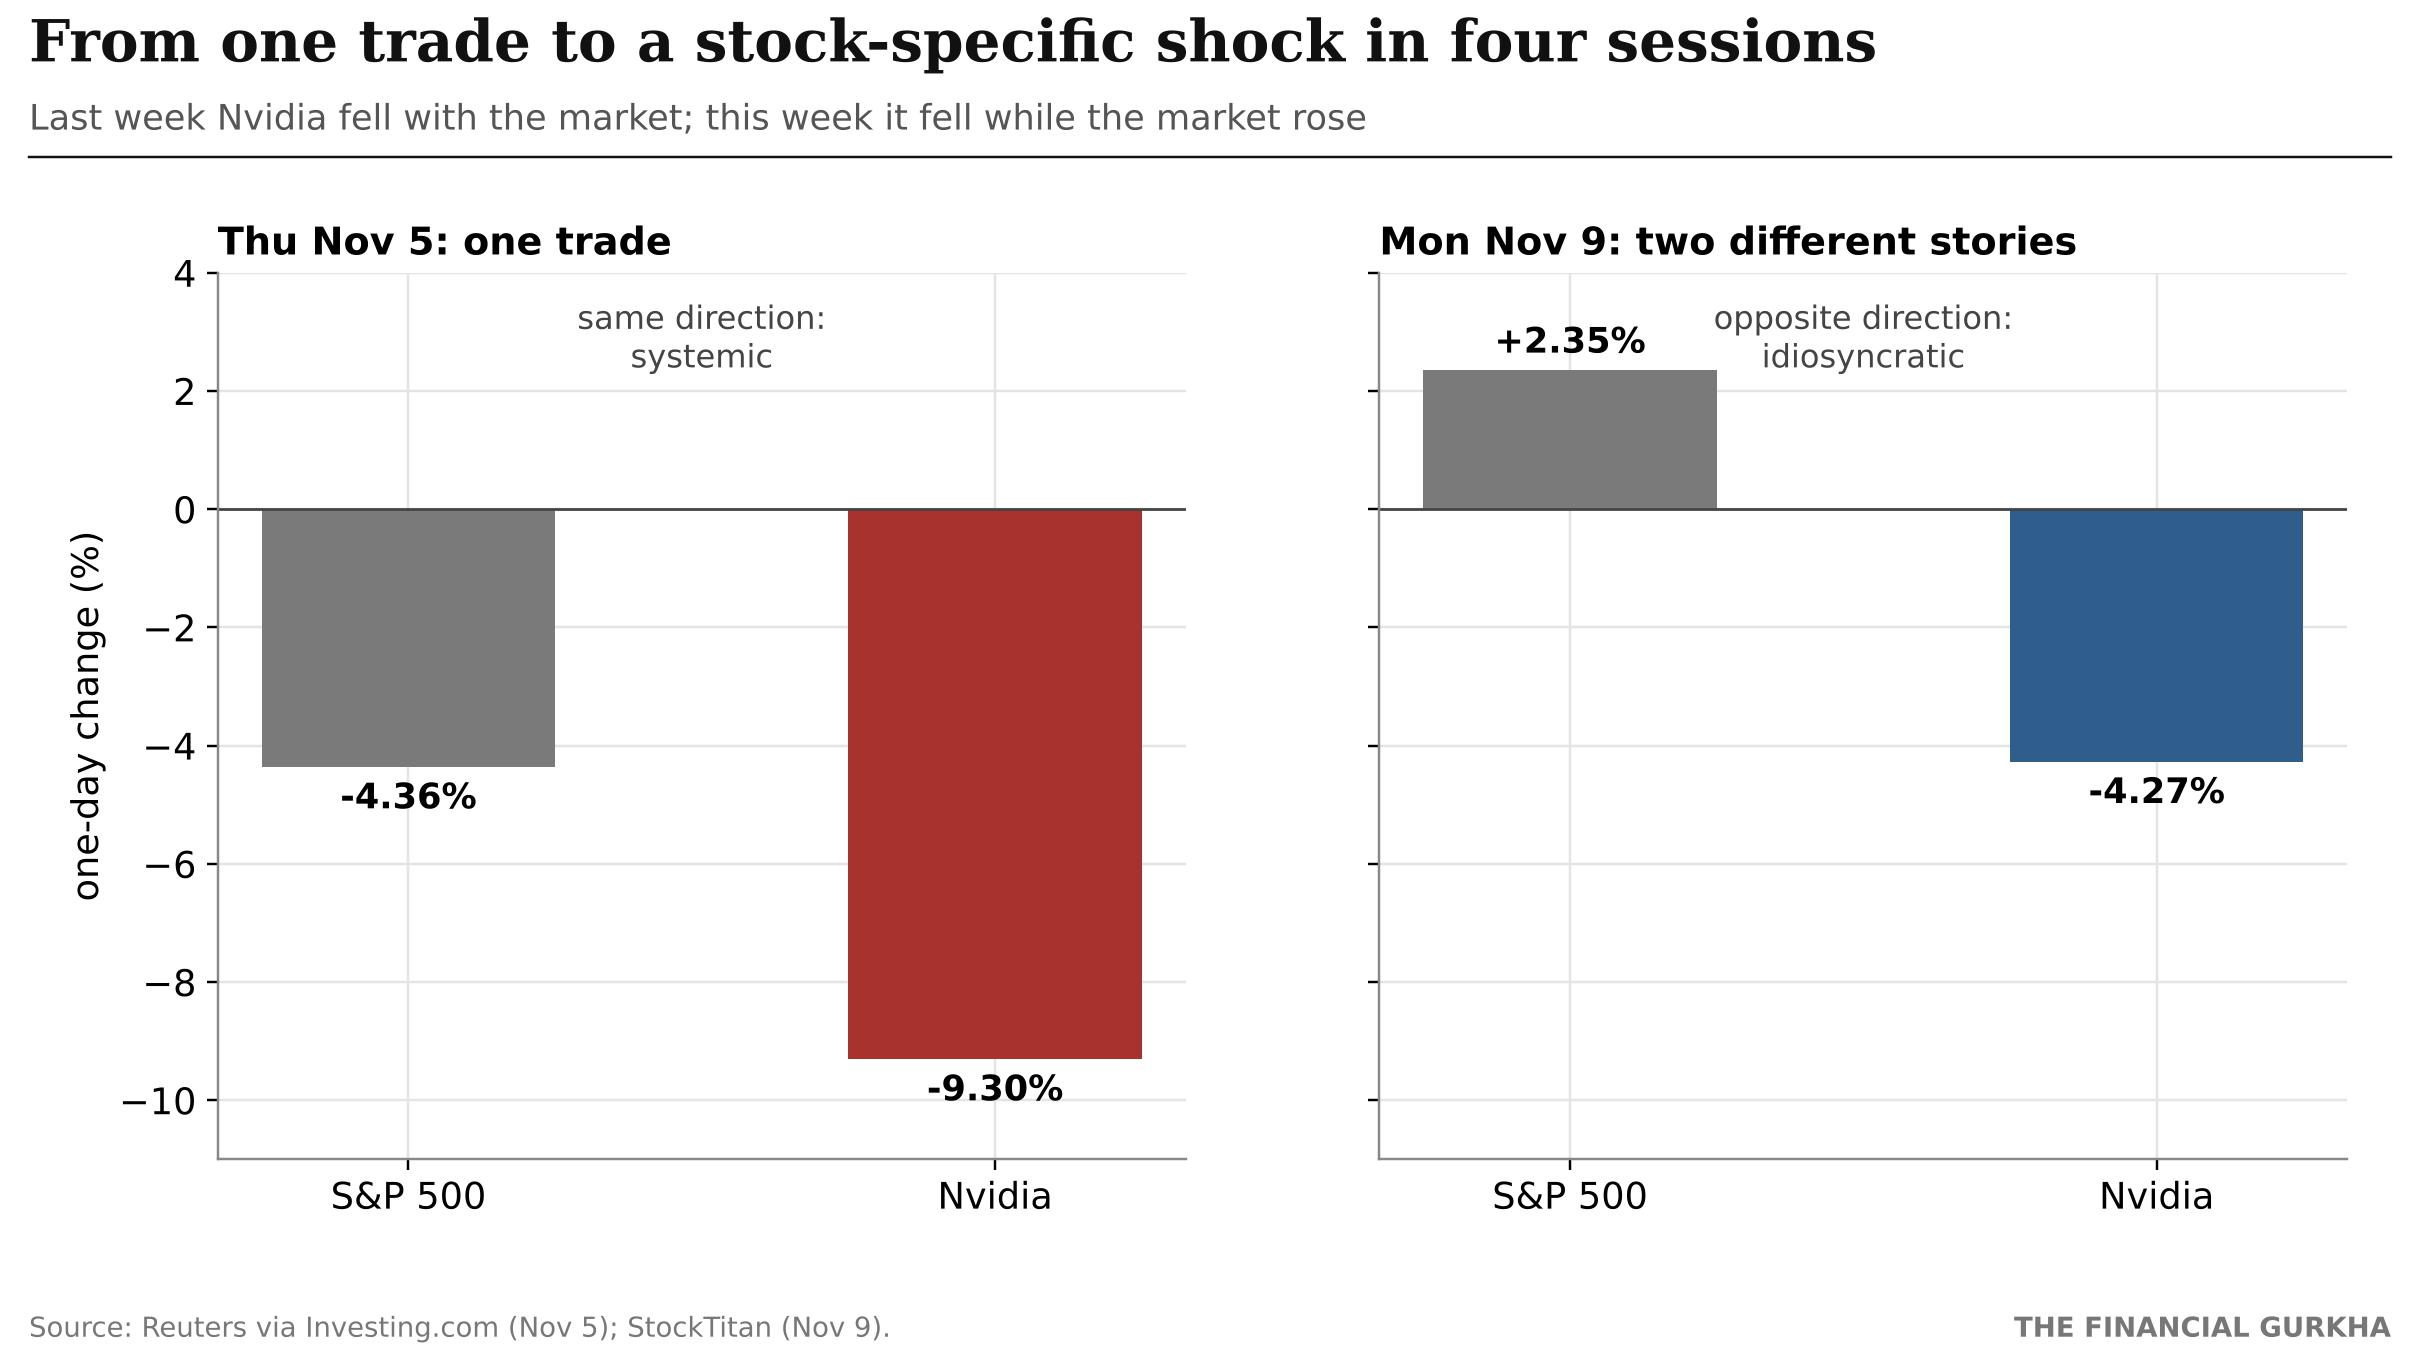
| Thursday, Nov 5 | Monday, Nov 9 | |
|---|---|---|
| S&P 500 | −4.36% | +2.35% |
| Nvidia | −9.3% | −4.27% |
| Relationship | Same direction: systemic | Opposite direction: idiosyncratic |
Last week, in the chip crash, the whole AI complex fell together: memory makers, chip designers, data-center operators and power suppliers behaved as one asset, the signature of a crowded, systemic unwind. This week, Nvidia decoupled from the market entirely.
That is the distinction at the heart of my paper Systemic Tail Episode Risk (STER). A tail event is systemic when it is broad and persistent across assets, and idiosyncratic when it stays confined to one name while the market carries on. They need opposite responses. A systemic episode calls for cutting gross exposure, because diversification has failed. An idiosyncratic one calls for managing single-name concentration, because diversification is working.
Within one week, the same stock moved from the first category to the second. Applying the same risk playbook to both is a category error.
4. The index arithmetic: concentration cuts both ways#↑ Contents
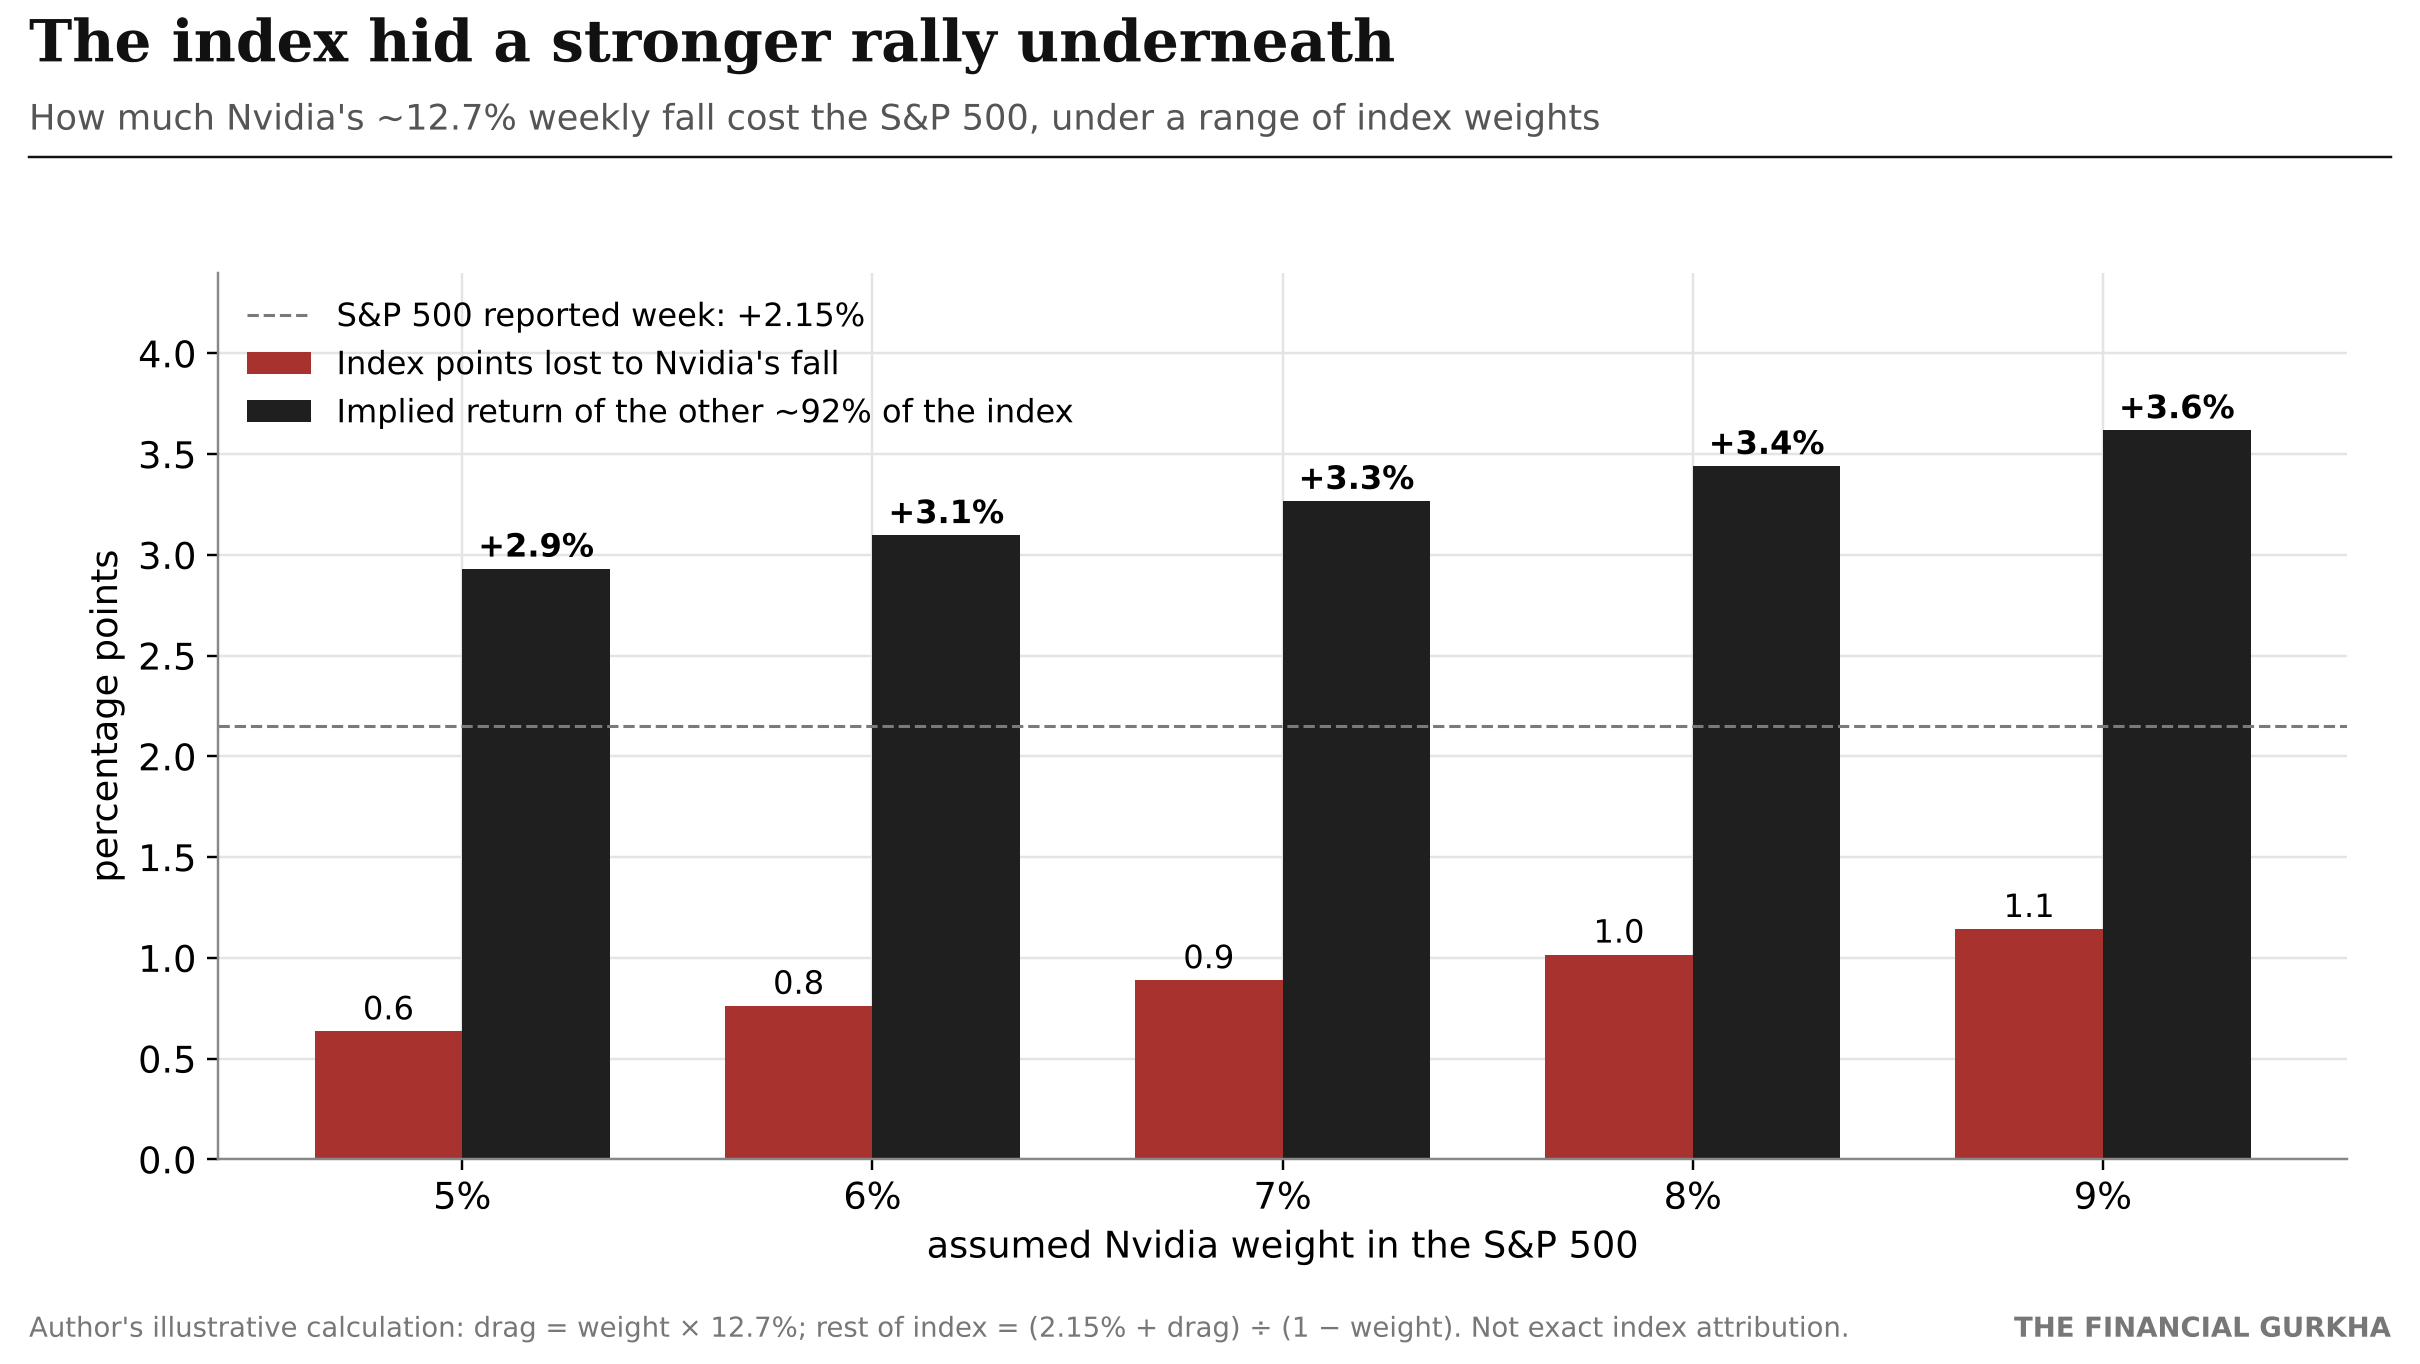
| Assumed Nvidia weight | Drag on the index | Implied return of the rest of the index |
|---|---|---|
| 5% | −0.6 pt | +2.9% |
| 7% | −0.9 pt | +3.3% |
| 9% | −1.1 pt | +3.6% |
Author's illustrative calculation: drag = weight × 12.7%; rest of index = (2.15% + drag) ÷ (1 − weight). Not an exact index attribution.
At any plausible weight, the rest of the market rose by roughly 3% or more. The headline index number understated the breadth of the rebound.
This is the uncomfortable side of concentration. For two years Nvidia's weight amplified gains for anyone holding the S&P 500. This week it worked in reverse: a passive investor absorbed a governance shock in a single company without ever choosing to take that risk. When one company can move the index by a full percentage point in a week on leadership news, "owning the market" is less diversified than it appears.
5. Key-person risk: what the market is actually pricing#↑ Contents
The question is not about any individual. It is how much of a $4 trillion company's value depends on one person, and whether that dependency was visible beforehand.
| Structural fact | Why it matters |
|---|---|
| Founder-CEO since 1993; more than 30 years in the role | Strategy, culture and customer relationships were built around one leader |
| More than 60 executives reportedly reported directly to the CEO | An unusually flat structure concentrates decisions at the top |
| No publicly designated successor | The board named an interim CEO and opened a search on the same day |
| First-ever board chairman appointed on Nov 12 | Until this week, an independent chair and the founder-CEO were not separated |
| About 3.6% ownership, no special voting rights | Influence came from the role and board support, not from control of votes |
What is replaceable, and what is not.
- Likely durable: the product pipeline already in development, the CUDA software ecosystem that locks in developers, contracted backlog with hyperscalers and the manufacturing relationship with TSMC.
- Harder to replace: the CEO's role as the industry's chief negotiator and technical evangelist, his relationships with the heads of the largest customers, and the speed of decisions a single trusted leader allows.
- The interim choice signals continuity, not vision. Kress has been CFO since 2013, a period in which annual revenue grew from about $4.1 billion to about $216 billion, and she is well regarded on Wall Street. A CFO-led transition reassures on discipline, not on product strategy, and the board has said it will consider external candidates.
The 12.7% discount can be read as the market's estimate of a "founder premium" removed, plus a risk premium for an open-ended search. Whether that is too much or too little depends on a question no one can answer yet: who leads the company in 2027, and how quickly?
6. What the risk models could not see#↑ Contents
This is where the week connects to my research, and where I think the most important lesson lies.
6.1 A governance shock arrives as a jump, not as volatility#
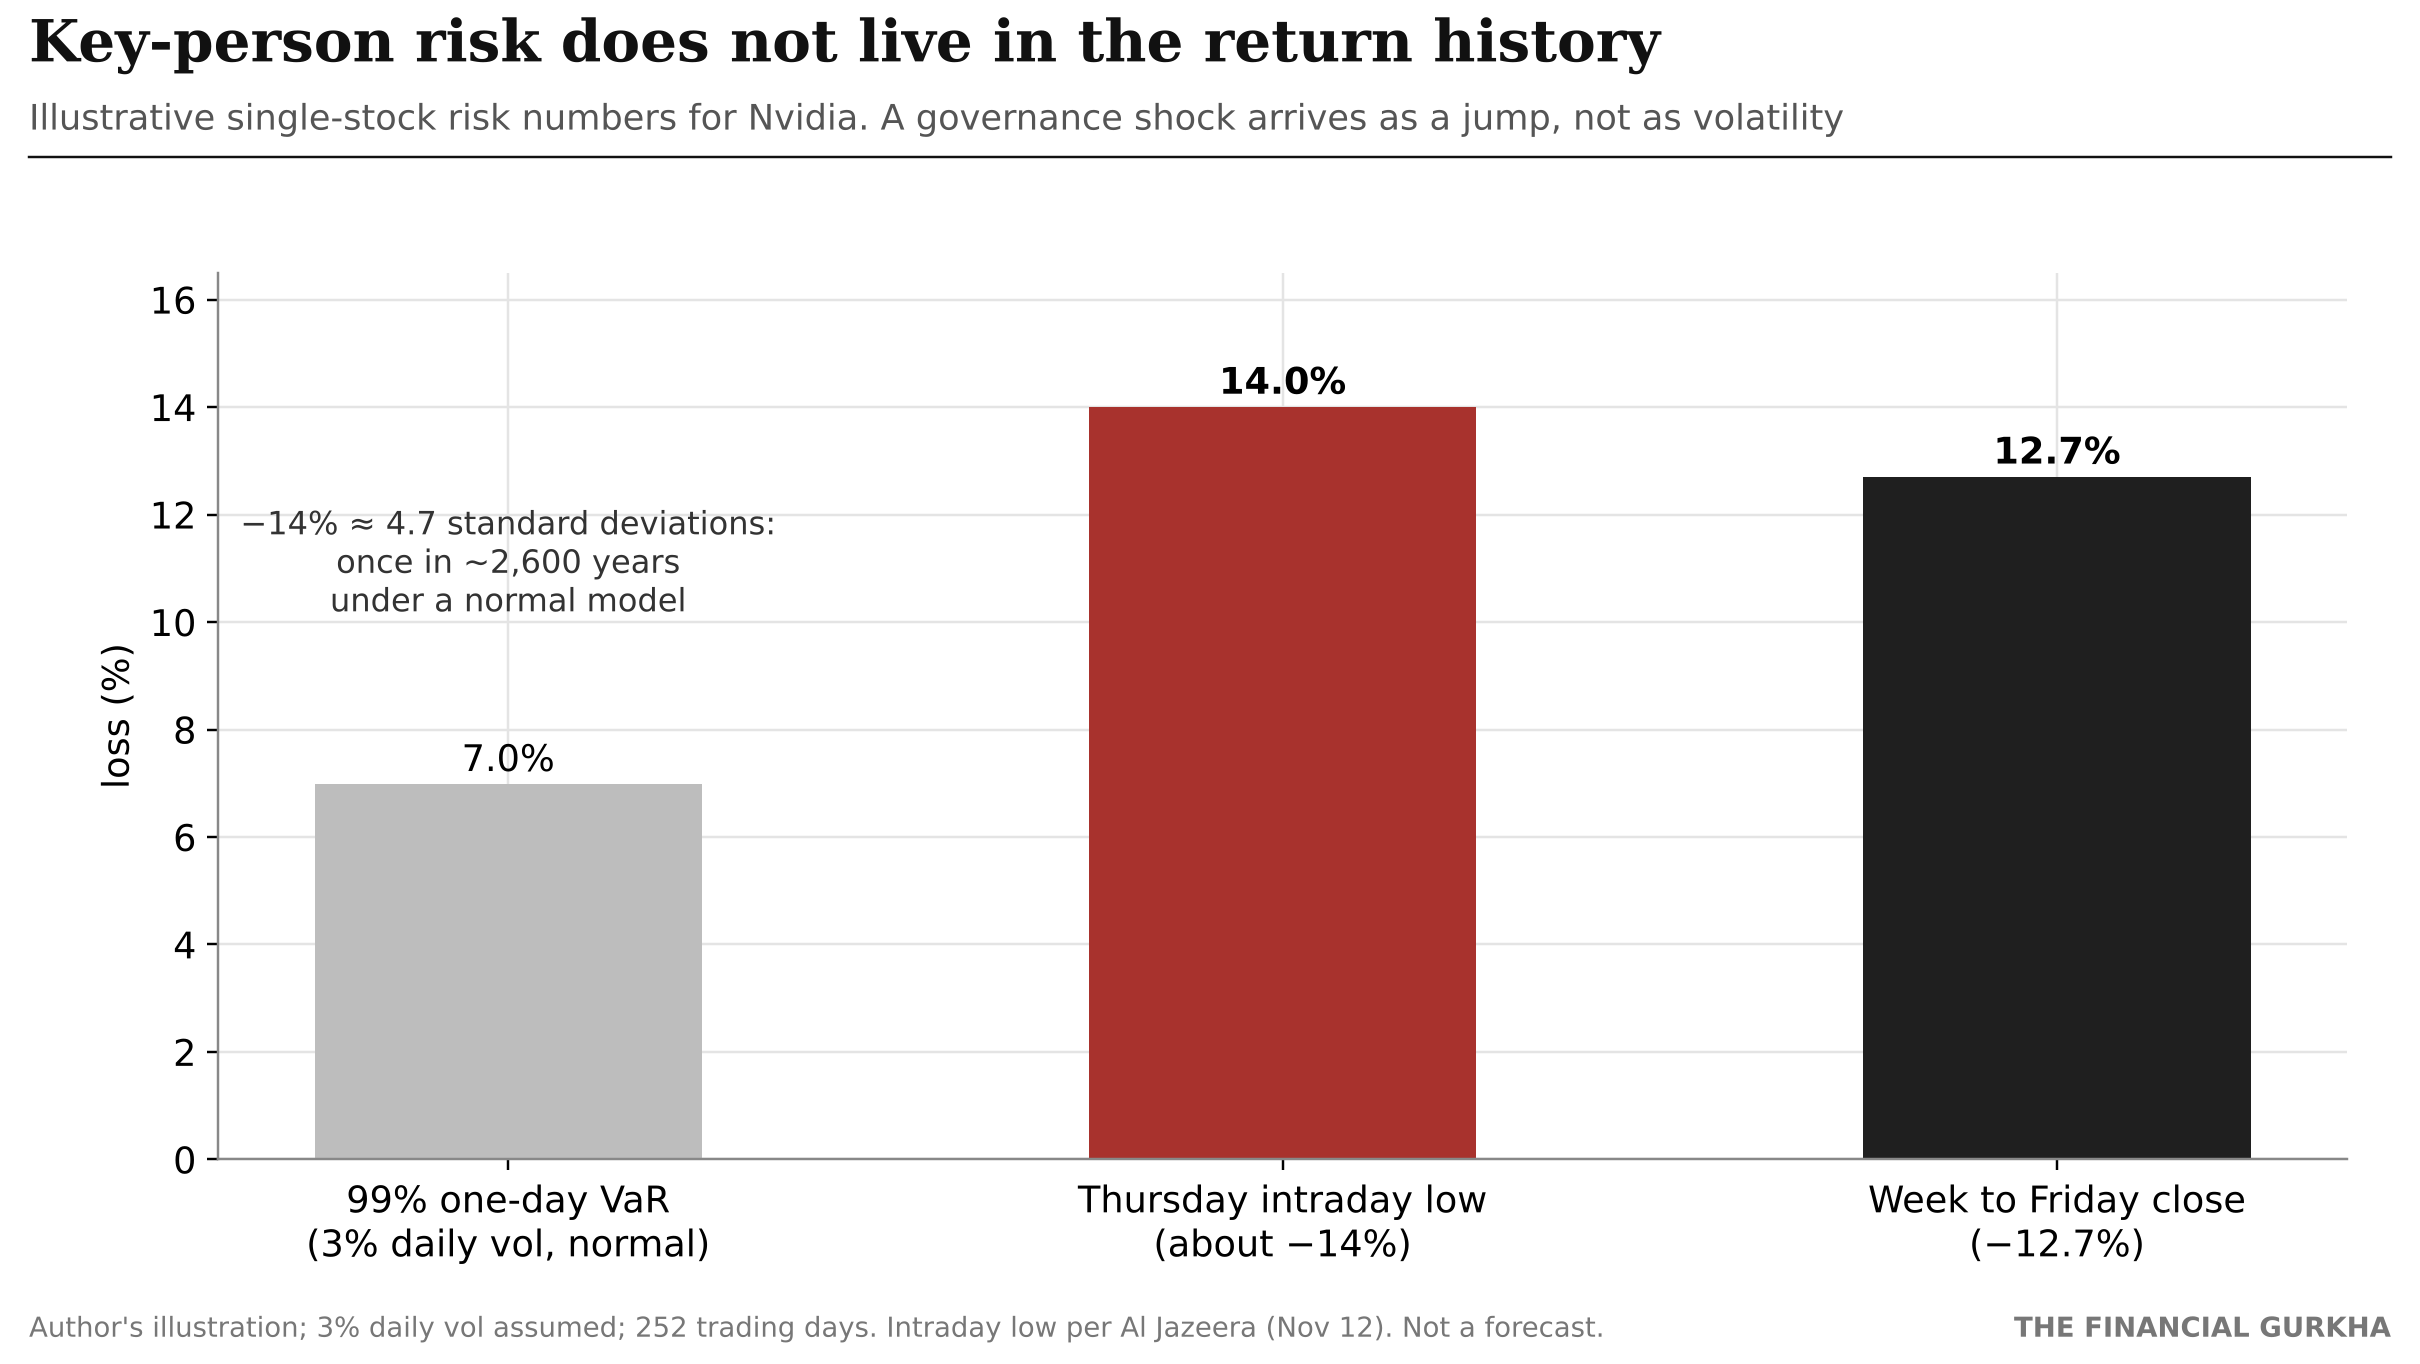
Suppose a risk desk models Nvidia with about 3% daily volatility. Under a normal distribution:
| Measure | Value | On a $500M position |
|---|---|---|
| 99% one-day VaR | 7.0% | $35M |
| 97.5% one-day Expected Shortfall | 7.0% | $35M |
| Thursday's intraday low | ≈ −14% | ≈ $70M, twice the ES |
| Implied frequency of a −14% day | about once every 2,600 years |
Author's illustration; the 3% volatility is an assumption. Not a forecast.
The deeper problem is not the distribution. This risk does not exist in the return history at all. Nvidia had never lost its founder-CEO. No backtest, however long, contains that event. A model can learn volatility, fat tails and even regime shifts that have happened before. It cannot learn a structural break with no precedent.
6.2 Frequency: models break more often in a regime shift#
In When Backtests Lie, I show that entering a stress regime multiplies the odds of a VaR breach by 4.80 for historical simulation and 3.49 for a machine-learning model on the S&P 500, while full-sample backtests make the same models look acceptable. For a single stock hit by a governance shock, the regime switch is instant: the stock goes from "mega-cap compounder" to "company in leadership transition" overnight, and every parameter estimated before that day describes a different company.
7. New research: When the Tail Lies Too#↑ Contents
My new paper is now live on SSRN:
When the Tail Lies Too: Governance-Grade Backtesting of Expected Shortfall under Regime Shifts Niraj Neupane, CA (ICAI) · November 2026 SSRN: papers.ssrn.com/sol3/papers.cfm?abstract_id=7689721 > Replication code and data: github.com/nirajneupane17/es-backtesting
When Backtests Lie asked how often risk models fail in stress. This paper asks the sharper, capital-relevant question: when they fail, do they correctly measure how bad the loss is?
7.1 The gap at the center of bank capital#
Under the Basel III Fundamental Review of the Trading Book (FRTB), market-risk capital is built on the 97.5% Expected Shortfall (ES), the average loss on the worst 2.5% of days. ES replaced 99% Value-at-Risk because VaR says where the tail starts, not how deep it goes.
But ES has a technical property that matters enormously: it is not elicitable on its own (Gneiting, 2011). In plain terms, there is no simple scoring rule that checks an ES forecast against outcomes the way exceedance counting checks VaR. It can only be evaluated jointly with VaR (Fissler and Ziegel, 2016). So supervisors backtest the accompanying VaR instead.
The number that sets capital is the least directly validated number in the framework.
| Value-at-Risk | Expected Shortfall | |
|---|---|---|
| What it measures | Where the tail starts | How deep the tail goes |
| Role under FRTB | Backtested for model approval | Sets capital |
| Directly backtestable on its own | Yes (count breaches) | No |
| Question it answers | How often? | How bad? |
7.2 What the paper tests#
- Data: daily 2000–2026 for six assets across four asset classes: S&P 500, Nasdaq, long Treasuries, EUR/USD, USD/JPY and Bitcoin.
- Models: four ES forecasters: historical simulation, Gaussian, GARCH-t and a gradient-boosted (machine-learning) quantile ES. All are walk-forward on a 500-day rolling window, so no future information enters a forecast.
- Regimes: stress is defined point-in-time when trailing realized volatility exceeds its expanding 80th percentile, cross-checked against the VIX and two Federal Reserve financial-stress indices.
- Tests: the Acerbi–Székely and McNeil–Frey ES backtests, a new regime-conditional severity ratio, Λ_ES, and a formal regression test of the regime effect.
The key quantity is simple: Λ_ES = average realized tail loss ÷ average predicted ES, within a regime. A value of 1.00 is correct. A value of 1.34 means realized losses on bad days were 34% larger than the model said.
7.3 Finding 1: calm days look fine; stress days do not#
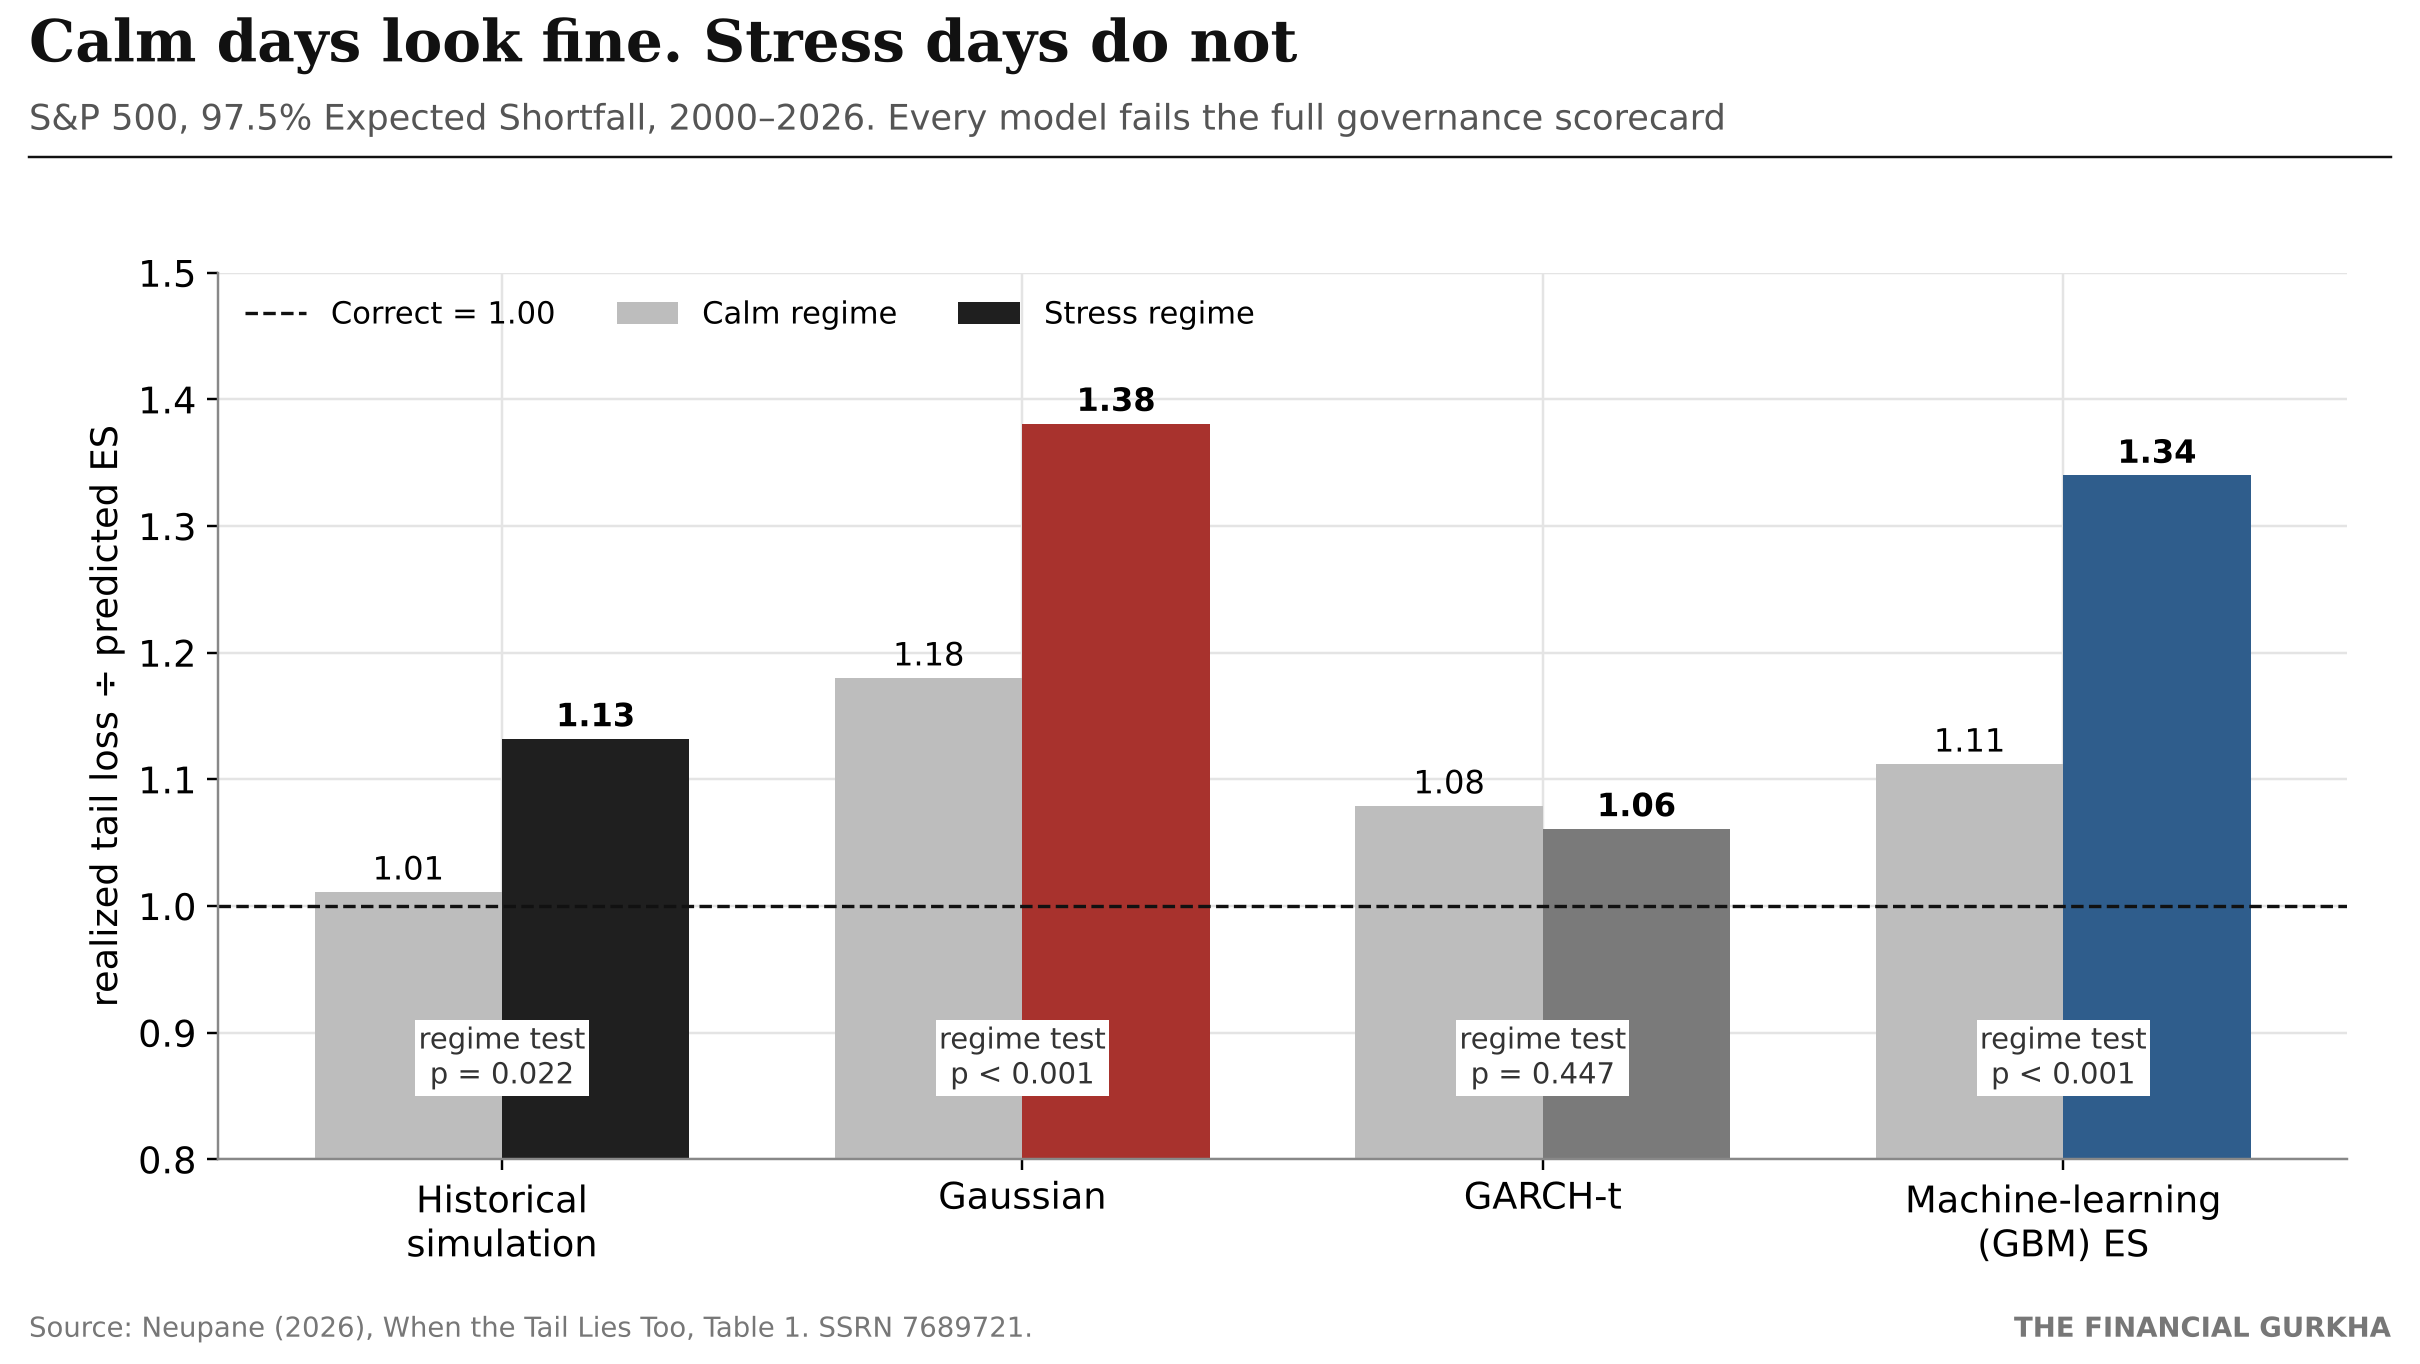
| S&P 500, 97.5% ES | Calm Λ | Stress Λ | Regime test | Full scorecard |
|---|---|---|---|---|
| Historical simulation | 1.01 | 1.13 | p = 0.022 | FAIL |
| Gaussian | 1.18 | 1.38 | p under 0.001 | FAIL |
| GARCH-t | 1.08 | 1.06 | p = 0.447 | FAIL |
| Machine-learning (GBM) ES | 1.11 | 1.34 | p under 0.001 | FAIL |
Source: Neupane (2026), Table 1.
In calm markets, every model is close to target. In stress, historical simulation understates losses by 13%, the Gaussian model by 38%, and the machine-learning model by 34%. On the days a model is breached in stress, the realized loss runs 0.4 to 0.8 percentage points of daily return worse than predicted, beyond the calm-regime gap.
Two details stand out. First, the machine-learning model is not the safe choice: it is nearly as deficient in stress as the simplest Gaussian model. Second, the dynamic, fat-tailed GARCH-t is the only model that keeps stress severity near target. And yet no model passes every pillar of the governance scorecard.
7.4 Finding 2: it is everywhere, not just in equities#
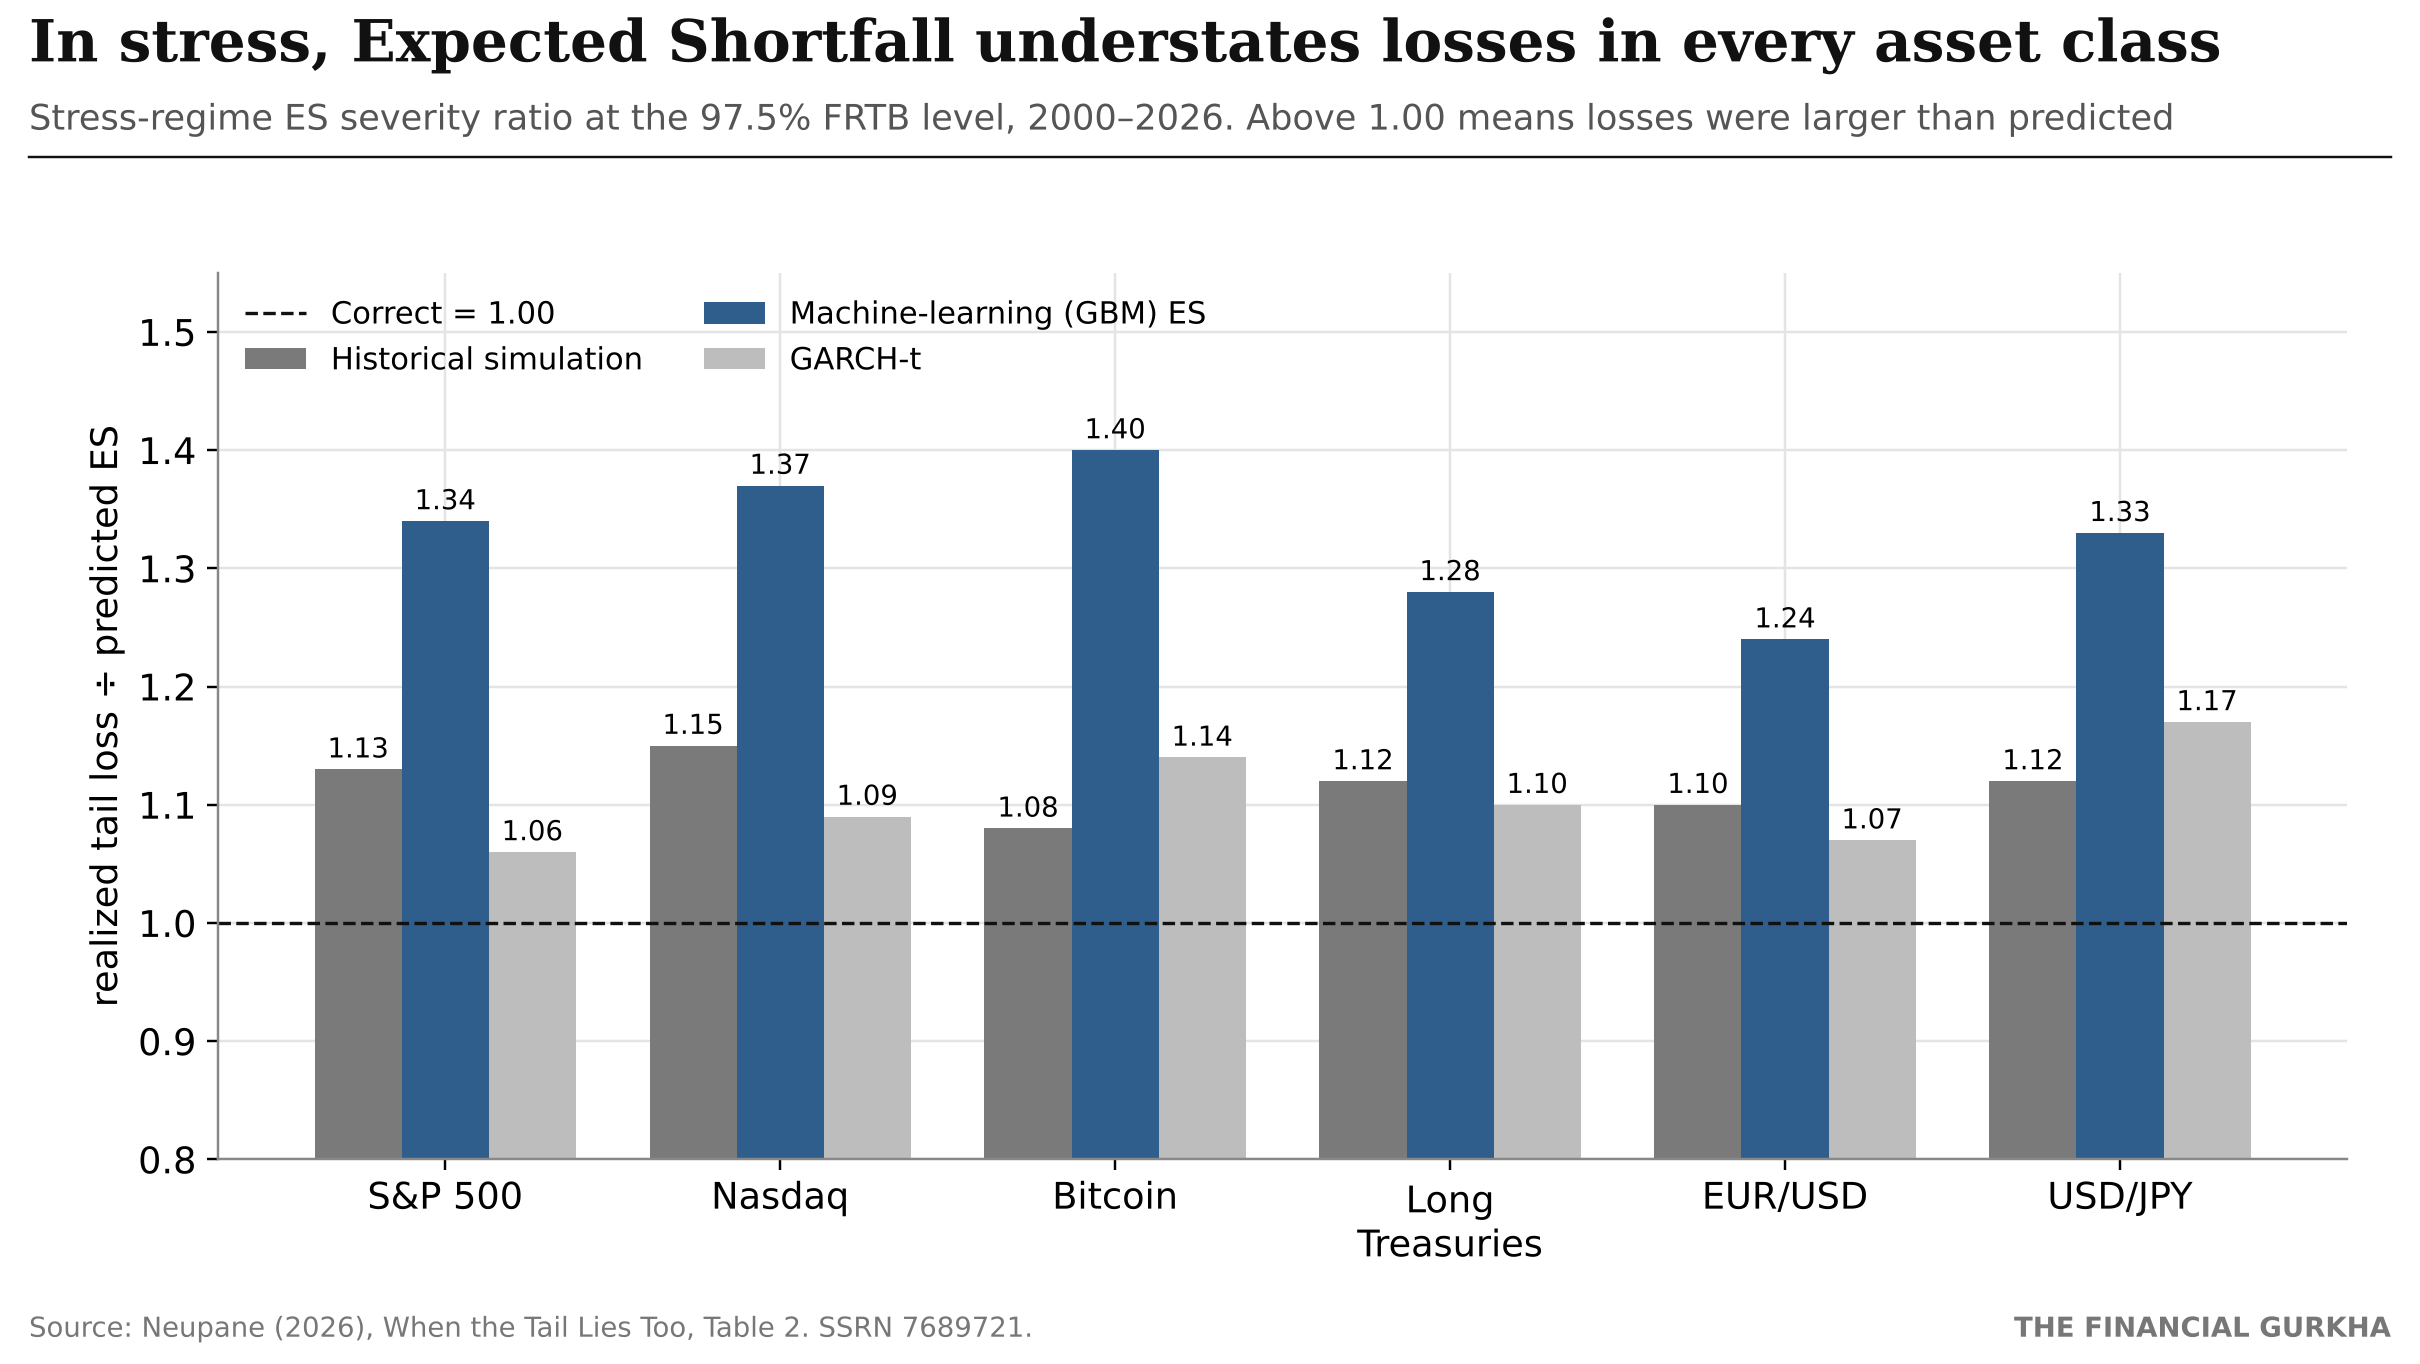
| Stress-regime Λ, 97.5% ES | Historical | GARCH-t | ML (GBM) | Gaussian |
|---|---|---|---|---|
| S&P 500 | 1.13 | 1.06 | 1.34 | 1.38 |
| Nasdaq | 1.15 | 1.09 | 1.37 | 1.40 |
| Bitcoin | 1.08 | 1.14 | 1.40 | 1.44 |
| Long Treasuries | 1.12 | 1.10 | 1.28 | 1.17 |
| EUR/USD | 1.10 | 1.07 | 1.24 | 1.20 |
| USD/JPY | 1.12 | 1.17 | 1.33 | 1.37 |
| Average | 1.12 | 1.10 | 1.33 | 1.33 |
Source: Neupane (2026), Table 2.
Every asset, every model: above 1.00. The regime effect is statistically significant in 83% of cases at the 97.5% capital level. This is not noise in one market. It is a structural limitation of how ES is validated.
The long Treasuries row deserves attention this week, as the 10-year yield rose to about 5.13%. Many portfolios treat long bonds as the low-risk ballast. In stress regimes, ES understates their tail losses by 10% to 28%, depending on the model.
7.5 Finding 3: the standard test can pass while the model fails#
This is the finding I consider most important for governance. In three cases, the standard ES backtest gives the model a clean result, while the regime-conditional test detects significant stress deficiency:
| Case | Standard ES test (McNeil–Frey) | Stress Λ | Regime test |
|---|---|---|---|
| GARCH-t on Bitcoin | passes (p = 0.35) | 1.14 | fails (p = 0.03) |
| GARCH-t on EUR/USD | passes (p = 0.39) | n/a | fails (p = 0.02) |
| Historical simulation on USD/JPY (99%) | passes (p = 0.14) | n/a | fails (p = 0.03) |
That is what false comfort looks like for a capital measure: the summary test certifies the model, yet its ES is systematically too small in exactly the regime where capital is called on.
7.6 Finding 4: the gap is fixable, and the fix is auditable#
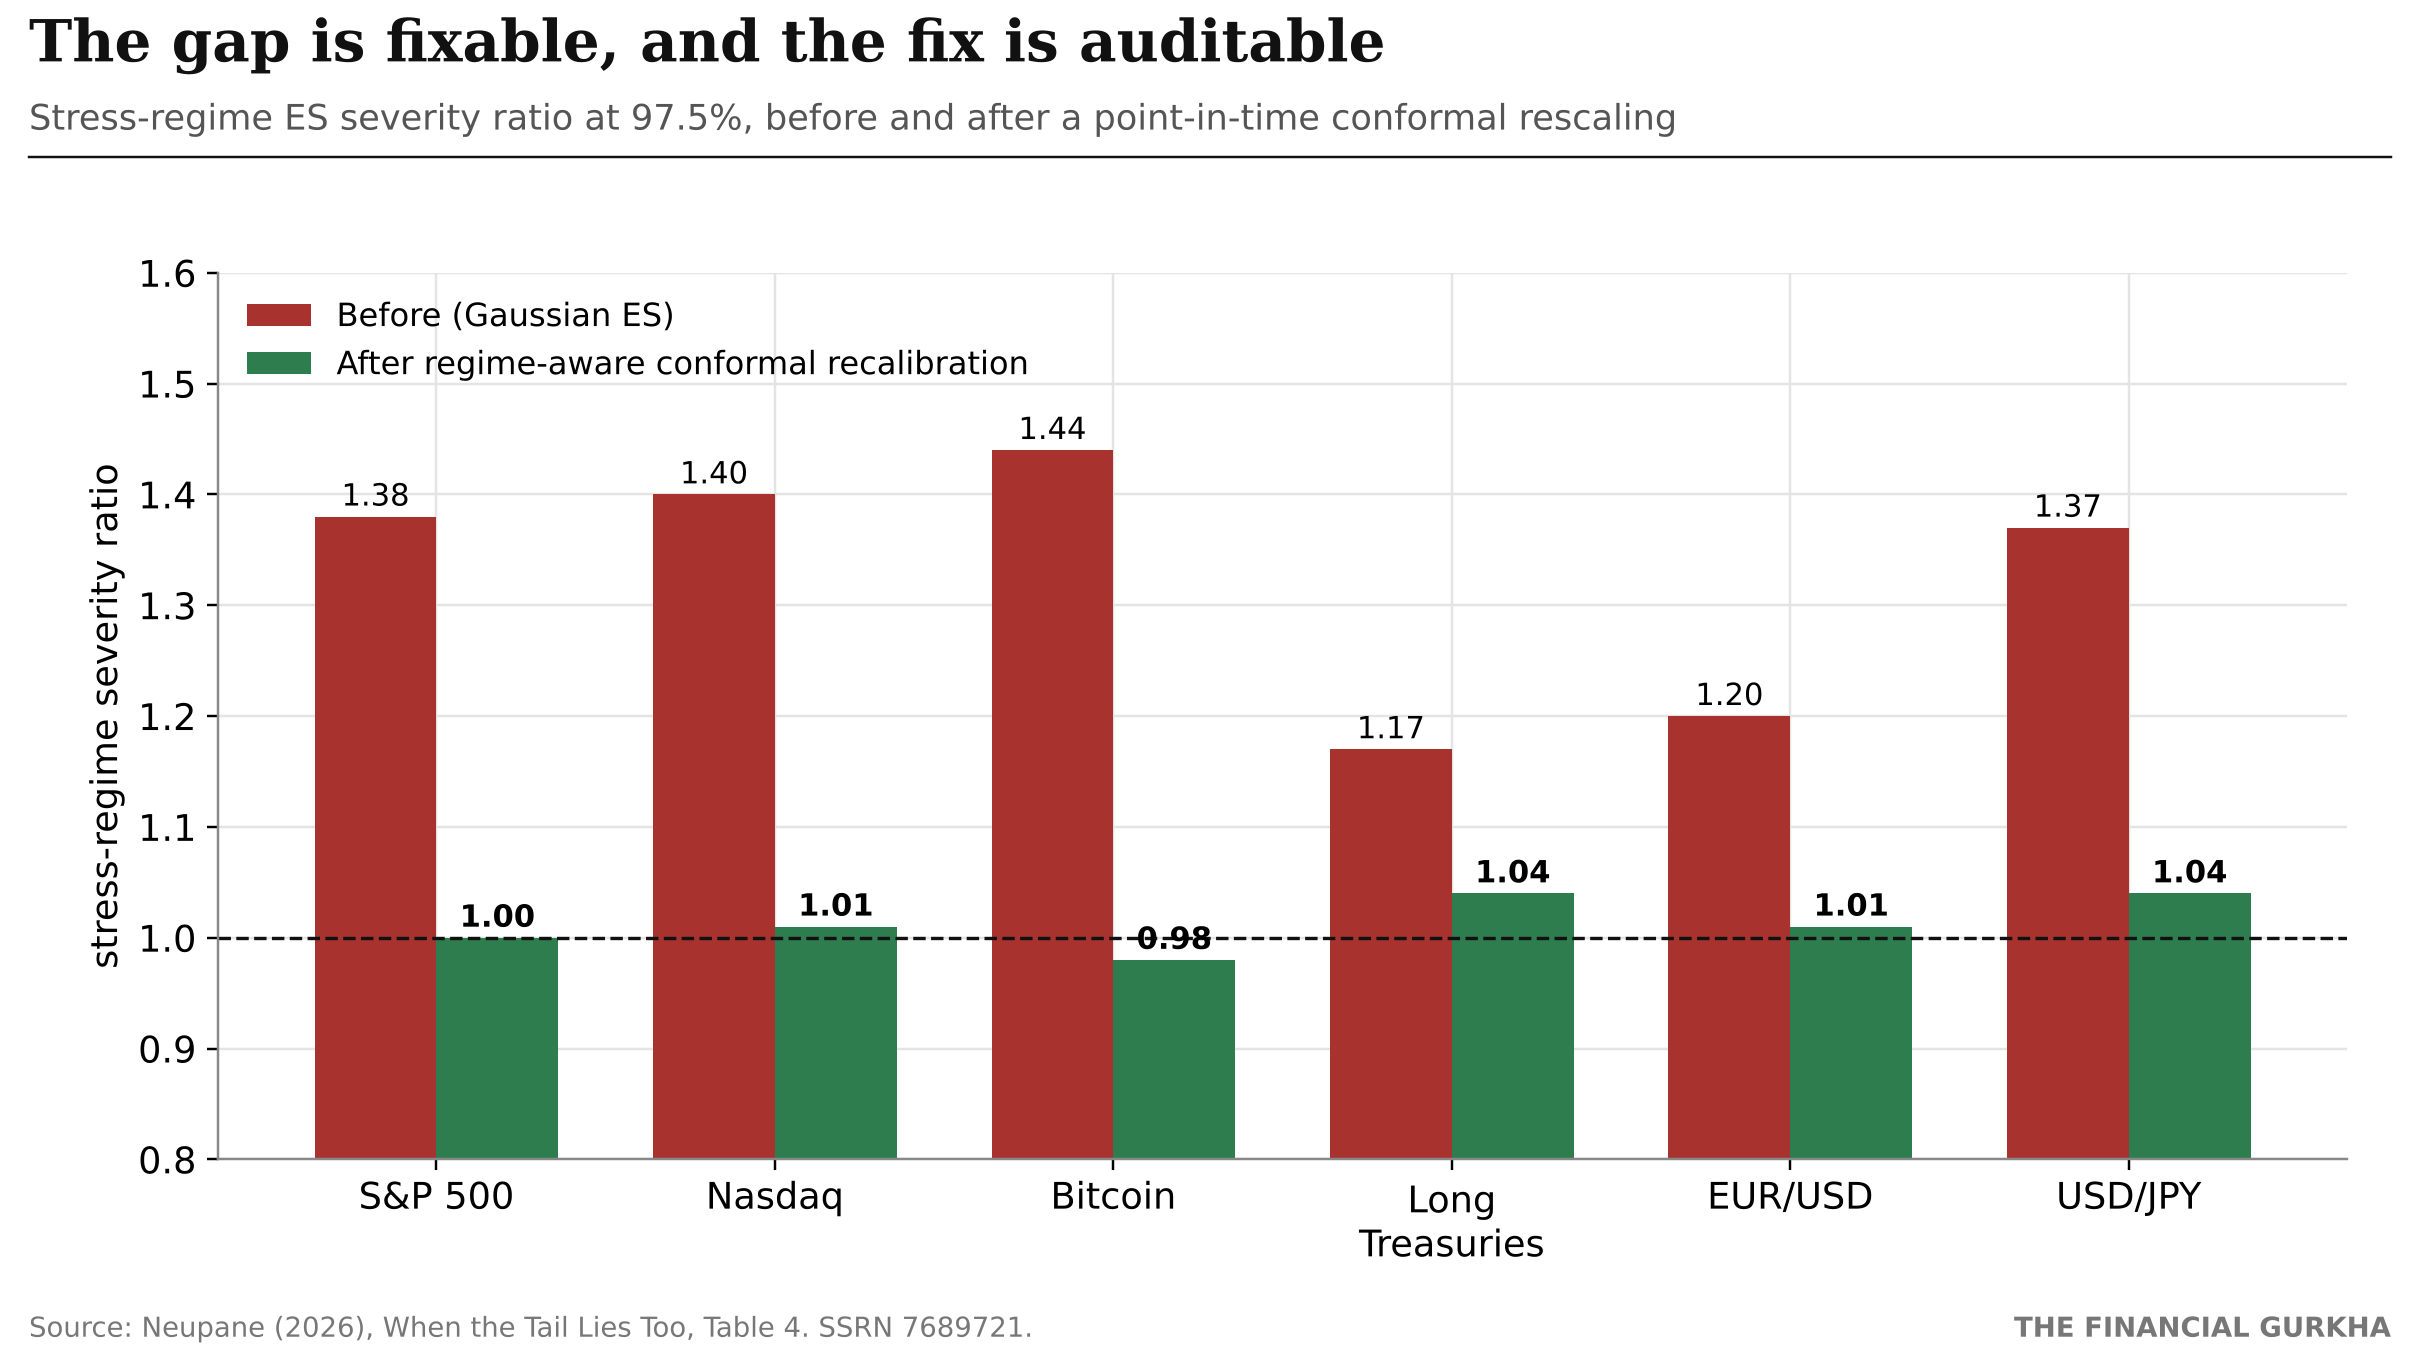
The paper proposes a regime-aware split-conformal recalibration. In plain terms: over a trailing window, measure how much the model has recently understated losses on breach days in the current regime, and scale ES up by that factor. It uses only past, point-in-time information, makes no distributional assumption and leaves the underlying model in place.
| Gaussian ES, 97.5% | Stress Λ before | After | McNeil–Frey p before | After |
|---|---|---|---|---|
| S&P 500 | 1.38 | 1.00 | 0.000 | 0.466 |
| Nasdaq | 1.40 | 1.01 | 0.000 | 0.328 |
| Bitcoin | 1.44 | 0.98 | 0.000 | 0.792 |
| Long Treasuries | 1.17 | 1.04 | 0.001 | 0.306 |
| EUR/USD | 1.20 | 1.01 | 0.000 | 0.540 |
| USD/JPY | 1.37 | 1.04 | 0.000 | 0.262 |
Source: Neupane (2026), Table 4.
The stress severity ratio closes to the 0.97–1.04 band on every asset, and failing backtests turn into comfortable passes. A model-risk team can adopt this without replacing its ES engine.
7.7 What a 34% gap means in dollars#
Consider a trading book whose 97.5% one-day ES is reported at $100 million.
| Model | Stress Λ (S&P 500) | Expected average loss on a stress breach day | Unmeasured shortfall |
|---|---|---|---|
| Historical simulation | 1.13 | $113M | $13M |
| Machine-learning ES | 1.34 | $134M | $34M |
| Gaussian | 1.38 | $138M | $38M |
Illustrative. Applies the paper's historical stress ratios to a hypothetical book.
Because FRTB capital is built from ES, a book like this would be holding capital for losses one-tenth to one-third smaller than the ones it has historically experienced in stress, on exactly the days capital exists for.
7.8 The governance scorecard#
The paper packages the tests into a scorecard mapped to the three validation pillars of Federal Reserve guidance SR 11-7:
| Test | Governance pillar | Pass criterion |
|---|---|---|
| Acerbi–Székely Z2 | Outcomes analysis | p ≥ 0.05 |
| McNeil–Frey residual test | Outcomes analysis | p ≥ 0.05 |
| Stress severity Λ_ES | Outcomes analysis | ≤ 1.10 |
| Regime-effect test | Ongoing monitoring | p ≥ 0.05 |
| Conformal severity gap | Calibration | within 0.05 of 1.00 |
7.9 Why this week is the paper in miniature#
Put the three events of the past two weeks side by side:
| Event | What changed | What a calm-period model would miss |
|---|---|---|
| Nov 5 chip crash | Market-wide stress regime | Breach frequency (When Backtests Lie) and severity (When the Tail Lies Too) |
| Nov 10 bond selloff | Rate regime; 10-year above 5% | ES on "safe" long Treasuries understated by 10–28% |
| Nov 12 Nvidia CEO exit | Company-specific structural break | A jump with no precedent in the data at all |
The first two are the kind of regime shift the paper measures and corrects. The third is a reminder of its stated limit: recalibration works on regimes that have happened before. A shock with no precedent needs scenario analysis, not just better statistics.
The practical lesson: validate both the frequency and the severity of tail losses conditional on regime, and treat single-name concentration in a mega-cap as a scenario to stress explicitly: "What if this company's leadership changes overnight?" That is a governance question as much as a statistical one.
8. The case against my reading#↑ Contents
"12.7% is an overreaction, and a buying opportunity." Possibly. The business has not changed in a week. Demand for AI compute is still enormous: CoreWeave reported a $132.5 billion backlog this week, and Nvidia is among the strategic investors in Anthropic's concurrent private placement. Strong results and a credible permanent CEO could close the discount quickly.
"The rotation proves the market handled it rationally." Partly. But on Friday AMD fell about 9%, Sandisk about 9%, and Broadcom, Intel and Micron each 5% to 6%, as the 10-year yield touched 5.17%. Nvidia's rivals were not protected from the rate shock, which suggests part of Monday's move was positioning rather than a durable reassessment.
"Governance risk was obvious all along." In hindsight, yes. But a company that loses $580 billion in a week on leadership news was not pricing that risk beforehand. That is the definition of a risk that was present but unpriced.
My assessment: the market was right to treat this as company-specific in the short run. It is probably wrong to assume it will stay that way. Nvidia's leadership affects product timing, pricing and allocation for the whole AI supply chain. A smooth transition keeps the shock idiosyncratic. A difficult one turns it systemic through the customers and suppliers that depend on Nvidia's roadmap.
9. The macro backdrop: a rebound against rising rates#↑ Contents
| October CPI | +0.4% m/m (0.3% expected); core +0.3% (0.2% expected) |
| PPI | +6.5% year over year, the highest since November 2022 |
| 10-year Treasury | about 5.13%, up roughly 27bp; intraday high 5.17% |
| December Fed pricing | 91% for +25bp, 9% for +50bp |
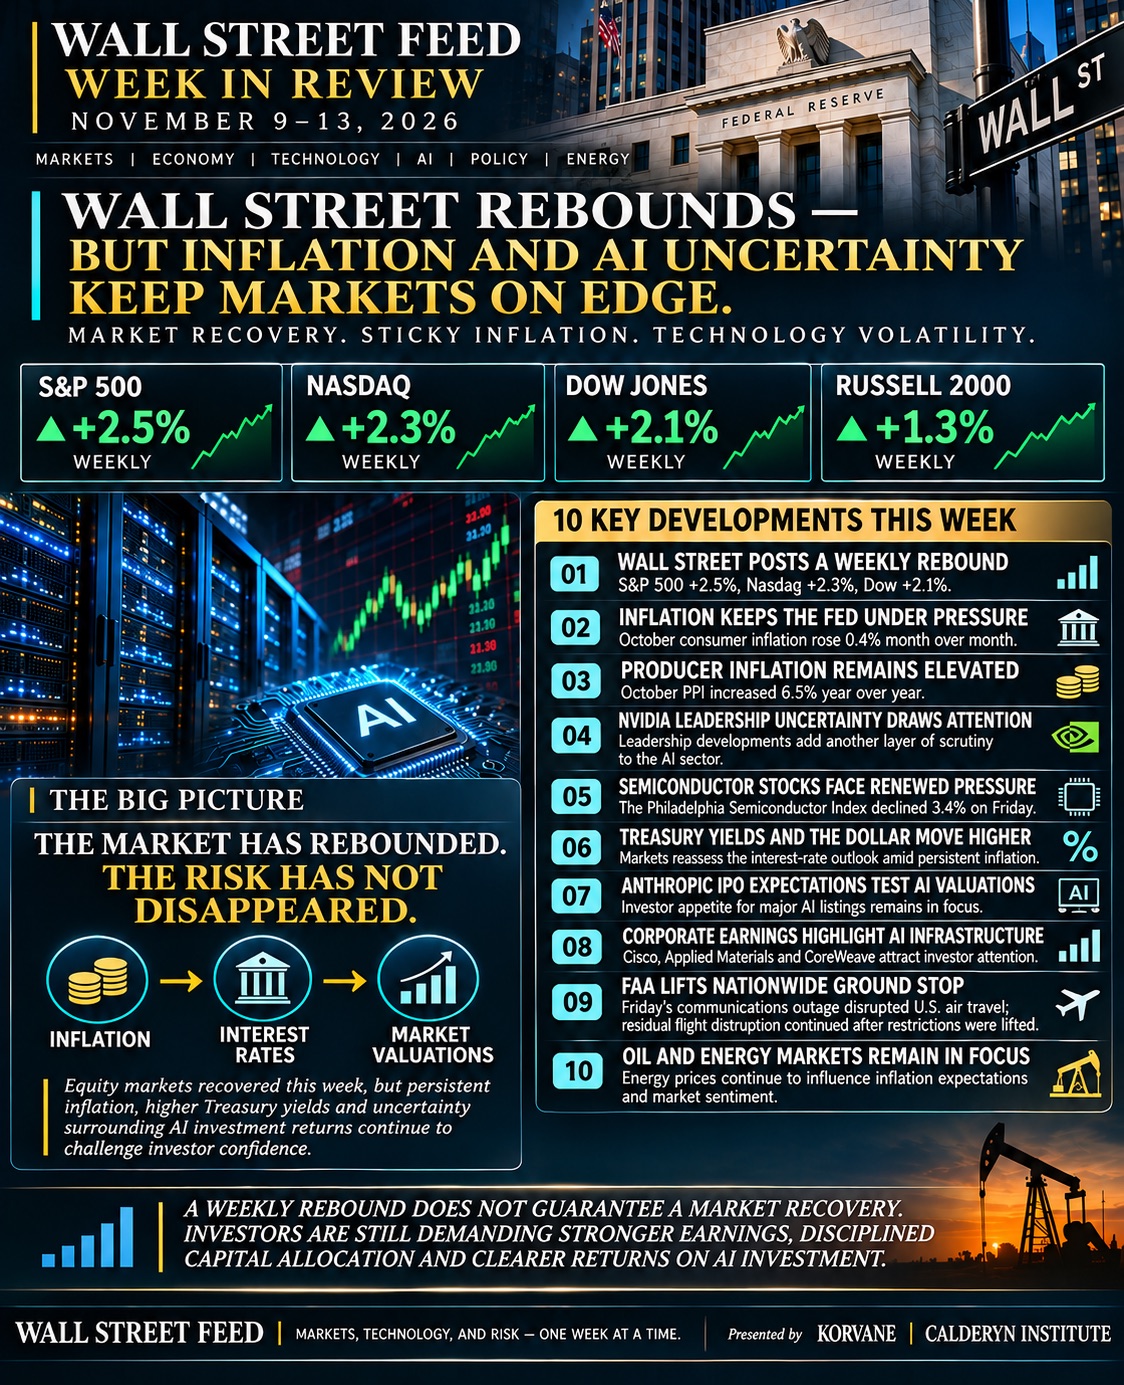
A broad rally while the long-bond yield rises 27bp and the sector leader falls 12.7% is not the profile of a durable recovery. It is the profile of a market that is still repricing, just not all in the same direction.
10. What to watch#↑ Contents
| Signal | What it would tell us |
|---|---|
| Nvidia's earnings report (due next week) | Whether demand and guidance are intact, and how interim leadership communicates |
| Permanent CEO search | Speed and choice (internal or external) will set the size of the lasting discount |
| CFO succession | Kress cannot hold both roles indefinitely; the replacement matters for capital allocation |
| Findings of the board's inquiry | Anything beyond the board's initial statement would change the risk picture |
| Hyperscaler commentary | Signs of customers diversifying away from Nvidia would make the shock systemic |
| Nvidia's correlation with the AI complex | Re-coupling would mean the market has moved from "company risk" back to "theme risk" |
The bottom line#↑ Contents
The S&P 500 rose 2.2% in a week when its most important company lost its founder-CEO and about $580 billion of value. On the surface, that is resilience. Underneath, it shows two things.
First, the market can separate a company from a theme. Money left Nvidia and stayed in AI, a healthier response than last week's indiscriminate selloff.
Second, the risk that moved the stock was present but unpriced, invisible to every model built on return history. And even for the stress regimes that are in the data, my new research shows the capital measure understates losses by 10% to 44% in exactly the moments it is meant to cover.
Diversification protects you from the risks you can measure. Governance is where the risks you cannot measure tend to live, and validation is how you find out which is which.
Your take#
Was Nvidia's 12.7% fall a rational repricing of key-person risk, or an overreaction at a business whose fundamentals haven't changed? And should regulators require Expected Shortfall to be validated by regime? Share your perspective in the comments.
Read the research
NEW: When the Tail Lies Too: Governance-Grade Backtesting of Expected Shortfall under Regime Shifts > papers.ssrn.com/sol3/papers.cfm?abstract_id=7689721 · Code: github.com/nirajneupane17/es-backtesting
When Backtests Lie: A Governance-Grade Validation Framework for Machine-Learning Value-at-Risk Models under Regime Shifts > papers.ssrn.com/sol3/papers.cfm?abstract_id=7652318
Systemic Tail Episode Risk: Persistence and Cumulative Severity of Synchronized Extreme-Loss Episodes Across Markets > papers.ssrn.com/sol3/papers.cfm?abstract_id=7534899
Conditional Tail Episode Risk: A Path-Dependent Framework for Extreme-Loss Episodes Beyond Value-at-Risk and Expected Shortfall > papers.ssrn.com/sol3/papers.cfm?abstract_id=7502499
ML-LiqVaR: A Liquidity- and Regime-Aware, Extreme-Value-Calibrated Gradient-Boosting Value-at-Risk Model for US Equity Markets > papers.ssrn.com/sol3/papers.cfm?abstract_id=7222958
Backtesting Value-at-Risk Models Under SR 11-7: A Comparative Analysis of Kupiec, Christoffersen, and Basel Traffic-Light Tests Applied to S&P 500 Returns (2018–2024) > papers.ssrn.com/sol3/papers.cfm?abstract_id=7170418
All papers: SSRN author page
About the author#
Niraj Neupane, CA (ICAI), is a Quantitative Researcher at Korvane, a Financial Economist at Calderyn Institute, and the founder of Wall Street Feed. His research covers Value-at-Risk, Expected Shortfall, tail risk and the validation of AI risk models, and is published on SSRN.
Views expressed are the author's own and are not investment advice.
Sources#
Nvidia
- NVIDIA, Statement from the Board of Directors (Nov 8, 2026): https://investor.nvidia.com/news/press-release-details/2026/Statement-from-NVIDIA-Board-of-Directors/default.aspx
- PBS NewsHour, What we know after Jensen Huang's resignation as Nvidia's CEO: https://www.pbs.org/newshour/nation/what-we-know-after-jensen-huangs-resignation-as-nvidias-ceo
- Al Jazeera, Who is Colette Kress? (Nov 12, 2026): https://www.aljazeera.com/news/2026/11/12/why-did-nvidia-ceo-jensen-huang-resign-and-who-is-colette-kress
- AI Business, Jensen Huang's future raises questions for AI infrastructure: https://aibusiness.com/data-centers/jensen-huang-future-raises-questions-ai-infrastructure-industry
- Mitrade, NVDA succession, control and AI supply chain risk analysis: https://www.mitrade.com/insights/news/live-news/article-8-2244971-20261110
Markets
- StockTitan, The Stock Market Today, November 9, 2026: https://www.stocktitan.net/articles/stock-market-today-live-november-9-2026
- Yahoo Finance, Stock market today, November 13, 2026: https://finance.yahoo.com/markets/live/stock-market-today-friday-november-13-dow-sp-500-nasdaq-nvidia-ppi-141451558.html
- Weekly market wrap, week ending November 13, 2026: https://lifestyle.middletownlifemagazine.com/story/832669/weekly-gains-hold-up-despite-a-friday-slide-as-chips-lead-and-yields-climb/
- Reuters via Investing.com, Trading Day: A November 5 market bonfire: https://www.investing.com/news/economy-news/trading-day-a-november-5-market-bonfire-5005919
Macro
- StockAnalysis, US consumer prices rise 0.4% in October: https://stockanalysis.com/news/us-cpi-rises-october-2026/
- 24/7 Wall St., The 2-year Treasury yield just had its biggest jump in 19 months: https://247wallst.com/investing/2026/11/11/the-2-year-treasury-yield-just-had-its-biggest-jump-in-19-months/
Research
- Neupane, N. (2026). When the Tail Lies Too: Governance-Grade Backtesting of Expected Shortfall under Regime Shifts. SSRN 7689721.
- Gneiting, T. (2011). Making and evaluating point forecasts. Journal of the American Statistical Association.
- Fissler, T., and Ziegel, J. (2016). Higher order elicitability and Osband's principle. Annals of Statistics.
- Acerbi, C., and Székely, B. (2014). Backtesting Expected Shortfall. Risk.
- McNeil, A., and Frey, R. (2000). Estimation of tail-related risk measures for heteroscedastic financial time series. Journal of Empirical Finance.
- Basel Committee on Banking Supervision (2019). Minimum capital requirements for market risk.