Disclaimer: This article is for educational purposes only and is not investment or financial advice.
AI disclosure. Researched and drafted with the help of Muse, made by Meta AI. All figures are drawn from Federal Reserve data published through FRED and from reporting attributed to the Wall Street Journal and the data providers it cites; nothing here is a recommendation to borrow, buy or sell.
Two numbers describe the entire U.S. housing market right now, and both come from the same Federal Reserve table.
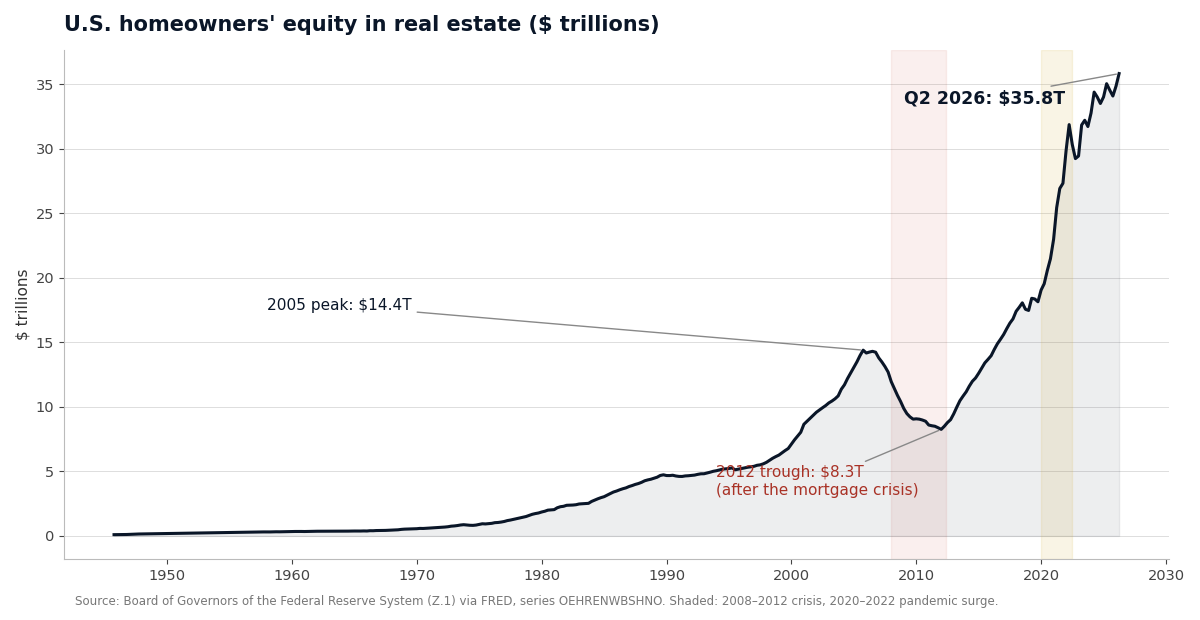
The first is $35.8 trillion. That is the total equity American households hold in their real estate — the market value of their homes minus what they still owe on them — as of the second quarter of 2026. It is the most homeowner equity ever recorded.
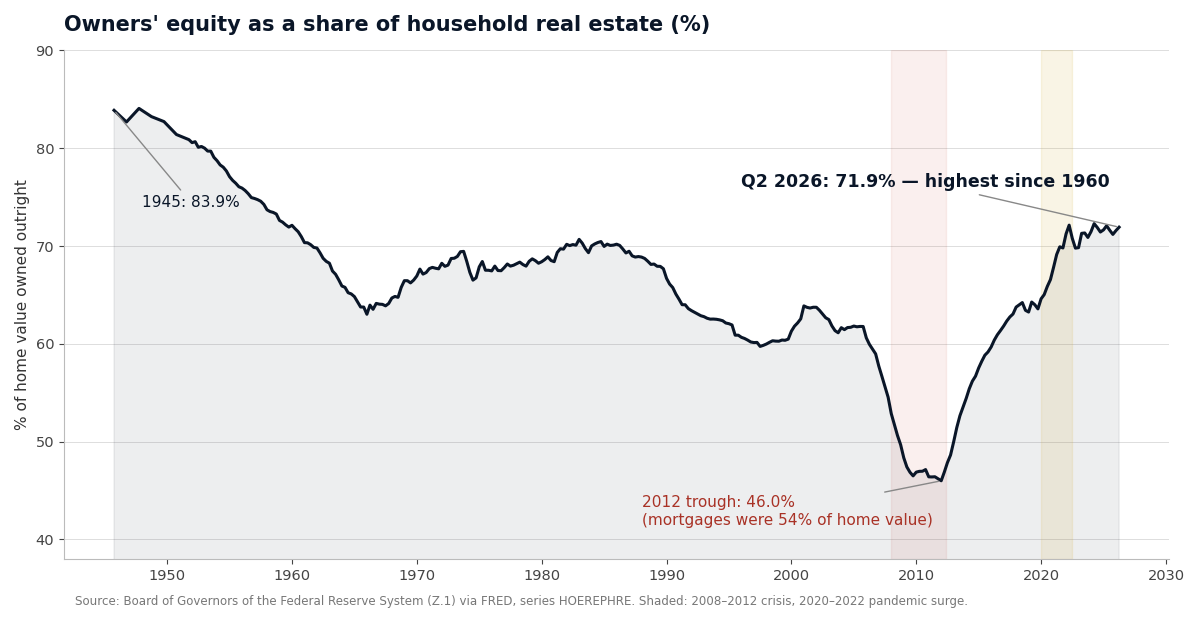
The second is 71.9 percent. That is the share of the housing stock that owners actually own, free and clear of mortgage debt. Put the two together and the picture is simple: America's homes are worth about $49.8 trillion in total, about $35.8 trillion of that belongs to the people who live in them, and about $14.0 trillion belongs to their lenders. Owners have not held a share this large since 1960.
This piece is about how that happened — the crash that nearly halved the nation's home equity, the two extraordinary years when money cost 3 percent, and the quiet consequence now showing up in the data: with rates high again and owners refusing to move, the equity is starting to be tapped where it sits.
What's in this report#
- The two Federal Reserve numbers, and what they actually measure
- The fall: how $6.1 trillion of equity vanished between 2005 and 2012
- The long climb back, and then the pandemic surge
- An ode to the 3% mortgage — the payment math that changed a generation's balance sheet
- High rates, high equity: how the lock-in keeps building the pile
- The tapping begins: what the Wall Street Journal's charts show about HELOCs
- Why the cushion is different this time, and what to watch next
Two numbers that describe the whole market#↑ Contents
Both series come from the Federal Reserve's Financial Accounts of the United States (the Z.1 release) and are published through FRED, the St. Louis Fed's database. The equity level (series OEHRENWBSHNO) counts households' owners' equity in real estate in dollars. The share (series HOEREPHRE) expresses that equity as a percentage of the total value of household real estate. They are updated quarterly; the current readings are for the second quarter of 2026, published September 11, and the next update lands December 10, 2026.
Read together, the two series separate the two things that build home equity: prices, which move the dollar figure, and leverage, which moves the share. A housing boom can inflate the first while hollowing out the second — which is exactly what happened before 2008.
The fall: how $6.1 trillion vanished#↑ Contents
Homeowner equity peaked in the fourth quarter of 2005 at $14.4 trillion. Then came the mortgage crisis. By the first quarter of 2012, the total had fallen to $8.3 trillion — a loss of $6.1 trillion, or 42.6 percent of the nation's accumulated home equity, gone in six years.
The share tells the darker half of the story. At the 2005 peak, owners held 61.8 percent of the value of their homes. By early 2012 they held 46.0 percent — meaning mortgages, in aggregate, were worth more than half of what the housing stock was worth. Behind that average sat millions of households whose individual share was zero or negative: the underwater years, when a home could be sold for less than the loan against it and foreclosure was a rational economic act.
That is the scar tissue this generation of homeowners carries. It is also the baseline that makes today's numbers remarkable.
The long climb back — and then the surge#↑ Contents
From the 2012 trough, equity rebuilt the slow way for eight years: home prices recovered, owners paid down principal, and new lending stayed cautious. By the end of 2019, equity had climbed back to $18.1 trillion and the owners' share to 63.6 percent — a full recovery, earned gradually.
Then the pandemic compressed a decade of equity-building into about two years. Between the first quarter of 2020 and the second quarter of 2022, homeowner equity jumped from $19.0 trillion to $31.9 trillion — about $12.8 trillion added in nine quarters. The share briefly touched 72.1 percent in mid-2022. Two engines ran at once: home prices surged as buyers competed for a fixed stock of houses, and the Federal Reserve's emergency policy pushed mortgage rates to the lowest levels ever recorded, which pulled forward both purchases and refinances.
Equity did dip when rates spiked — by the fourth quarter of 2022 it had fallen back to $29.2 trillion as prices cooled. But it never came close to unwinding. By early 2024 it was above $32.8 trillion again, and it has climbed since, to today's $35.8 trillion.
An ode to the 3% mortgage#↑ Contents
It is worth pausing on the rate itself, because the 3% mortgage is the single most valuable financial accident ever to happen to the American middle class.
In January 2021, the average 30-year fixed mortgage rate in Freddie Mac's weekly survey touched 2.65 percent — the lowest in the survey's history, which runs back to 1971. The average rate across 2021 was 2.96 percent; across 2020, 3.11 percent. For 55 weeks across 2020 and 2021, a homebuyer or refinancer could borrow for three decades at under 3 percent. Tens of millions of households did.
Here is what that window was worth, in one loan. On a $400,000, 30-year mortgage:
- At 2.75 percent — a typical rate locked in during 2021 — the monthly principal-and-interest payment is $1,633.
- At 7.11 percent — the average rate in Freddie Mac's survey for the week of November 12, 2026 — the same loan costs $2,691 a month.
The difference is $1,058 a month, every month, for thirty years — about $381,000 over the life of the loan. The family that locked in 2021 is not just paying less interest. It holds a below-market, fixed, non-callable liability against an asset that has since revalued sharply upward, while its payment stays frozen in nominal terms and inflation and wages rise around it. The loan itself became an asset.
And the rate worked on the equity twice. Cheap money pushed home prices up, raising the value side of the ledger. At the same time, owners who refinanced into lower payments could keep paying down principal on schedule — many paid extra — while almost none of the pre-2008 habits (interest-only loans, negative amortization, serial cash-out refinancing at the peak) came back with them. The class of 2020–21 got the cheap money and, scarred by 2008, mostly kept the equity it created.
So, an ode, plainly stated: if you bought or refinanced a home in 2020 or 2021, a brief alignment of a pandemic, a central bank and a bond market handed you the best trade of your financial life. The data above is what it looks like in aggregate — $35.8 trillion of it.
High rates, high equity: the lock-in economy#↑ Contents
The sequel is stranger. Rates did not stay low. The 30-year average peaked at 7.79 percent in October 2023 and, after all the easing cycles and re-tightening since, stood at 7.11 percent in mid-November 2026. In a normal market, rates like that would crush prices and equity with them. Instead equity has kept setting records. The reason is the lock-in.
An owner holding a 3 percent mortgage who sells and buys a similar house nearby must swap a $1,633 payment for a $2,691 payment on the same principal. Most rationally refuse. So the houses do not list, inventory stays thin, prices stay supported — and every month, the locked-in owners' scheduled payments convert a little more of their homes from the lender's column to their own. Equity now builds by default, through amortization and scarcity, even with prices roughly flat. The pile grows because nobody can afford to disturb it.
The cost of this arrangement is real, and it falls on the people outside it: first-time buyers facing 7 percent money and record prices, renters watching the ladder pull up, and a housing market whose transaction volume no longer clears the way it used to. The $35.8 trillion is, among other things, a measure of a frozen market's winners.
And now, the tapping begins#↑ Contents
Which brings us to the Wall Street Journal. In a recent "In Charts" piece, "These Charts Show How More People Are Pulling Cash Out of Their Homes," Terell Wright and Veronica Dagher document what happens when a generation sits on record equity it cannot move: it borrows against the house instead.
The Journal's figures, drawn from the Federal Reserve Bank of New York, Intercontinental Exchange (ICE) and the Urban Institute:
- Home-equity lines of credit — HELOCs, revolving credit secured by the home — are back. Outstanding HELOC balances total $481 billion, and they rose by $23 billion in the third quarter of 2026 alone, the largest quarterly increase since 2005. Balances are up 50 percent since 2022, to the highest level in over a decade, and the total credit available on these lines now stands at $1.1 trillion.
- The equity being tapped is, in places, enormous. Among mortgaged homes, ICE estimates that 28 percent in the San Francisco metro area, 23 percent in Los Angeles and 12 percent in New York have more than $1 million in equity.
- The decisive statistic is about how owners tap. Among homeowners who took out their primary mortgages in the low-rate window of 2020–21 and later pulled cash out, ICE found that about 80 percent chose a second-lien loan such as a HELOC, and only about 20 percent gave up their low-rate mortgage for a cash-out refinance. As ICE's Andy Walden put it to the Journal, a HELOC is often preferable to trading a 3 percent rate for a 7 percent cash-out refinance.
- HELOC pricing has even become competitive with first mortgages: the Journal, citing Bankrate, notes HELOC rates have recently averaged around 7.5 percent and in recent weeks have run slightly below the 30-year fixed rate.
- As for where the money goes, the Journal cites John Burns Research and Consulting's Rick Palacios: borrowers pulling cash out are often using it to pay off other bills, such as credit cards — swapping expensive unsecured debt for cheaper secured debt, at the price of putting the house behind it.
The pattern is coherent. The 2020–21 owner will not sell the house and will not surrender the mortgage. But the equity is too large to ignore, so it is being reached the only way left: a second lien layered behind the golden first loan. The home-as-ATM is returning — a decade and a half after it was shut down — except this time it is being opened from a position of strength, against a 71.9 percent equity cushion, rather than at the top of a bubble against almost none.
The cushion is the difference this time#↑ Contents
It is fair to ask whether rising HELOC balances are the first chapter of a familiar story. The aggregate math says the starting positions are not comparable. In early 2012, mortgage debt equaled 54 percent of the value of the housing stock; today it equals 28.1 percent. HELOC balances of $481 billion stand against $35.8 trillion of equity — the lines are real money, but they are about 1.3 percent of the cushion behind them. In 2006, by contrast, equity extraction ran ahead of equity itself.
The honest caveats are these. HELOCs are typically variable-rate, so their cost resets with policy — and policy, as our recent coverage of the December Fed debate shows, can move against borrowers. A second lien converts an untouchable cushion into a monthly obligation, and the obligation survives even if local prices fall; the national share can be 71.9 percent while an individual owner's is thin. And the aggregate figures conceal the split the Journal's charts imply: owners who bought before 2022 hold most of the $35.8 trillion, while recent buyers at high prices and 7 percent rates hold very little of it.
What to watch next is already on the calendar. The Federal Reserve publishes the third-quarter 2026 Financial Accounts on December 10, 2026 — the next reading on both numbers this piece is built on. If the equity share holds near 72 percent while HELOC balances keep climbing at the third quarter's pace, the story of 2027 will be the one the Journal has spotted early: a housing market that does not move, and increasingly, does not need to — because its owners have learned to live inside the equity instead.
Frequently Asked Questions#↑ Contents
What is owners' equity in real estate? It is the market value of household-owned real estate minus the mortgage debt owed against it, as measured by the Federal Reserve's Financial Accounts (Z.1). In the second quarter of 2026 it was $35.8 trillion, out of a total housing value of about $49.8 trillion.
What share of their homes do Americans own in 2026? 71.9 percent, per the Federal Reserve via FRED (series HOEREPHRE) — the highest share since 1960. Mortgage debt equals the remaining 28.1 percent of the housing stock's value.
How much equity was lost in the 2008 mortgage crisis? From the peak of $14.4 trillion in late 2005, homeowner equity fell to $8.3 trillion by early 2012 — a decline of $6.1 trillion, or 42.6 percent. The owners' share of home value fell from 61.8 percent to 46.0 percent over the same period.
Why are HELOCs growing again if rates are high? Because the first mortgage is the thing owners are protecting. The Wall Street Journal, citing ICE data, reports that among 2020–21 borrowers who tapped equity, about 80 percent used a second-lien HELOC rather than refinancing out of their low-rate first mortgage. HELOC balances rose $23 billion in the third quarter of 2026 to $481 billion, per the New York Fed figures cited by the Journal.
When does this data update? The Federal Reserve's next Financial Accounts release is December 10, 2026, covering the third quarter of 2026.
Sources#↑ Contents
- Board of Governors of the Federal Reserve System, Financial Accounts of the United States (Z.1), via FRED: Households; Owners' Equity in Real Estate, Level (OEHRENWBSHNO), Q2 2026 — https://fred.stlouisfed.org/series/OEHRENWBSHNO
- Board of Governors of the Federal Reserve System, via FRED: Households; Owners' Equity in Real Estate as a Percentage of Household Real Estate (HOEREPHRE), Q2 2026 — https://fred.stlouisfed.org/series/HOEREPHRE
- Freddie Mac, Primary Mortgage Market Survey, via FRED: 30-Year Fixed Rate Mortgage Average in the United States (MORTGAGE30US), weekly through November 12, 2026 — https://fred.stlouisfed.org/series/MORTGAGE30US
- Terell Wright and Veronica Dagher, "These Charts Show How More People Are Pulling Cash Out of Their Homes," The Wall Street Journal, November 2026 — https://www.wsj.com/economy/housing/these-charts-show-how-more-people-are-pulling-cash-out-of-their-homes-66584b69 (HELOC balances and quarterly change: Federal Reserve Bank of New York data as cited by the Journal; second-lien shares and metro equity concentrations: Intercontinental Exchange; equity share of the housing market: Urban Institute; HELOC rate comparisons: Bankrate.)