By Niraj Neupane, CA (ICAI) Quantitative Researcher, Korvane · Financial Economist, Calderyn Institute
Key takeaways
The deal. Jio Platforms raised ₹30,213 crore at ₹1,119 per share, valuing the company at about ₹10.3 lakh crore (≈ $123 billion). The book was 22.2× subscribed; shares list on October 28.
The price. At ₹1,119 Jio trades at 34.3× post-issue earnings and about 15× EV/EBITDA once ₹1.04 lakh crore of deferred spectrum dues are counted as debt.
The gap. My reverse DCF shows the price needs ≈15.4% annual free-cash-flow growth for ten years. A justified price-to-book model says the market is pricing a long-run ROE of ≈24%; Jio earned 9.4% in FY26.
The odds. Across 200,000 simulated three-year paths, buying at the IPO price gives a median return of ≈7% a year and a 19% chance of loss. Buying at the grey-market-implied listing price of ≈₹1,365 cuts the median to ≈0.4% and lifts the chance of loss to 48%.
What's in this report#
- The Jio IPO in 10 numbers
- 1. The deal: India's biggest IPO, India's thinnest float
- 2. How far the valuation has travelled
- 3. The business: a telecom network with a platform option
- 4. The balance sheet: net cash on paper, spectrum debt underneath
- 5. Relative value: Jio versus Bharti Airtel
- 6. The quant analysis: what the price implies
- 7. Five ways the market can get Jio wrong
- 8. The quant dashboard: what to watch
- 9. Why this matters beyond Mumbai
- The bottom line
The Jio IPO in 10 numbers#↑ Contents
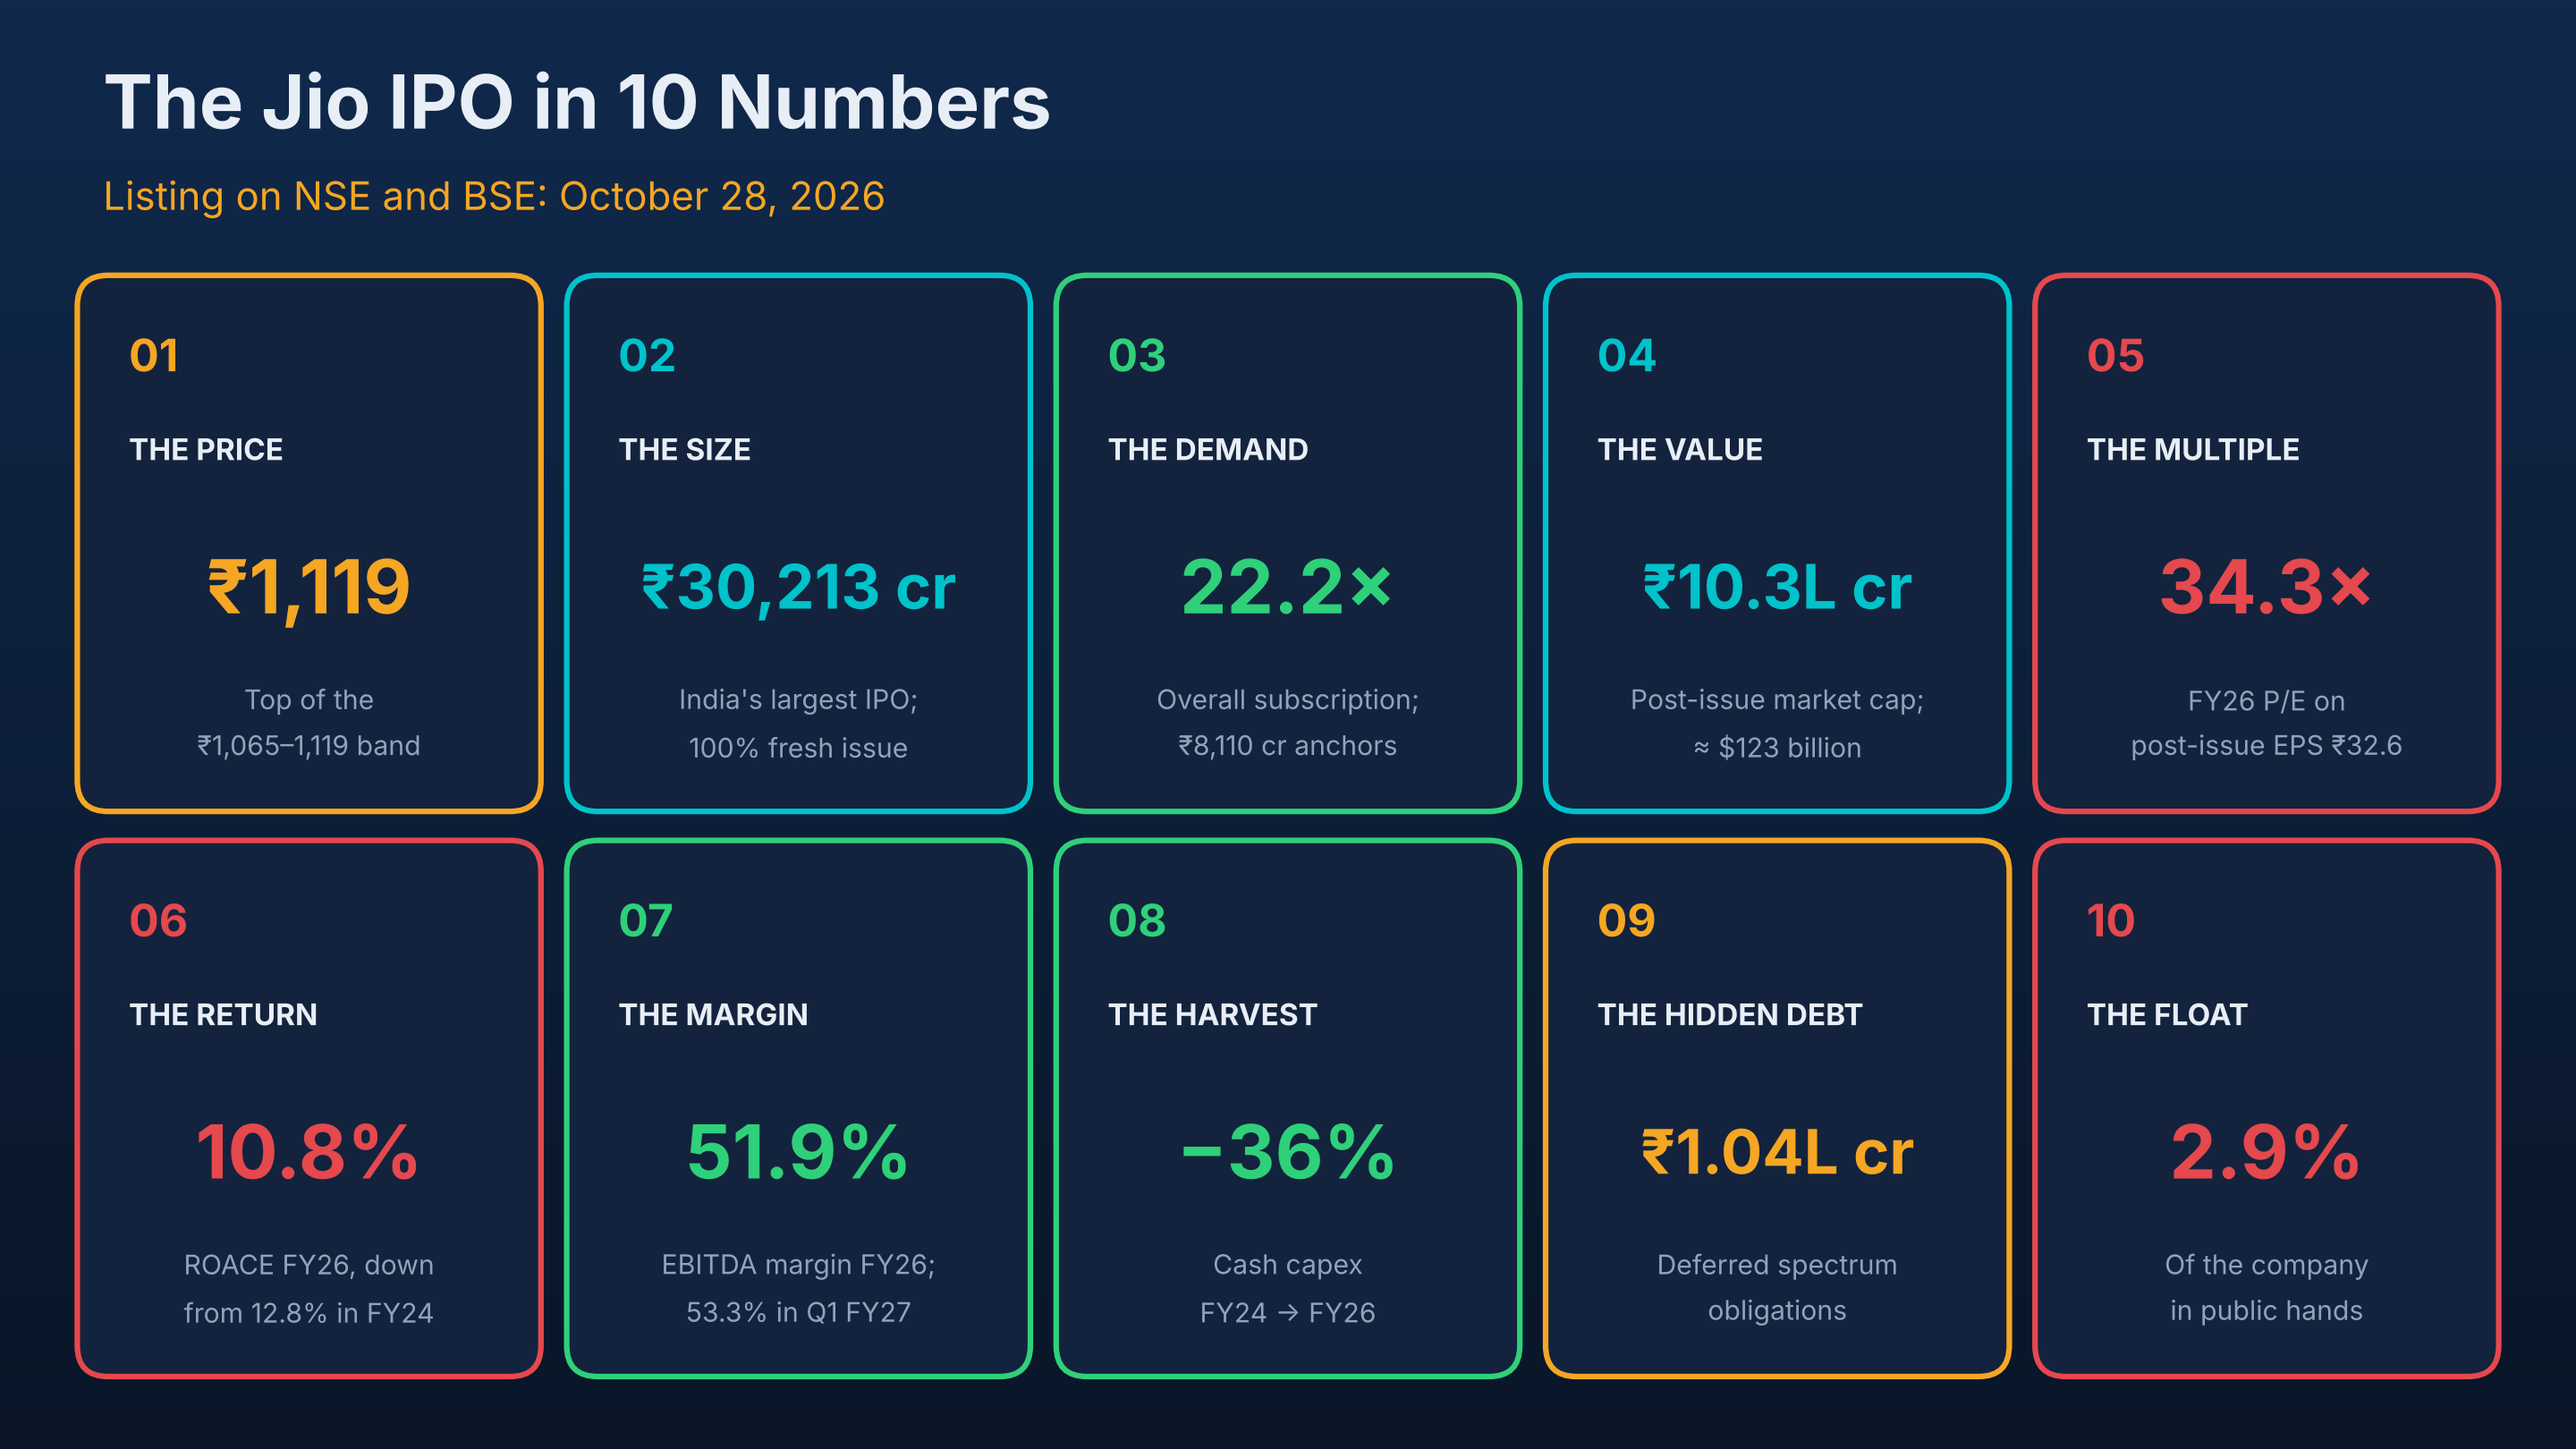
| # | Item | The number | Why it matters |
|---|---|---|---|
| 1 | The price | ₹1,119 | Top of the ₹1,065–1,119 band |
| 2 | The size | ₹30,213 cr | India's largest IPO; 100% fresh issue of 27 crore shares |
| 3 | The demand | 22.2× | Overall subscription; ₹8,110 cr from 212 anchors |
| 4 | The value | ₹10.3 lakh cr | Post-issue market cap, about $123 billion |
| 5 | The multiple | 34.3× | FY26 P/E on post-issue EPS of ₹32.6 |
| 6 | The return | 10.8% | Return on average capital employed, down from 12.8% in FY24 |
| 7 | The margin | 51.9% | FY26 EBITDA margin; 53.3% in Q1 FY27 |
| 8 | The harvest | −36% | Fall in cash capex, FY24 to FY26 |
| 9 | The hidden debt | ₹1.04 lakh cr | Deferred spectrum obligations, senior to equity |
| 10 | The float | 2.9% | Share of the company in public hands |
1. The deal: India's biggest IPO, India's thinnest float#↑ Contents
| Item | Detail |
|---|---|
| Issuer | Jio Platforms Limited, a Reliance Industries subsidiary |
| Bidding | October 21–23, 2026 |
| Final price | ₹1,119 (band ₹1,065–1,119); lot of 12 shares |
| Issue | ₹30,213 crore, 100% fresh issue, no offer for sale |
| Use of proceeds | Prepay or repay Reliance Jio Infocomm (RJIL) borrowings; general corporate purposes capped at 25% |
| Anchors | ₹8,110 crore from 212 anchor investors at ₹1,119 |
| Subscription | About 22.2× overall; full subscription within roughly 100 minutes |
| Allotment / listing | October 26 / October 28 on NSE and BSE |
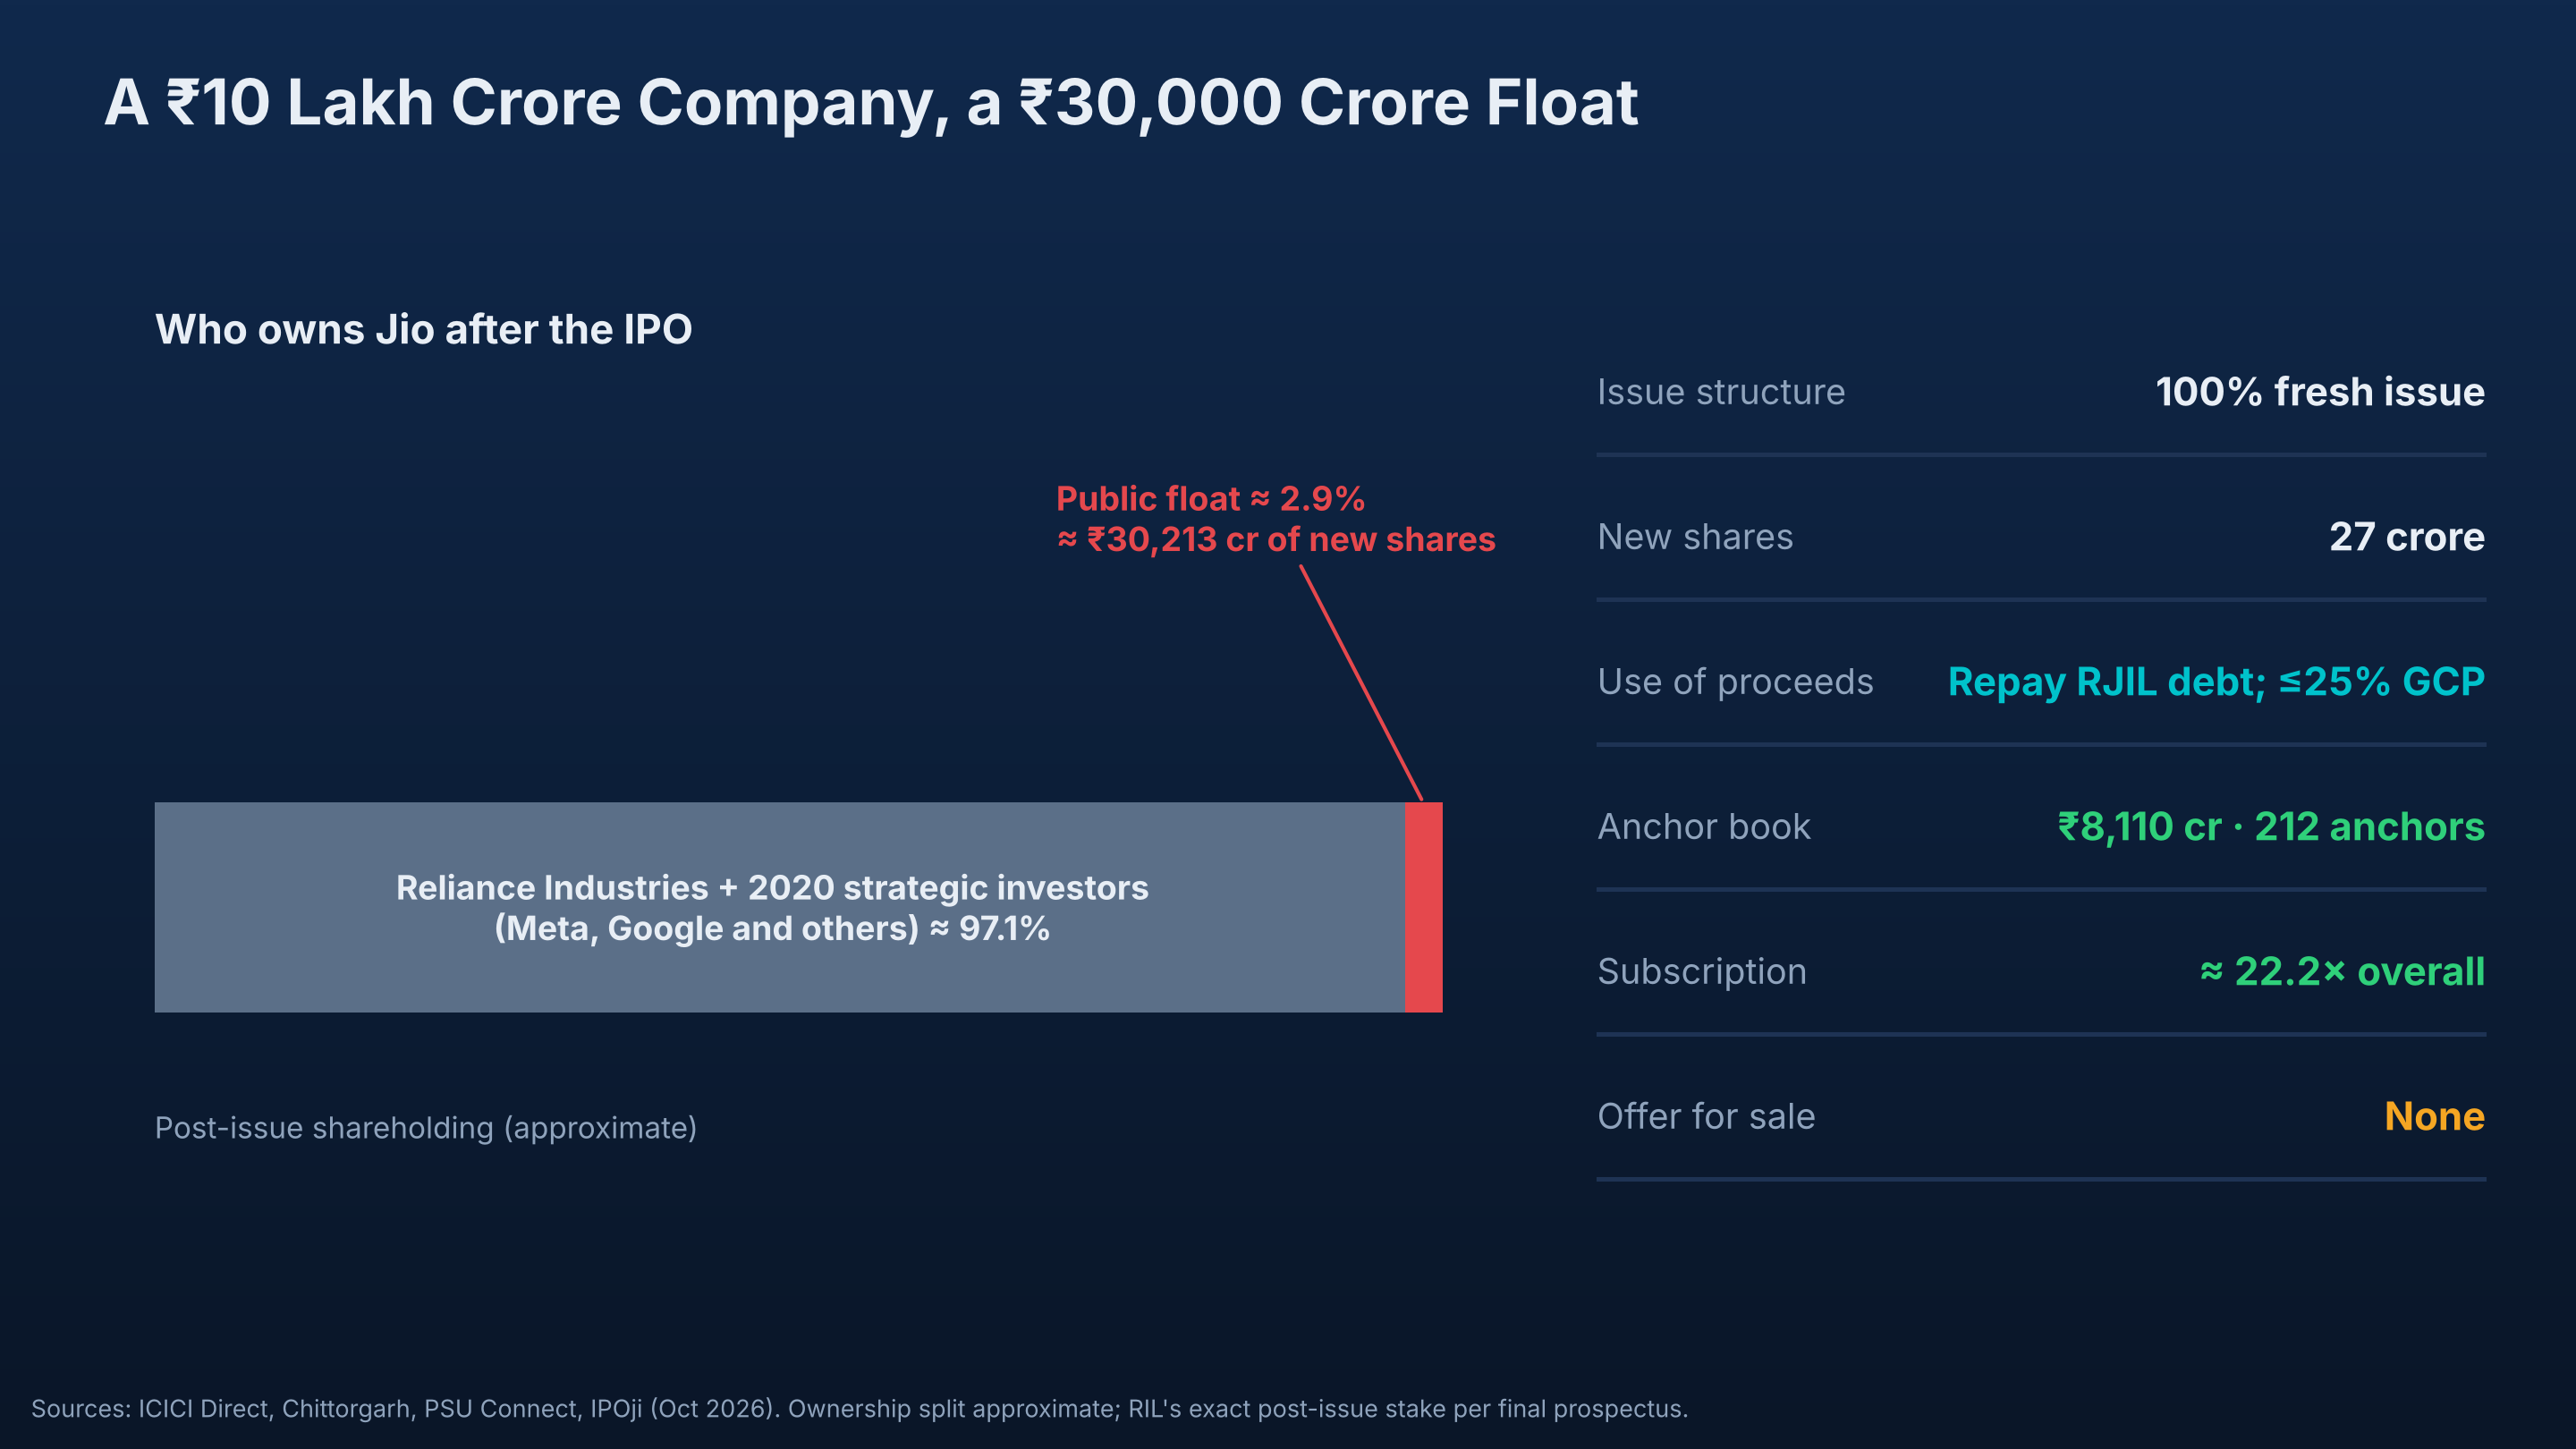
Three features of the structure shape everything that follows:
- No one is cashing out. Meta, Google and the other 2020 investors are not selling. All proceeds go to the company, mostly to retire RJIL debt.
- The float is tiny. About 2.9% of the company trades publicly, possible only because SEBI eased minimum-float rules for very large issuers. Thin floats amplify scarcity premia on the way up and volatility on the way down.
- Retail came in force. Retail investors bid more than ₹6,900 crore on day one, reportedly a record for any Indian IPO.
Representative image of an NSE listing ceremony (Kross Limited, September 2024). Not the Jio Platforms listing.
A note on the numbers in circulation. Some write-ups quote an issue size of ₹30,188 crore and a P/E of 33.3×. The arithmetic gives ₹30,213 crore (27 crore × ₹1,119). The 33.3× uses pre-issue EPS of ₹33.6; on the post-issue share count of ≈920.9 crore, EPS is ≈₹32.6 and the P/E is ≈34.3×, which is what an incoming shareholder actually pays.
2. How far the valuation has travelled#↑ Contents
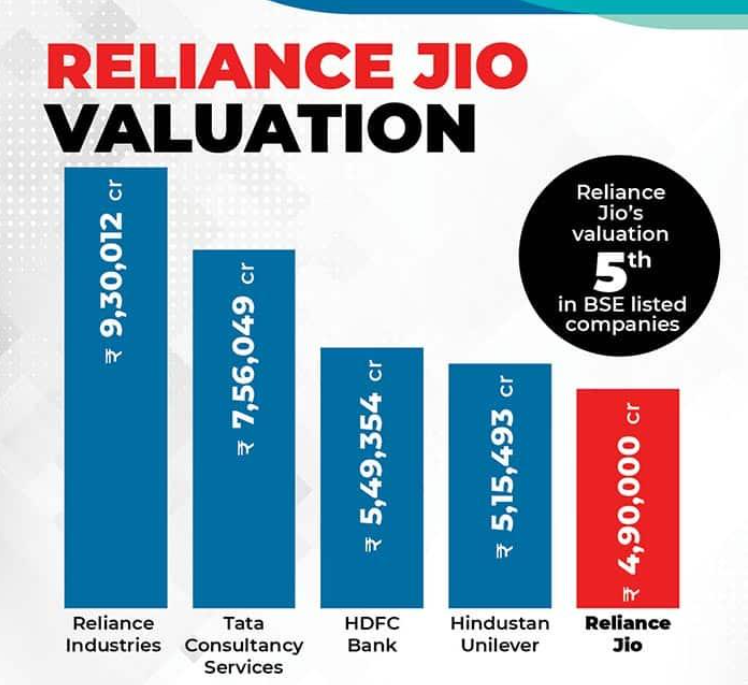
An earlier market estimate put Jio's value at about ₹4.9 lakh crore, fifth among BSE-listed companies at the time. Peer figures in this graphic are historical and have since changed.
| Measure | Earlier estimate | IPO, October 2026 | Change |
|---|---|---|---|
| Jio equity value | ≈ ₹4.9 lakh crore | ≈ ₹10.3 lakh crore | ≈ 2.1× |
Jio's equity value has roughly doubled from that earlier benchmark. Part of the rise is earned: revenue, EBITDA and profit all compounded strongly (Section 3). The rest is expectation. The job of a valuation analyst is to separate the two.
3. The business: a telecom network with a platform option#↑ Contents
Illustrative image.
Economically, Jio Platforms is a mobile network. Reliance Jio Infocomm produced 87.7% of FY26 revenue, 94.9% of EBITDA and 93.8% of profit. Home broadband, enterprise, digital services, cloud and AI are the growth story, but they are still a small share of the earnings being priced.
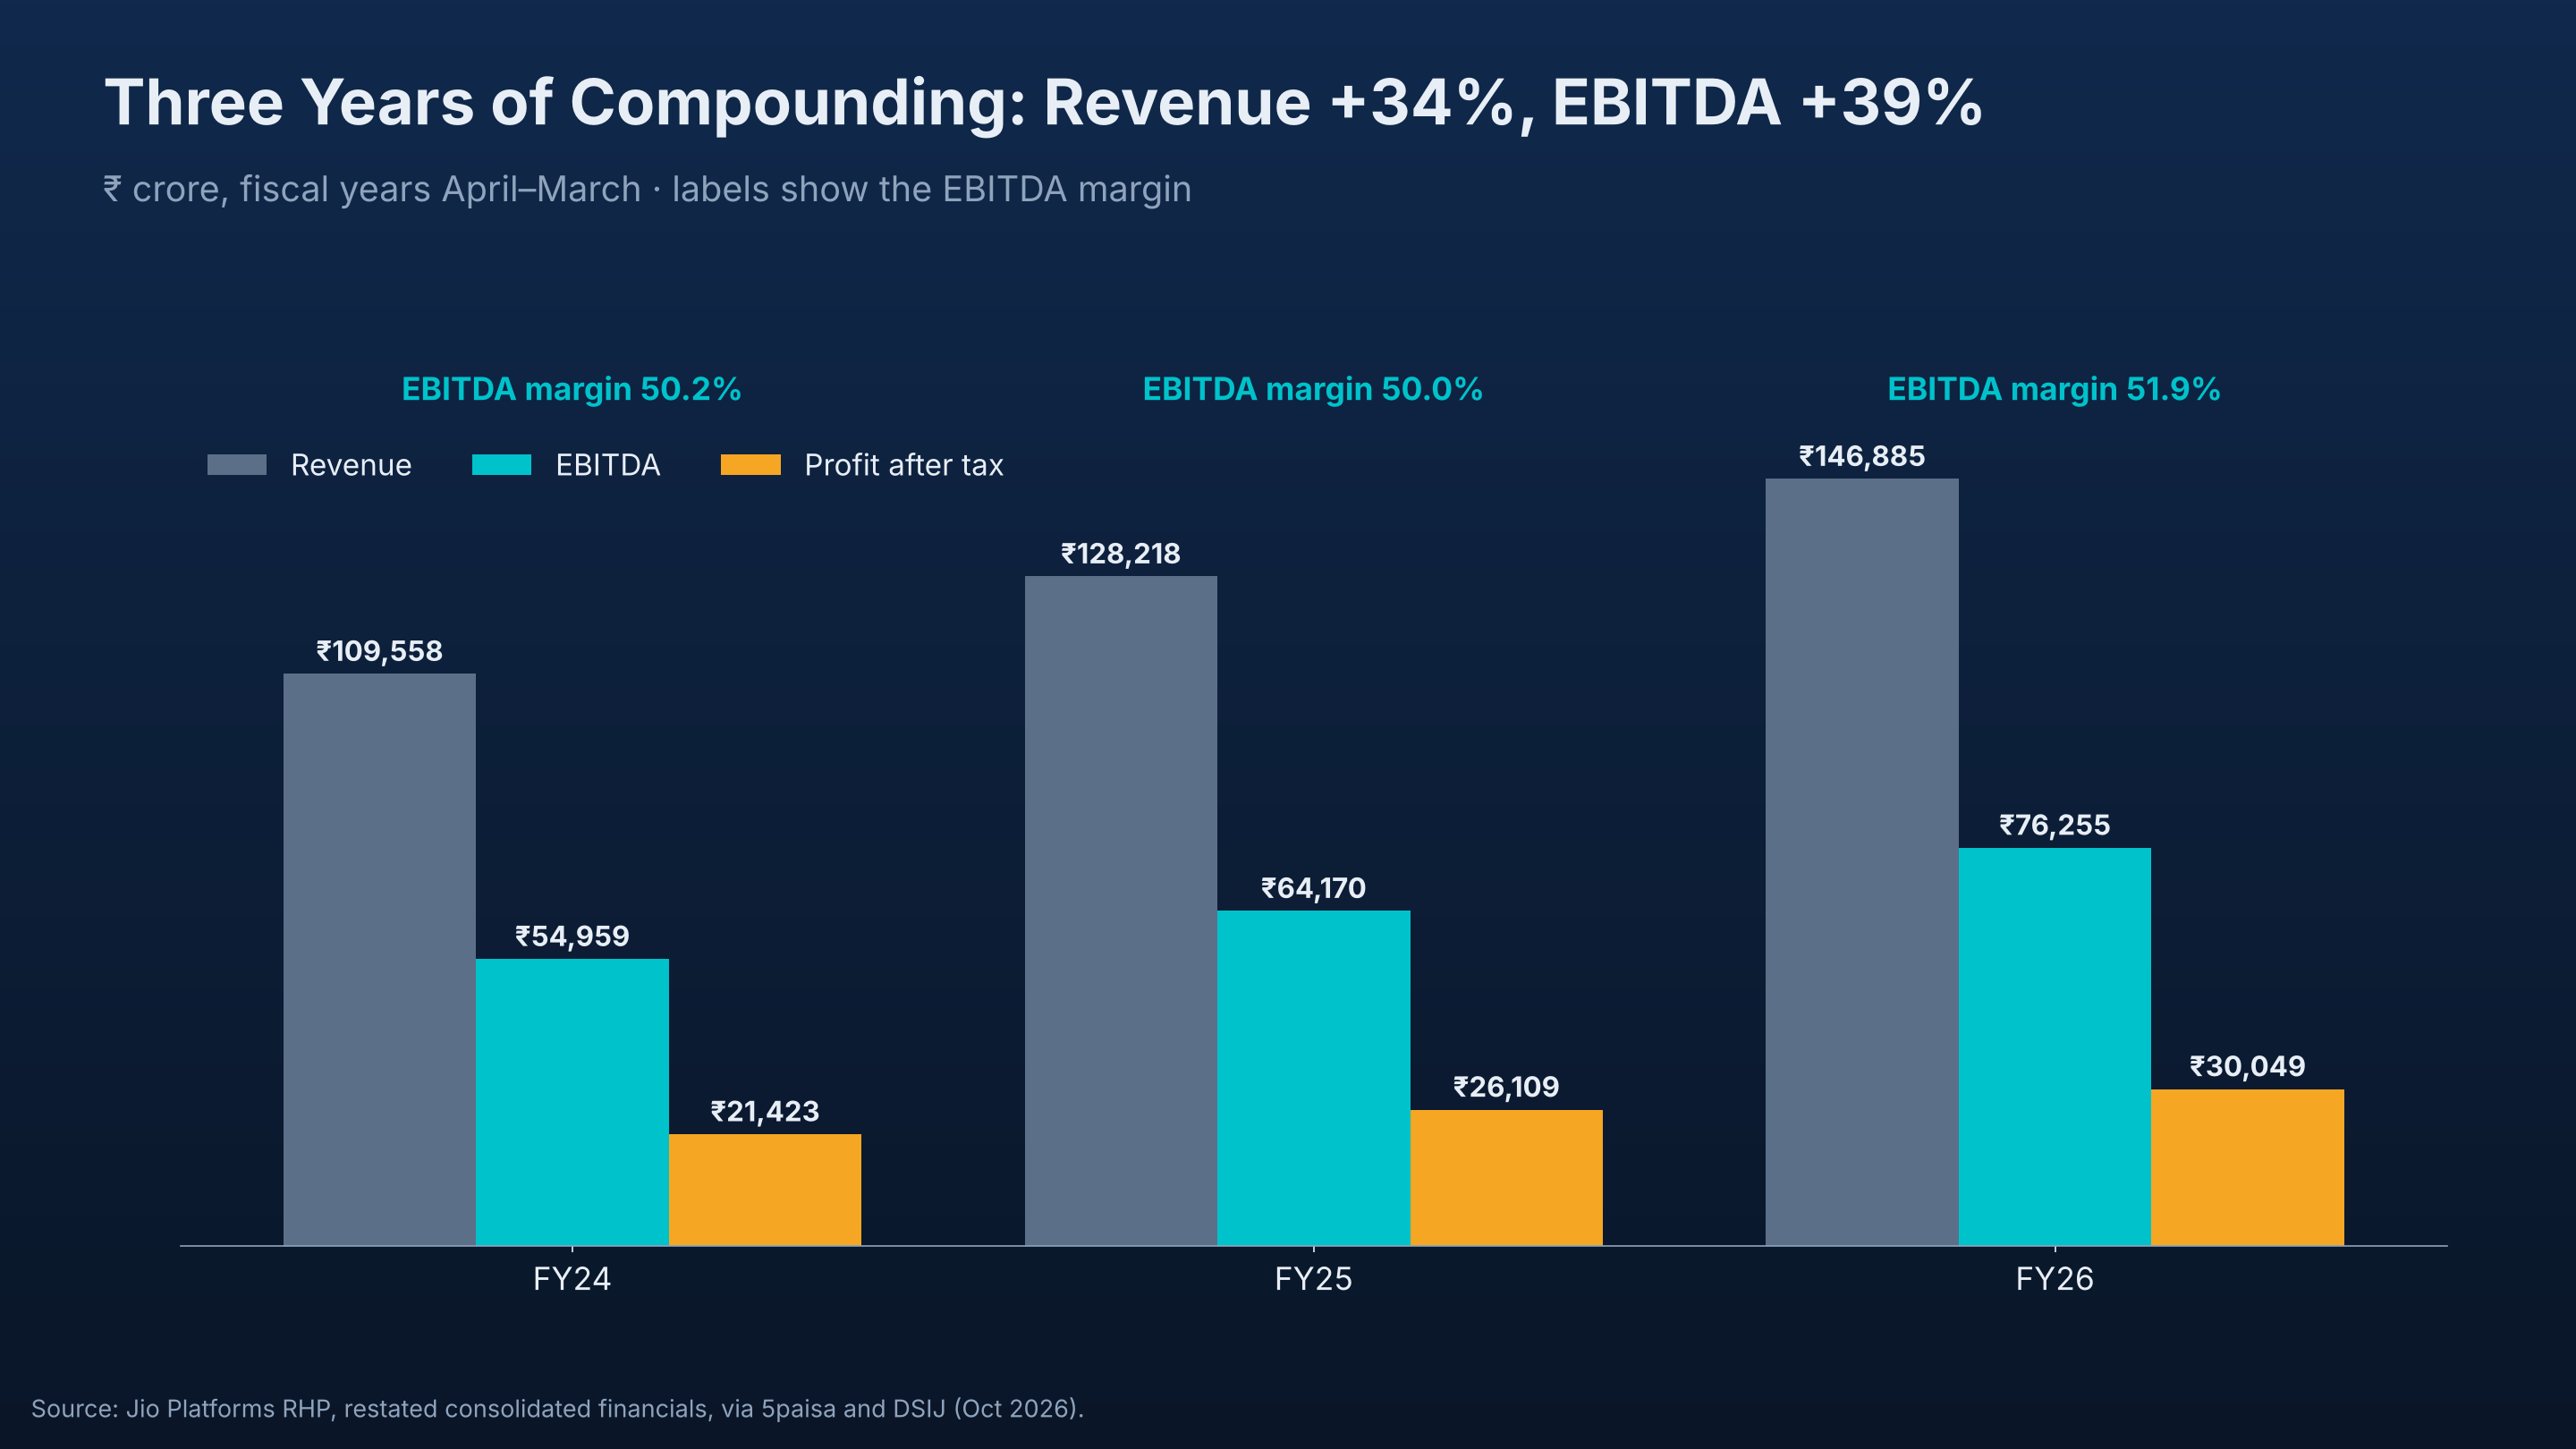
| ₹ crore (FY = April–March) | FY24 | FY25 | FY26 | Q1 FY27 |
|---|---|---|---|---|
| Revenue from operations | 1,09,558 | 1,28,218 | 1,46,885 | 39,173 |
| EBITDA (incl. other income) | 54,959 | 64,170 | 76,255 | 20,865 |
| EBITDA margin | 50.2% | 50.1% | 51.9% | 53.3% |
| Profit after tax | 21,423 | 26,109 | 30,049 | 7,764 |
| Cash from operations | 57,662 | 68,156 | 77,556 | — |
| Return on avg. capital employed | 12.8% | 12.5% | 10.8% | — |
Operating metrics are moving the right way: 36.2 million net subscriber additions in FY26, a 268 million 5G base, exit-quarter ARPU of ₹214 (from ₹181.7 two years earlier) and fixed-broadband customers up 55%.
Three observations on earnings quality:
- Growth is real but telecom-paced. Revenue compounded about 15.8% a year over FY24–26 and EBITDA about 17.8%. Excellent for a network; not hyper-growth.
- EBITDA depends on definition. Reported EBITDA includes other income. Excluding it, FY26 EBITDA is about ₹73,400 crore. Recurring network cash flows should be valued on the lower figure.
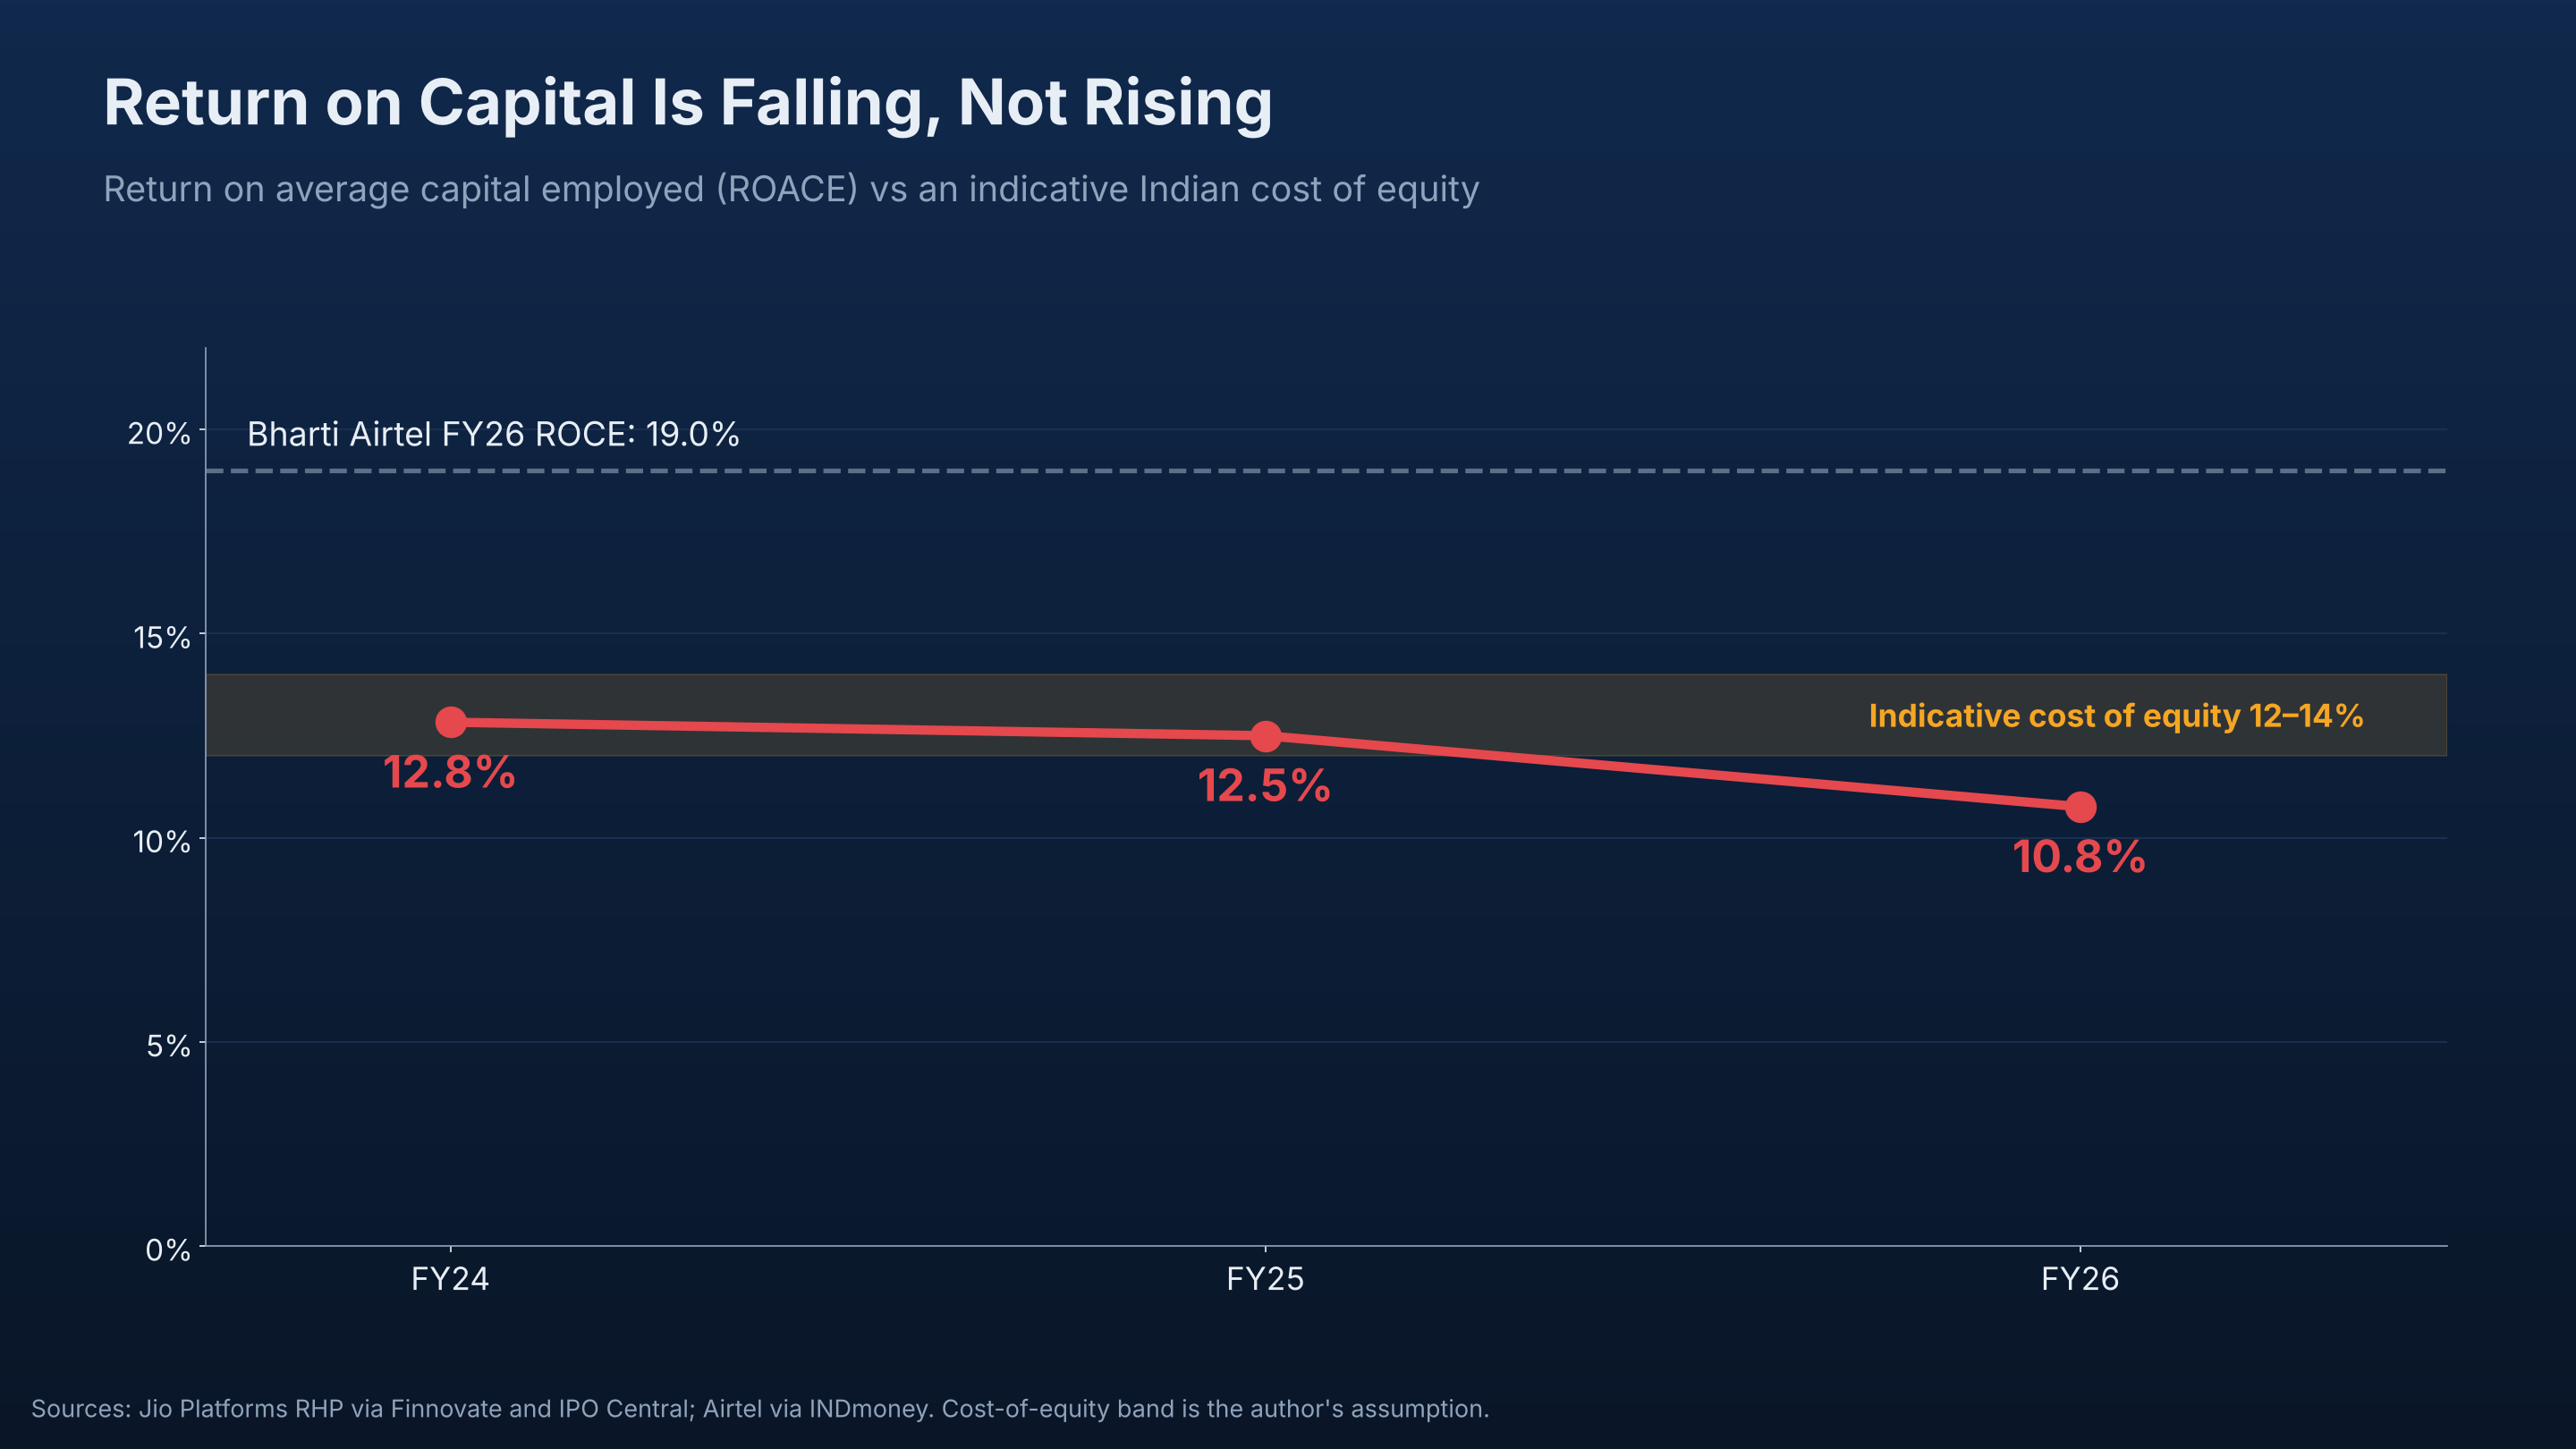
- Returns on capital are falling. ROACE slid from 12.8% to 10.8% as spectrum and 5G assets entered the base. That is roughly Jio's cost of capital, not a large spread above it.
4. The balance sheet: net cash on paper, spectrum debt underneath#↑ Contents
| Item | ₹ crore |
|---|---|
| Total borrowings, June 30, 2026 | ≈ 61,372 |
| Cash and marketable securities | ≈ 51,833 |
| Net debt, June 2026 | ≈ 9,539 |
| Fresh equity from the IPO | 30,213 |
| Net cash after the IPO (before issue costs) | ≈ 20,700 |
| Deferred spectrum obligations | ≈ 1,04,000 |
| Economic net debt (incl. spectrum) | ≈ 83,300 |
After the IPO, Jio holds net cash on conventional debt. But Indian telcos pay for spectrum in instalments, and those deferred payments are debt-like claims senior to equity. Any honest enterprise-value calculation includes them.
The cash story is improving fast. Cash capex fell 36%, from ₹53,510 crore in FY24 to ₹34,184 crore in FY26, as the 5G build-out matured. EBITDA less capex rose from almost nothing to ₹42,071 crore.
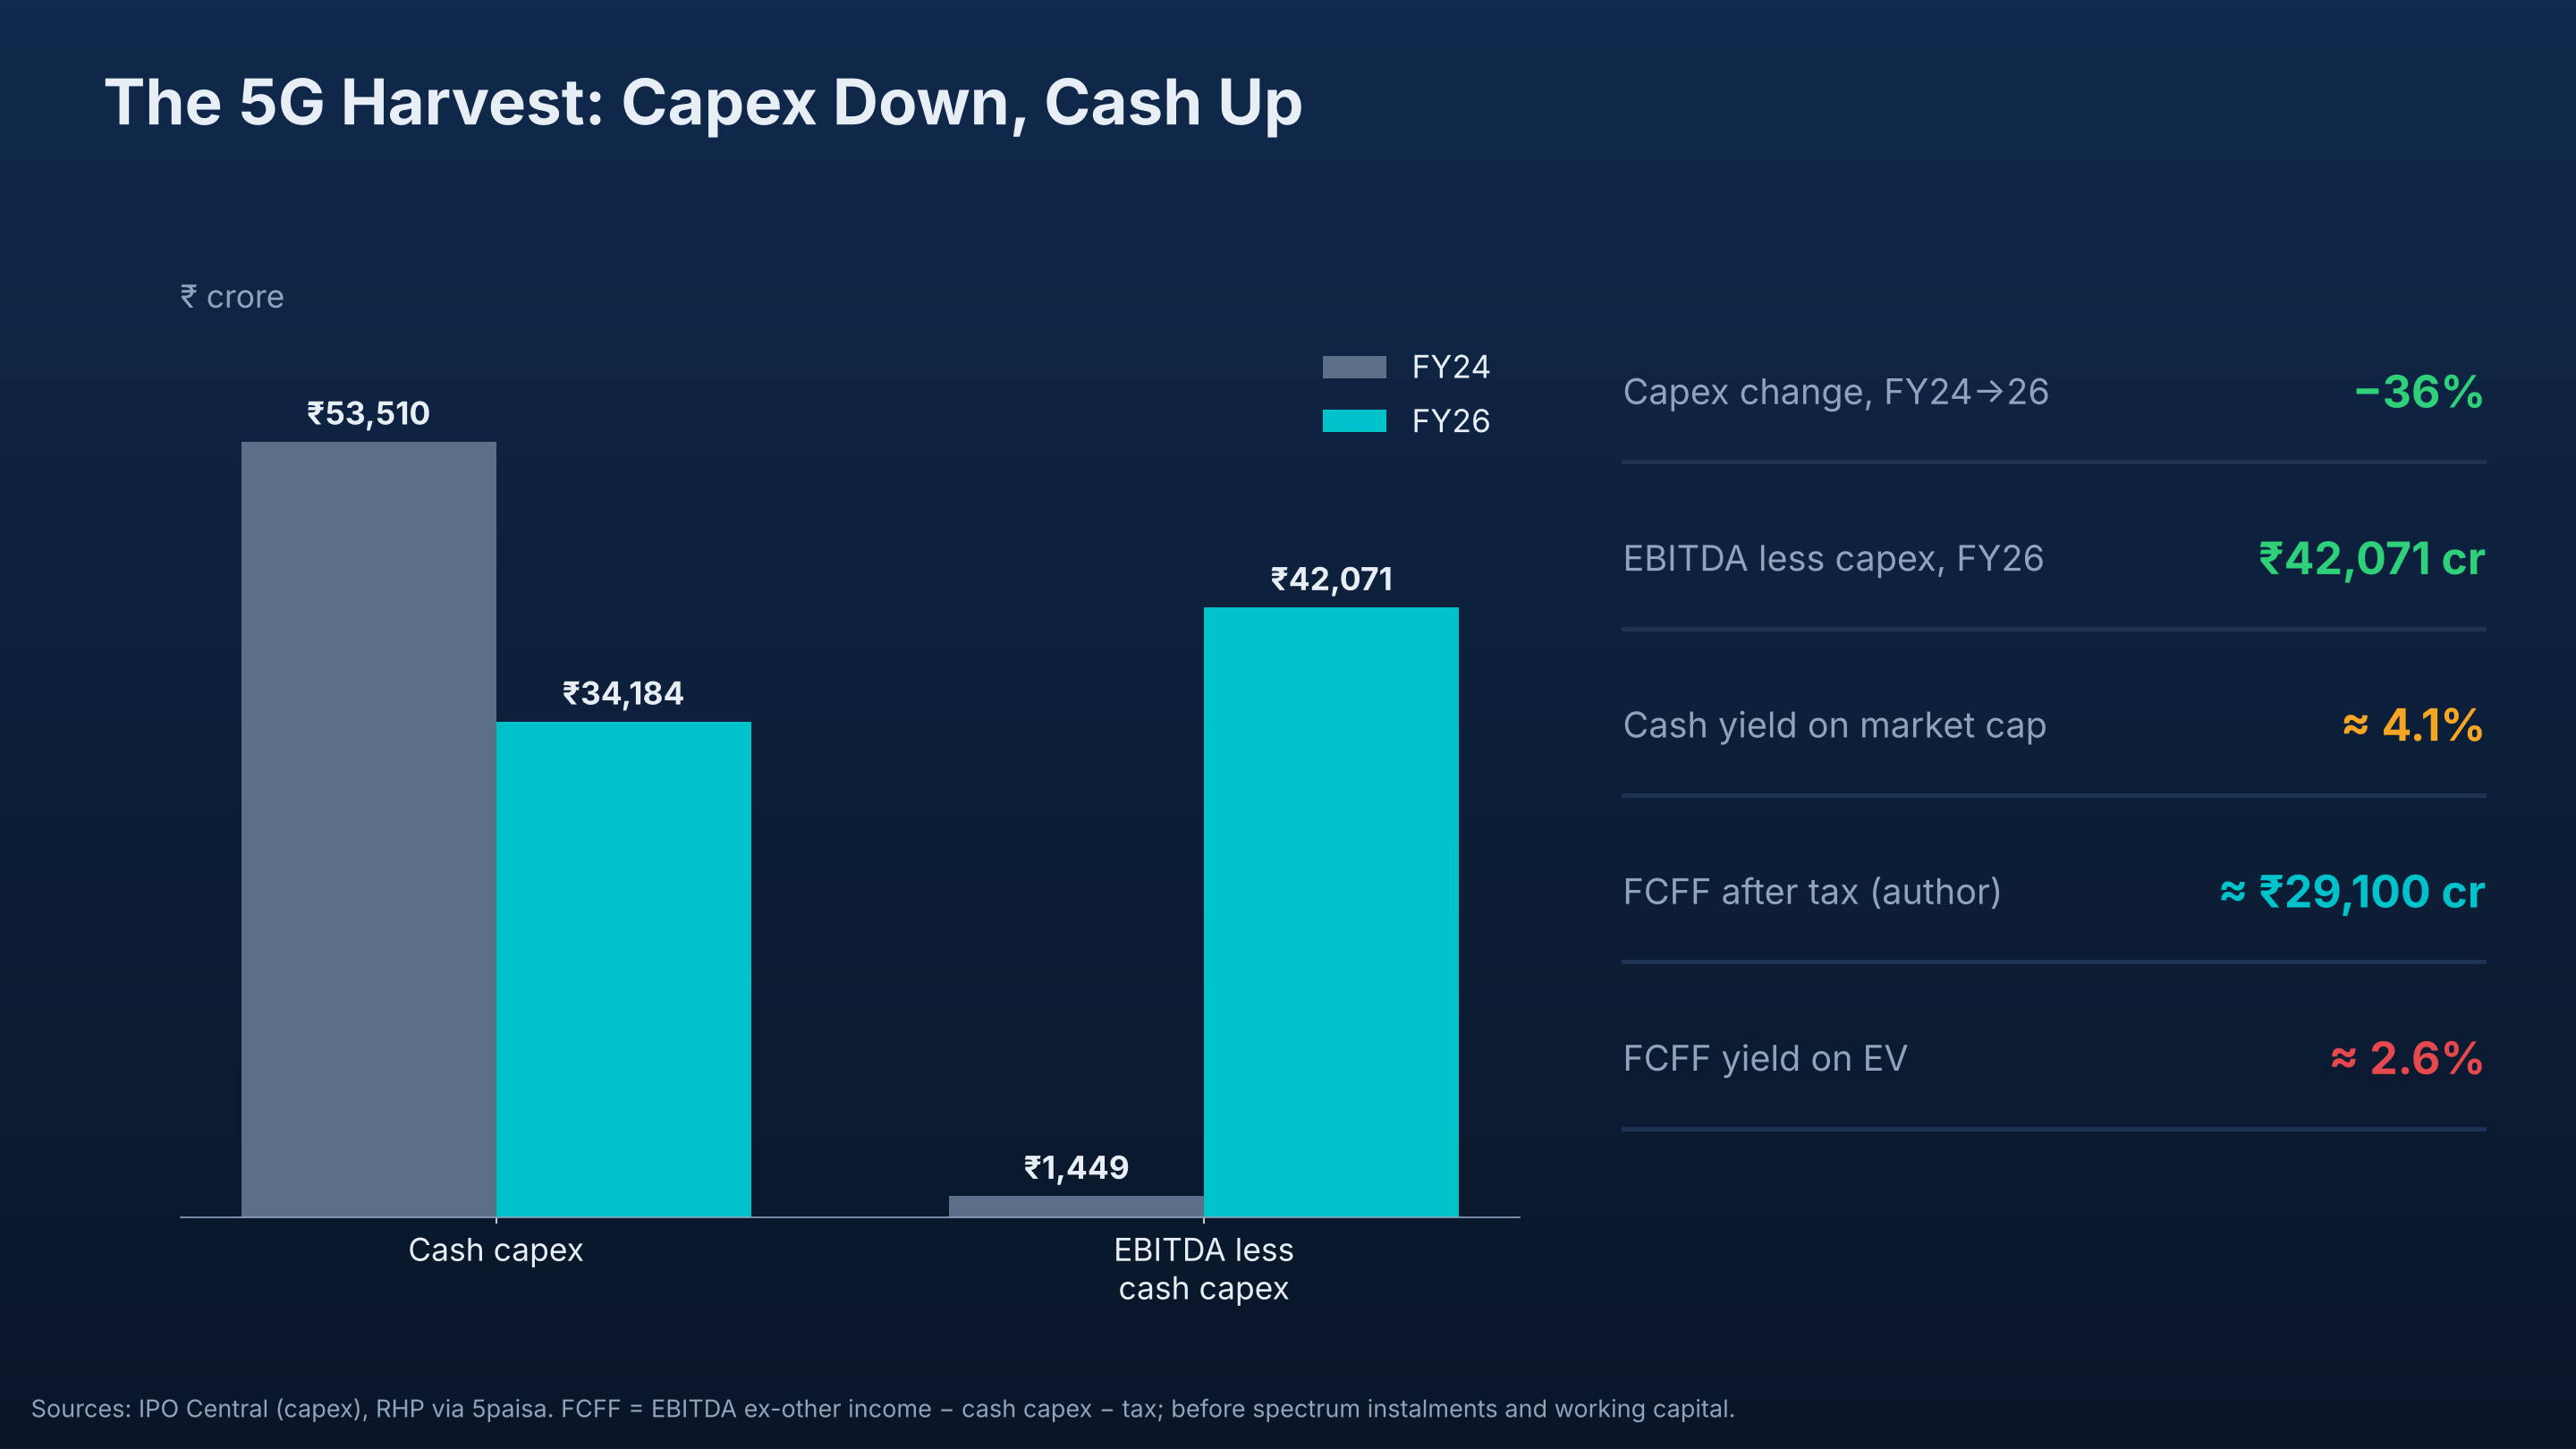
The catch is the yield. After tax, my estimate of FY26 free cash flow to the firm is about ₹29,100 crore, a 2.6% yield on enterprise value. Investors are paying for the trajectory of that number, not its current level.
5. Relative value: Jio versus Bharti Airtel#↑ Contents
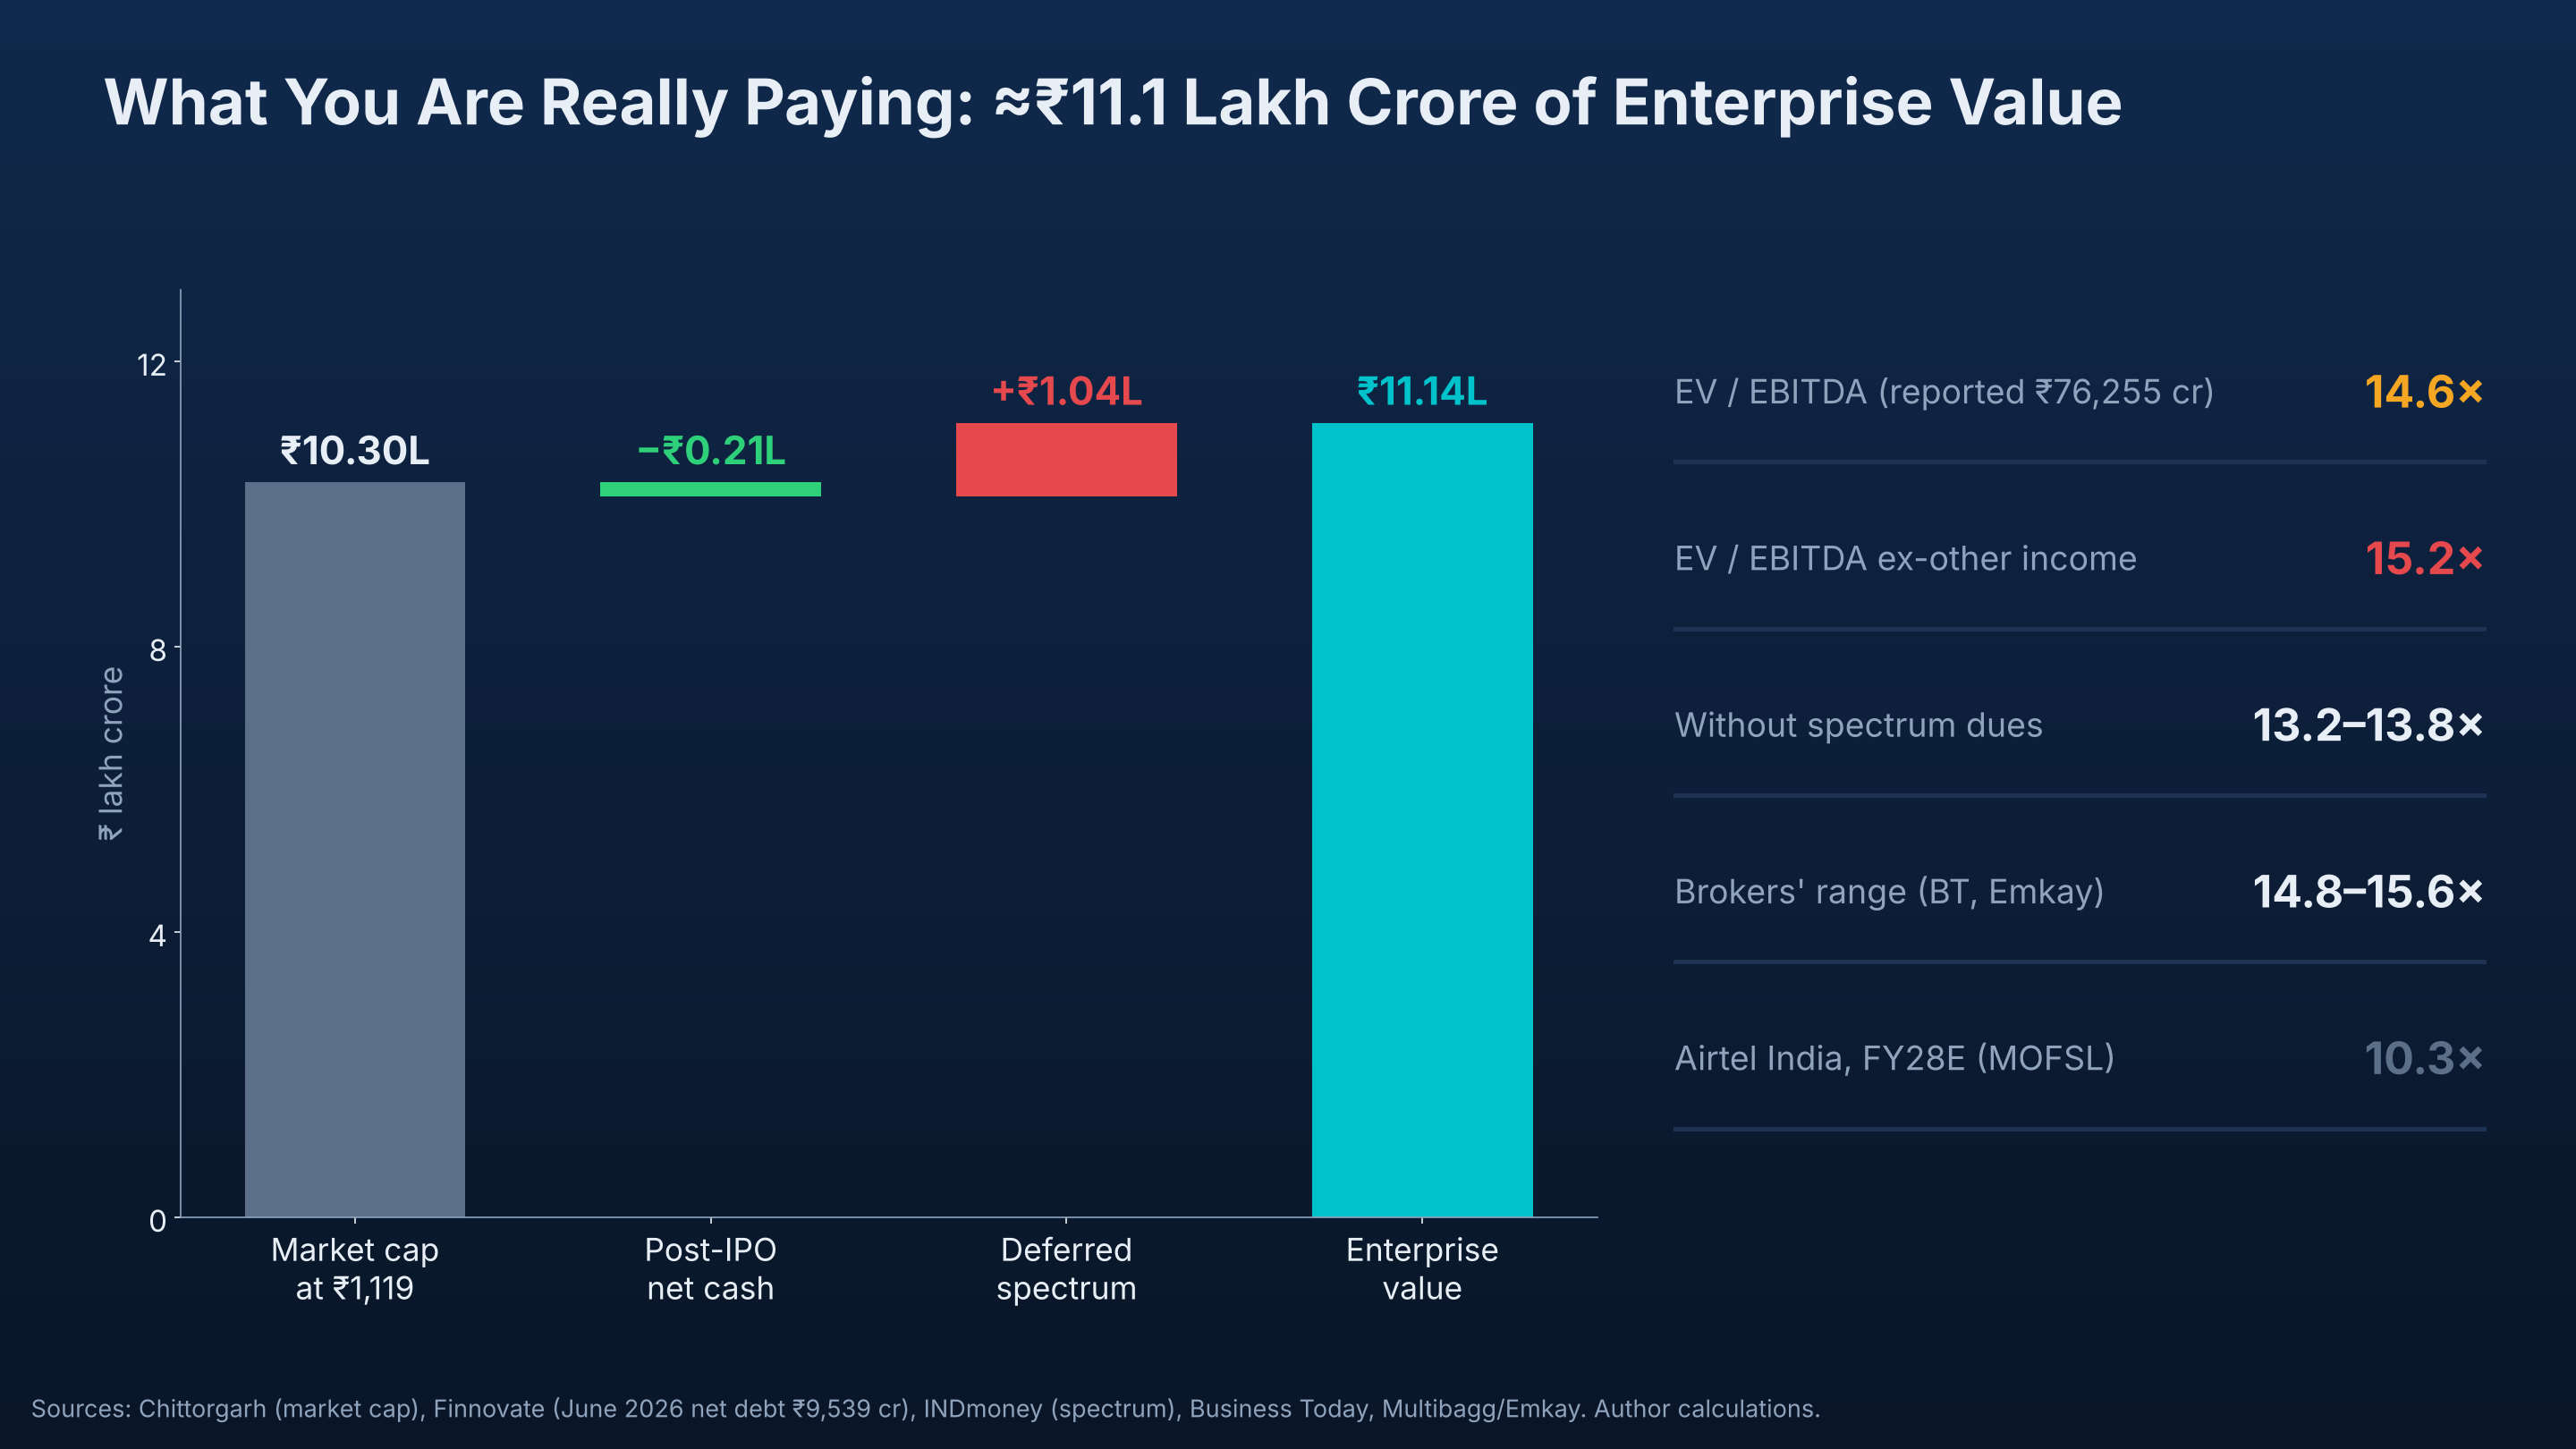
| EV build | EV (₹ lakh cr) | ÷ reported EBITDA (₹76,255 cr) | ÷ EBITDA ex-other income (₹73,400 cr) |
|---|---|---|---|
| Market cap + post-IPO net cash | ≈ 10.10 | 13.2× | 13.8× |
| + deferred spectrum ≈ ₹1.04 lakh cr | ≈ 11.14 | 14.6× | 15.2× |
The second row is the defensible one. It reconciles with brokers' published figures of 14.8× (Business Today) and 15.0–15.6× (Emkay).
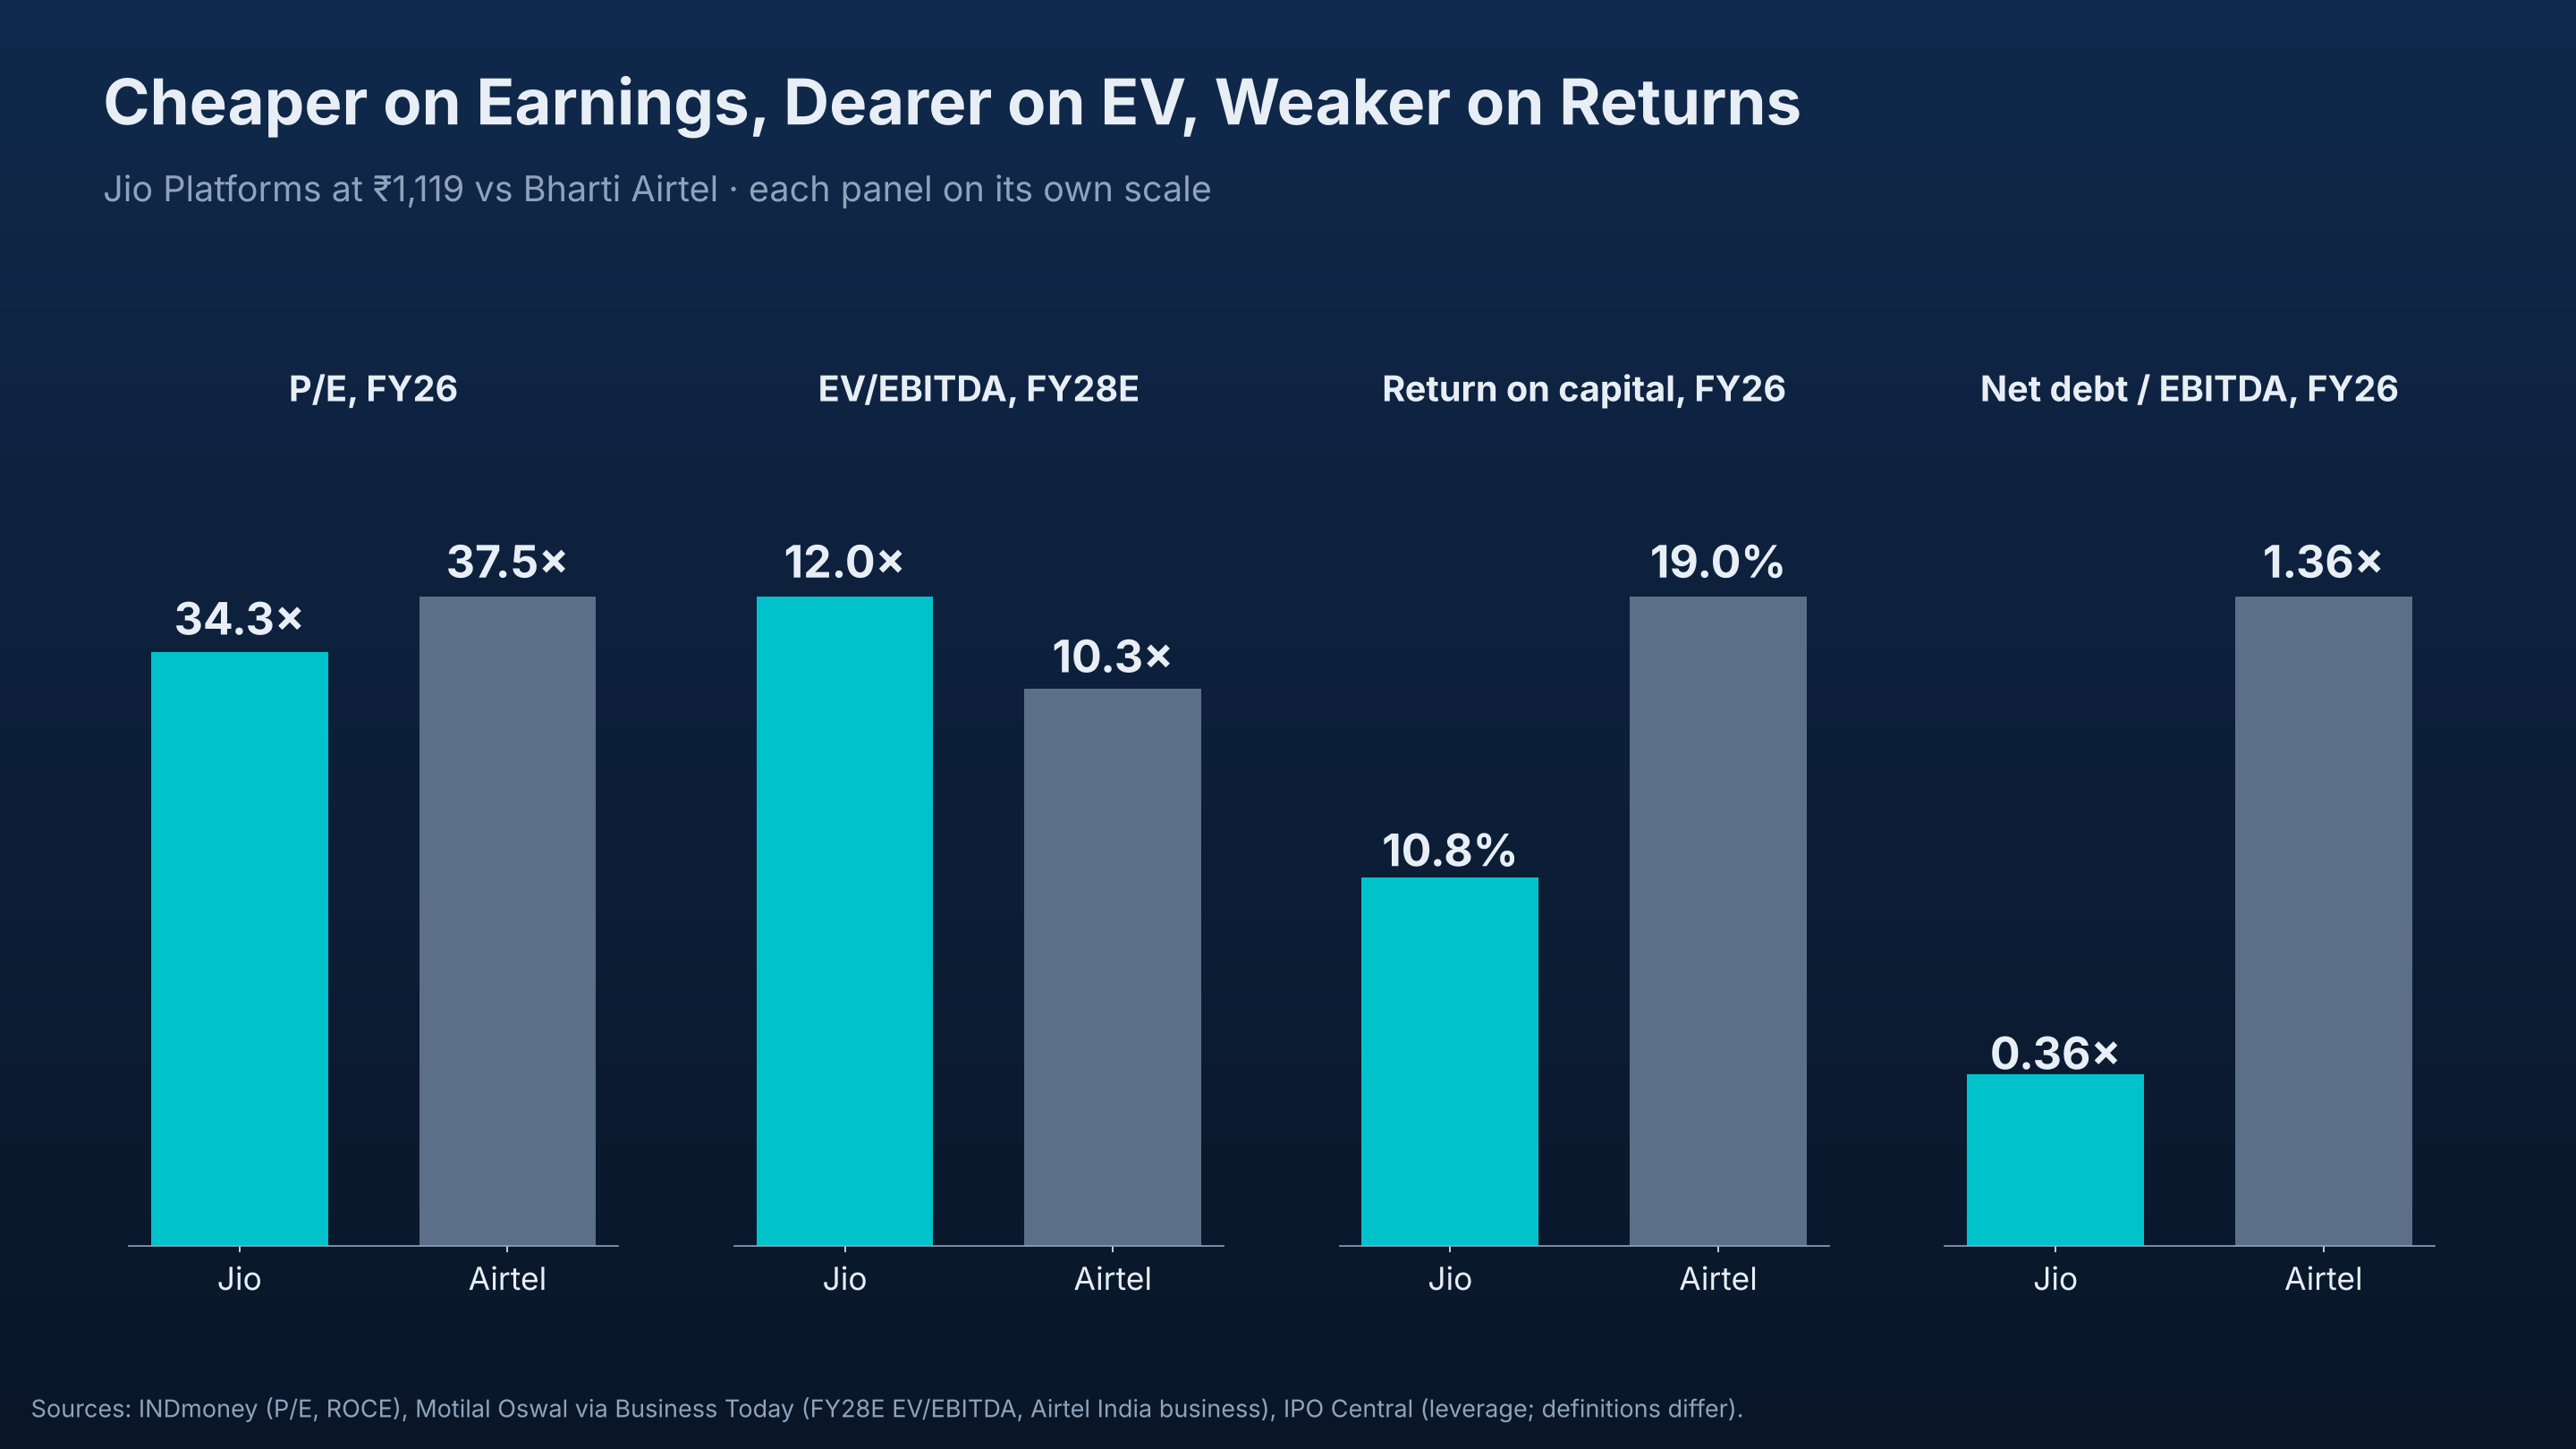
| Metric | Jio Platforms (₹1,119) | Bharti Airtel |
|---|---|---|
| P/E, FY26 | ≈ 34.3× | ≈ 37.5× |
| EV/EBITDA, FY28E (MOFSL) | ≈ 12.0× | ≈ 10.3× (India business) |
| Return on capital, FY26 | 10.8% | 19.0% |
| Net debt / EBITDA, FY26 | 0.36× | 1.36× |
Leverage definitions differ between the two companies.
Jio looks cheaper on P/E because it carries less interest expense. It looks dearer on EV/EBITDA because the market capitalises its operating earnings at a higher rate. On forward numbers, Motilal Oswal puts Jio at a 17% premium to Airtel's India business, and Bloomberg Intelligence at 12–13× versus about 9.5× for Airtel.
A premium multiple paired with roughly half the return on capital is rational only if returns are about to converge upward. That is the bet embedded in ₹1,119.
6. The quant analysis: what the price implies#↑ Contents
Multiples tell you what the market pays. They do not tell you what the market expects. For that, I ran four models on the prospectus figures. All inputs, formulas and assumptions are listed so the results can be replicated.
Analysis 1: Reverse DCF, the growth the price requires#
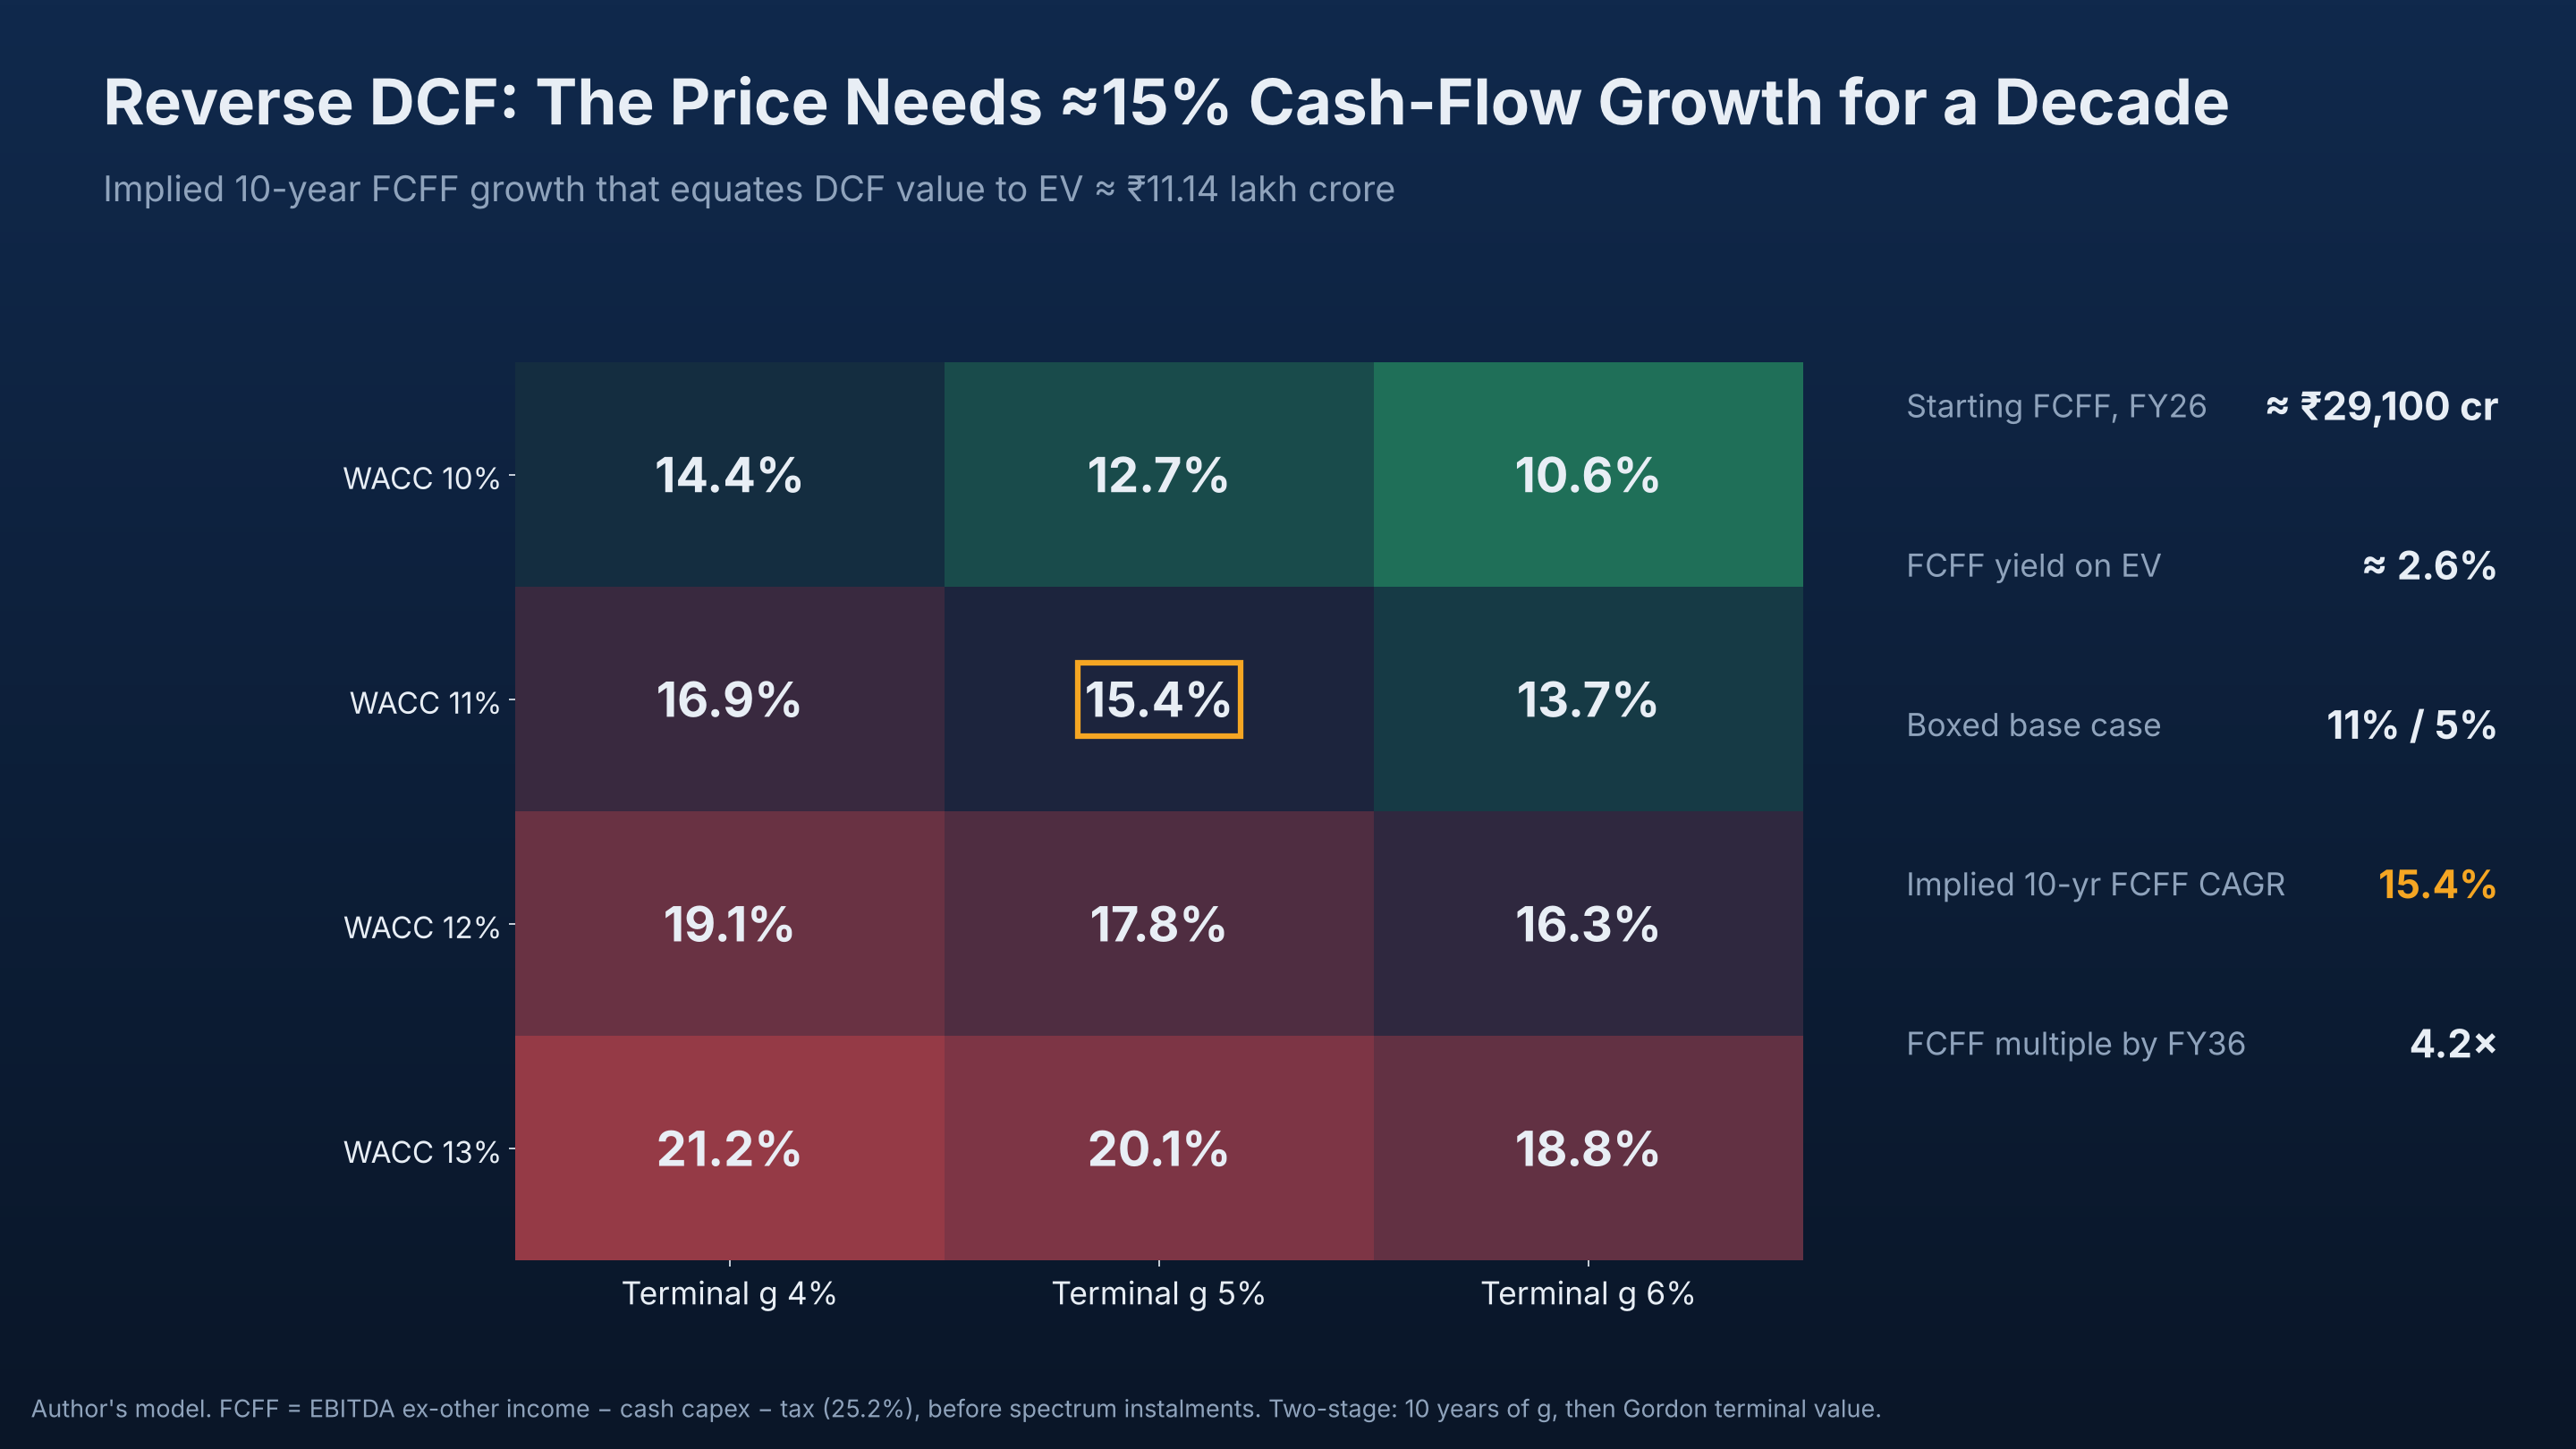
Method. I start from FY26 free cash flow to the firm, FCFF = EBITDA ex-other income − cash capex − tax ≈ ₹29,100 crore (before spectrum instalments). I then solve for the 10-year growth rate g at which a two-stage DCF equals today's enterprise value of ₹11.14 lakh crore:
EV = Σ₁¹⁰ FCFF₀(1+g)ᵗ / (1+WACC)ᵗ + [FCFF₁₀(1+g_T) / (WACC − g_T)] / (1+WACC)¹⁰
| Implied 10-year FCFF growth | Terminal g 4% | Terminal g 5% | Terminal g 6% |
|---|---|---|---|
| WACC 10% | 14.4% | 12.7% | 10.6% |
| WACC 11% | 16.9% | 15.4% | 13.7% |
| WACC 12% | 19.1% | 17.8% | 16.3% |
| WACC 13% | 21.2% | 20.1% | 18.8% |
Result. In the base case (WACC 11%, terminal growth 5%), the price requires FCFF to grow ≈15.4% a year for ten years, multiplying FY26 cash flow by ≈4.2× by FY36. Every cell in the grid demands double-digit growth. A 1-point change in WACC moves the required growth by 2–2.5 points: the valuation is highly sensitive to the discount rate.
Analysis 2: The ROE the market is pricing#
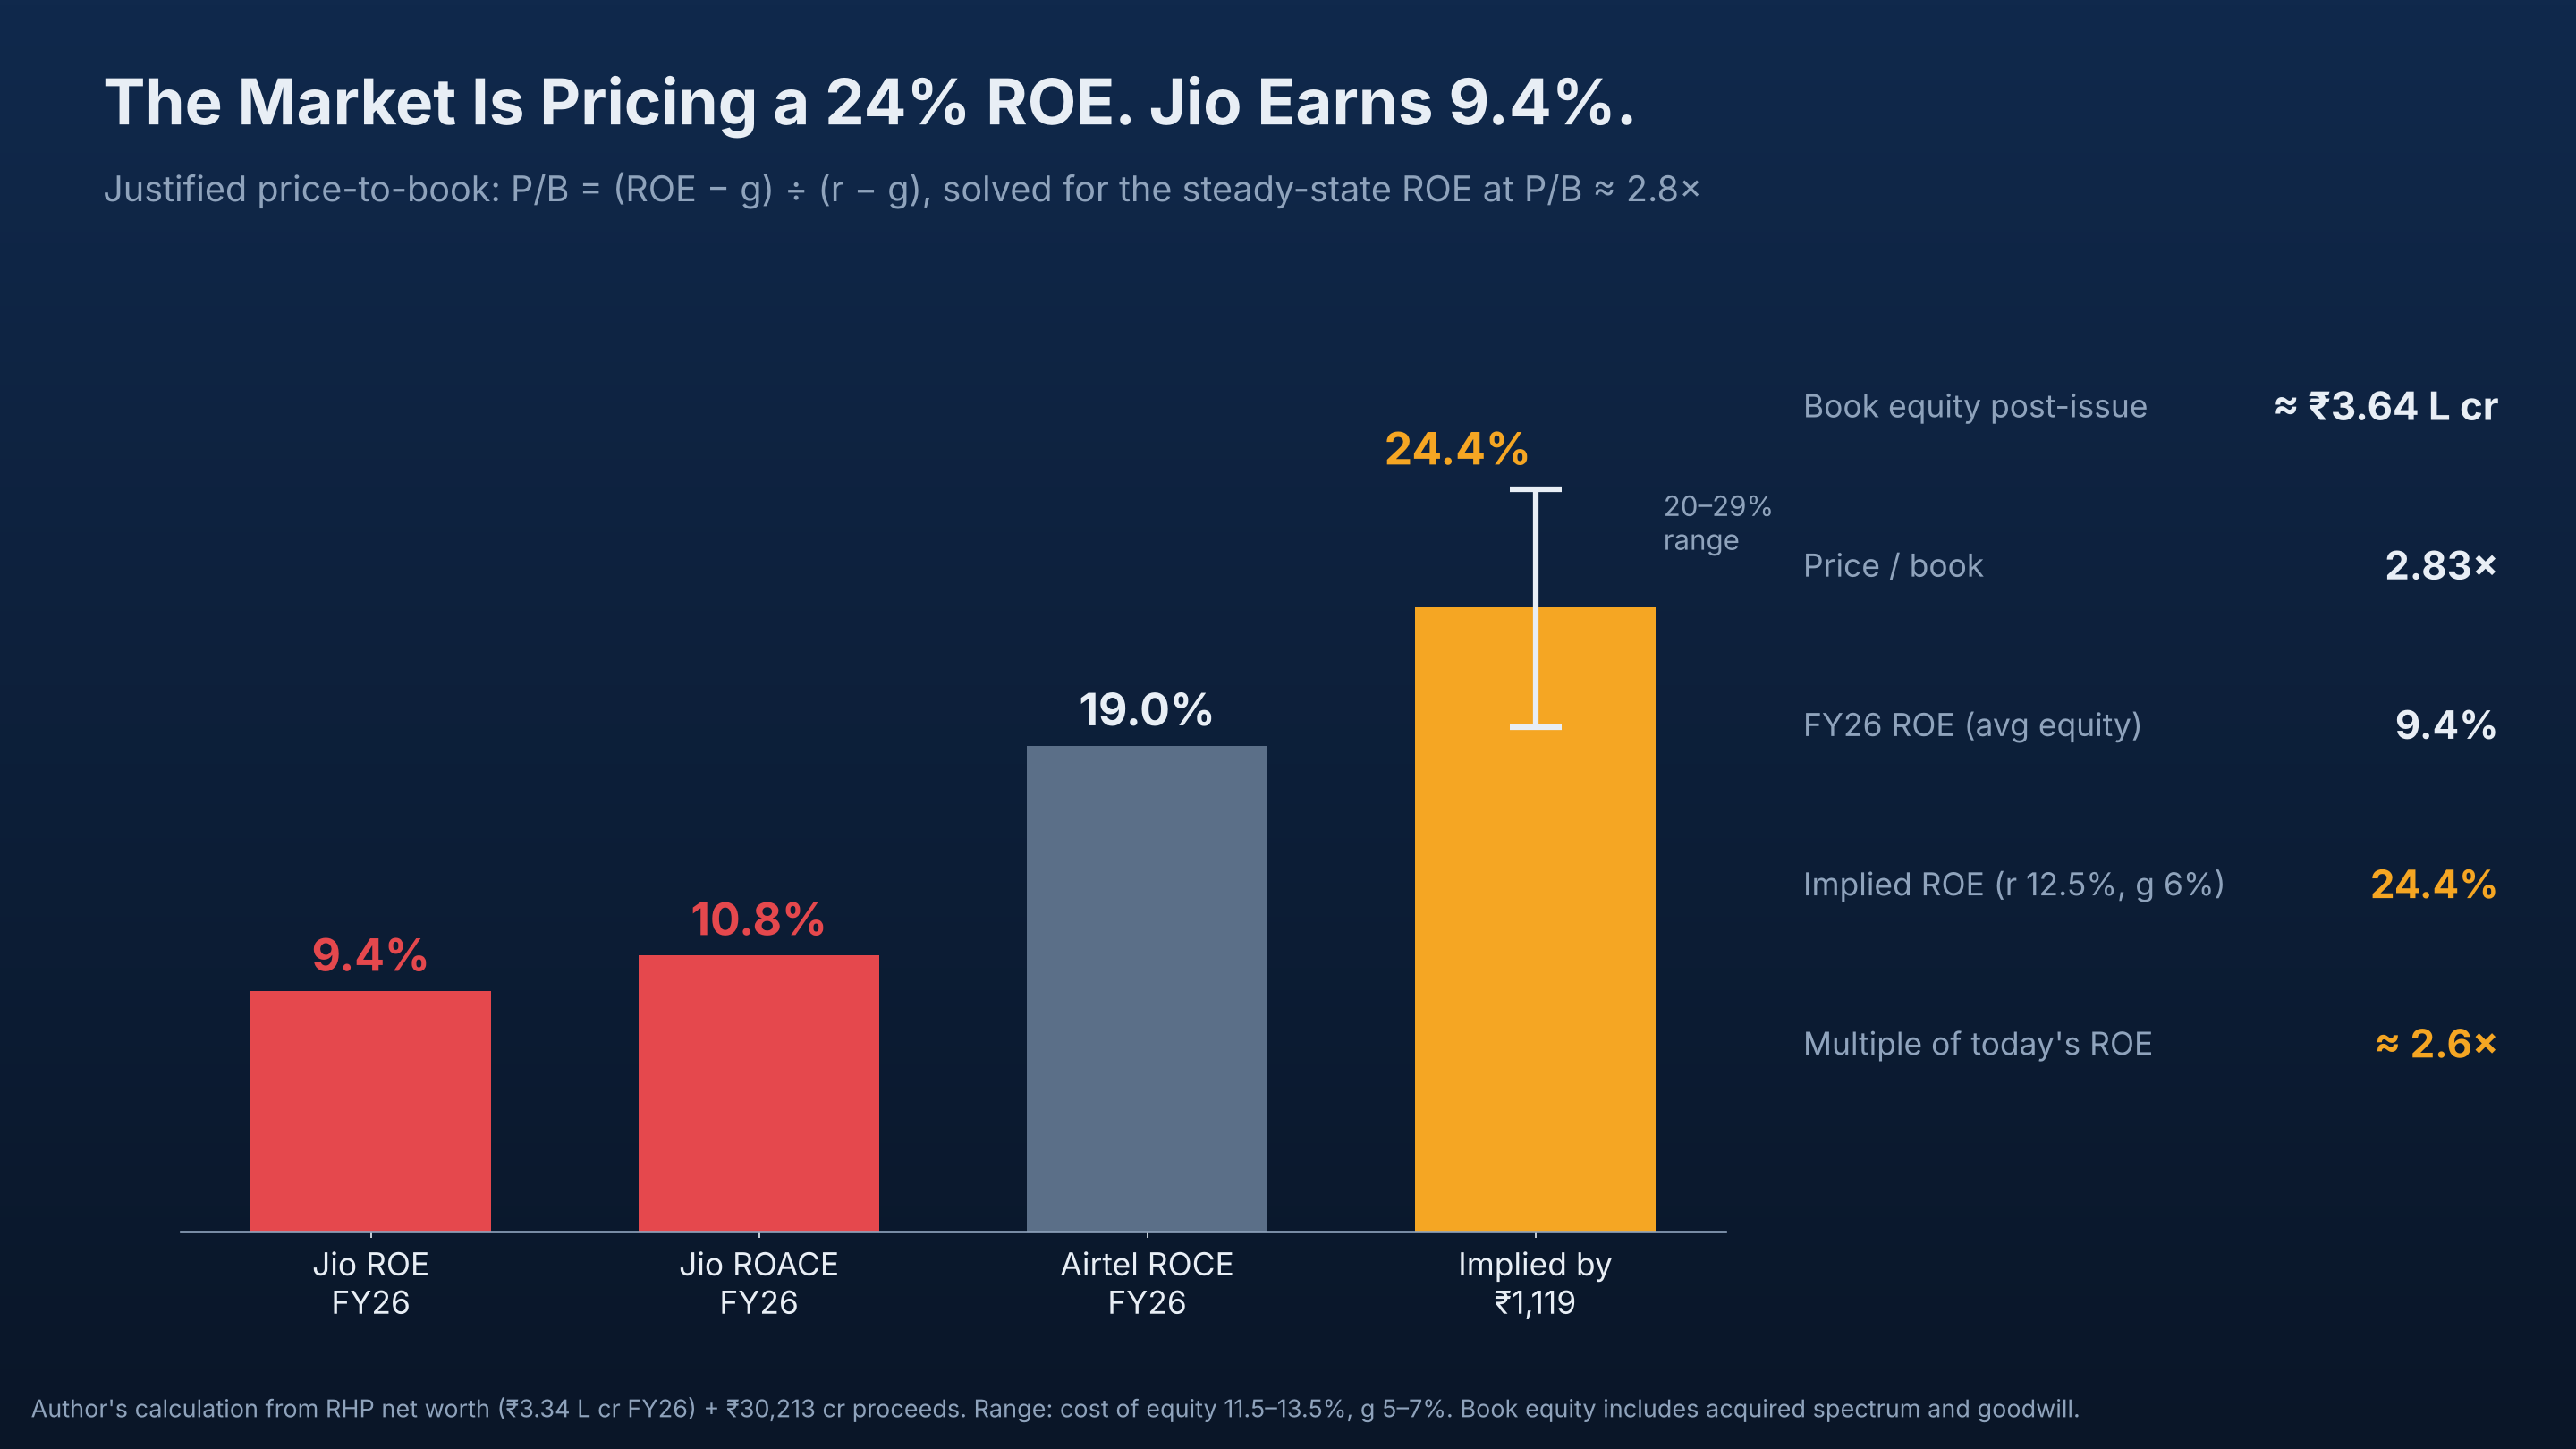
Method. For a firm in steady state, the justified price-to-book ratio is:
P/B = (ROE − g) / (r − g)
Solving for ROE gives the long-run return on equity that today's price implies: ROE = g + P/B × (r − g).
| Input | Value |
|---|---|
| Book equity after the IPO | ≈ ₹3.64 lakh crore |
| Price-to-book at ₹1,119 | 2.83× |
| FY26 ROE (average equity) | 9.4% |
| Implied steady-state ROE | g = 5% | g = 6% | g = 7% |
|---|---|---|---|
| Cost of equity 11.5% | 23.4% | 21.6% | 19.7% |
| Cost of equity 12.5% | 26.2% | 24.4% | 22.6% |
| Cost of equity 13.5% | 29.0% | 27.2% | 25.4% |
Result. The market is pricing a long-run ROE of ≈24%, about 2.6× what Jio earned in FY26 and above Airtel's 19% ROCE. Caveat: Jio's book equity is inflated by acquired spectrum and goodwill, which depresses reported ROE. Even so, the gap is too wide to close on accounting alone. It has to close through tariffs and capital discipline.
Analysis 3: Scenario grid, growth versus exit multiple#
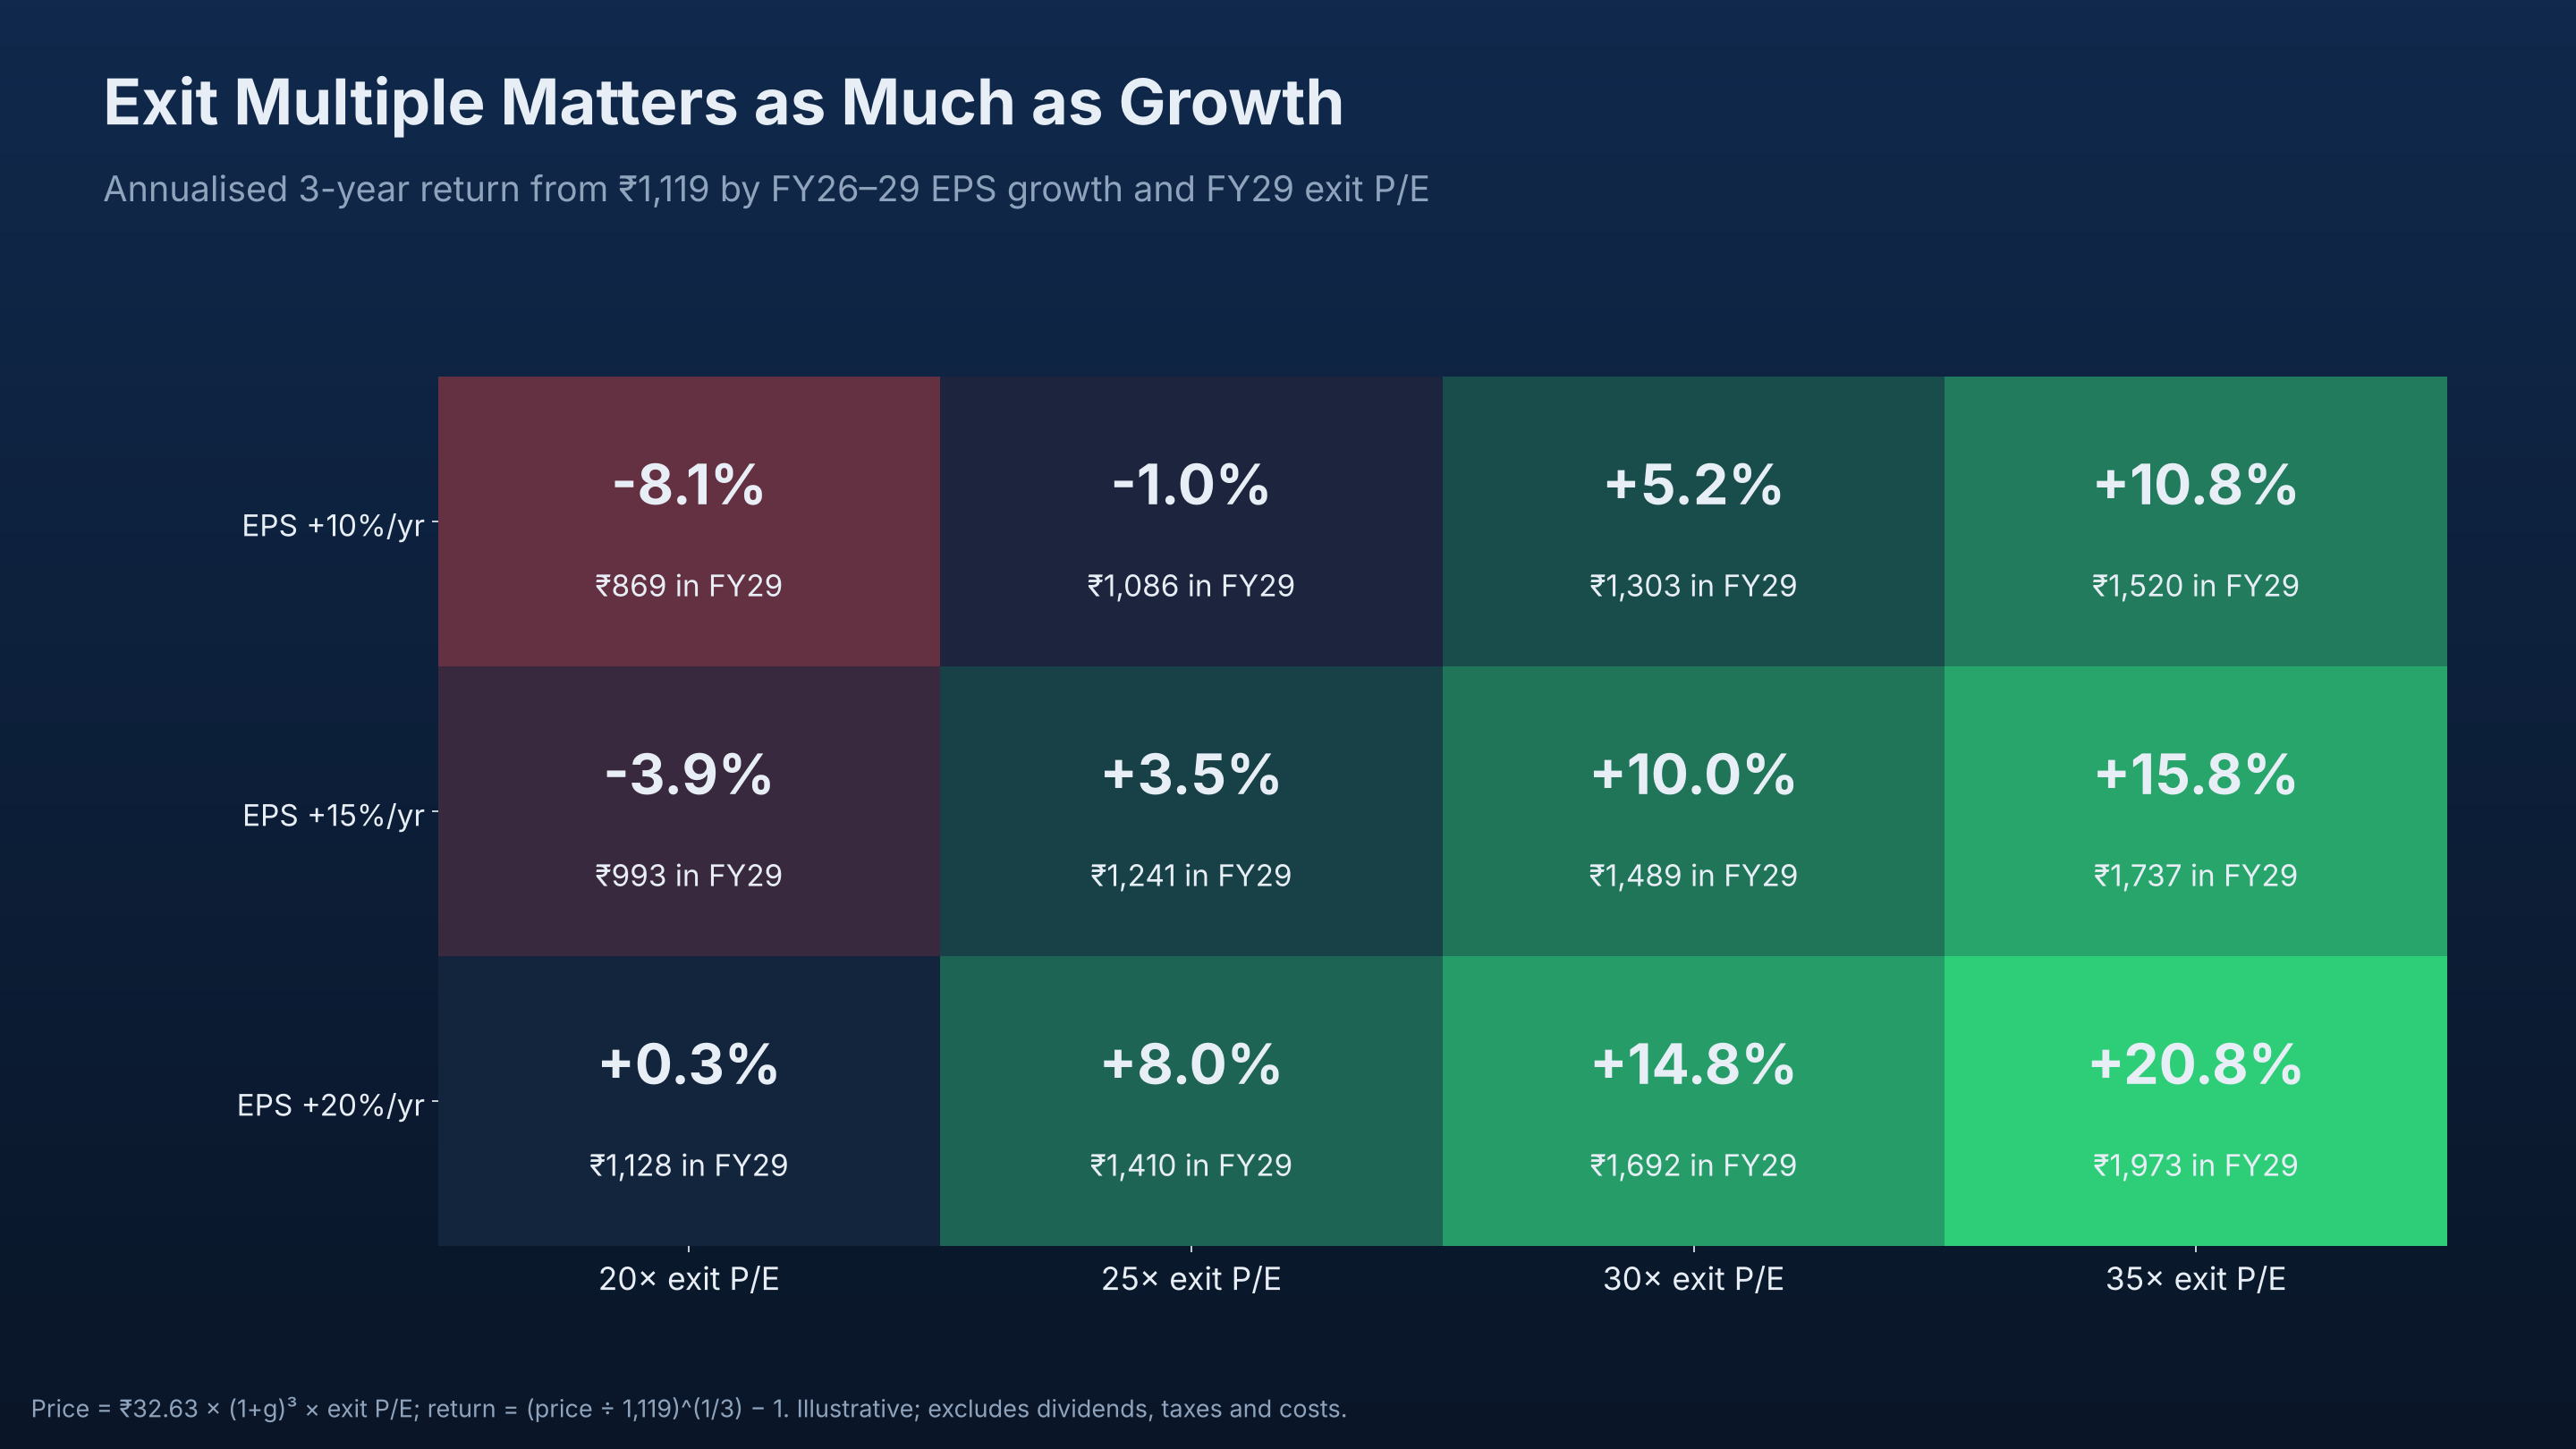
Method. FY29 price = ₹32.63 × (1 + g)³ × exit P/E; annualised return = (price ÷ 1,119)^(1/3) − 1.
| EPS growth ↓ / Exit P/E → | 20× | 25× | 30× | 35× |
|---|---|---|---|---|
| 10% a year | −8.1% | −1.0% | +5.2% | +10.8% |
| 15% a year | −3.9% | +3.5% | +10.0% | +15.8% |
| 20% a year | +0.3% | +8.0% | +14.8% | +20.8% |
Result. To earn a 12% annual return over three years, Jio needs EPS growth of ≈17% a year if the market pays 30× at exit, or ≈24% if it pays 25×. Telecom multiples tend to compress as growth matures. A five-turn de-rating can erase several years of earnings growth.
Analysis 4: Monte Carlo, 200,000 simulated futures#
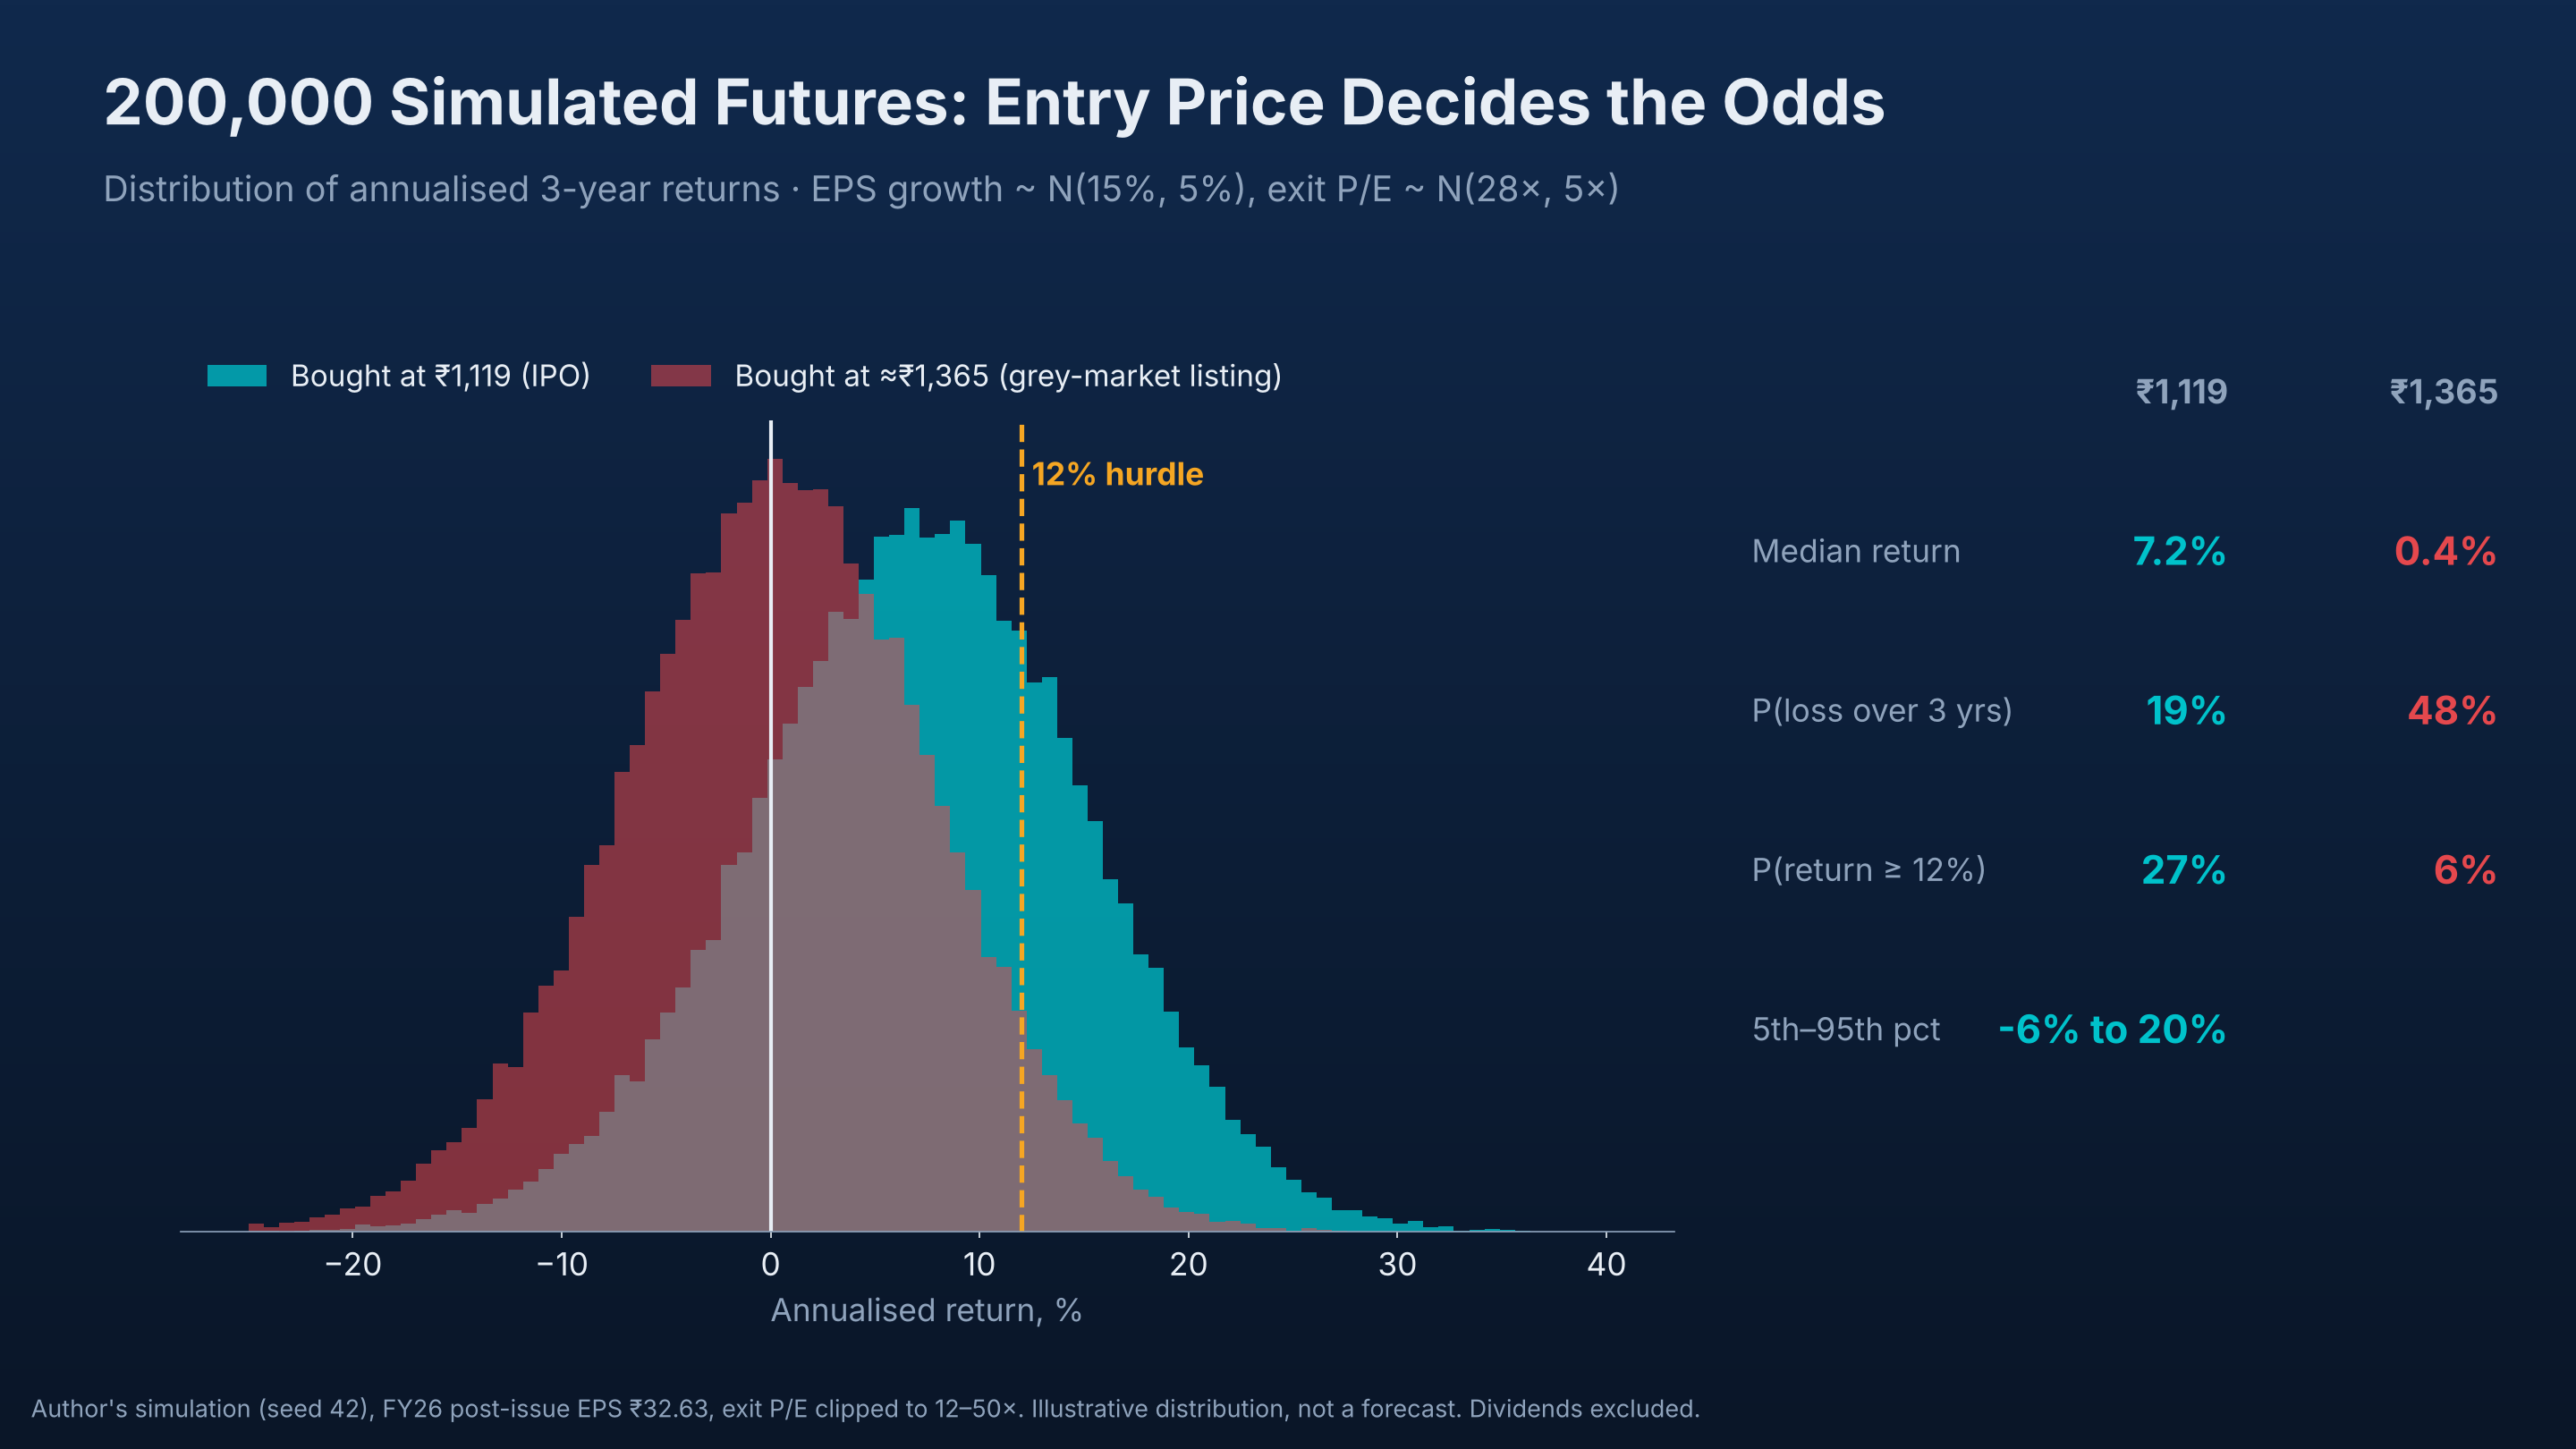
Method. I draw FY26–29 EPS growth from N(15%, 5%), centred on consensus EBITDA growth, and the FY29 exit P/E from N(28×, 5×), clipped at 12–50×. I then compute the annualised three-year return from two entry prices: the IPO price and the grey-market-implied listing price.
| Outcome | Bought at ₹1,119 (IPO) | Bought at ≈ ₹1,365 (grey market) |
|---|---|---|
| Median annual return | 7.2% | 0.4% |
| Probability of a loss | 19% | 48% |
| Probability of ≥ 12% a year | 27% | 6% |
| 5th–95th percentile | −6% to +20% | — |
Result. Same company, same future, different odds. A 22% higher entry price cuts the median annual return by roughly 7 percentage points and turns a one-in-five chance of loss into a coin toss.
Analysis 5: The tariff lever#
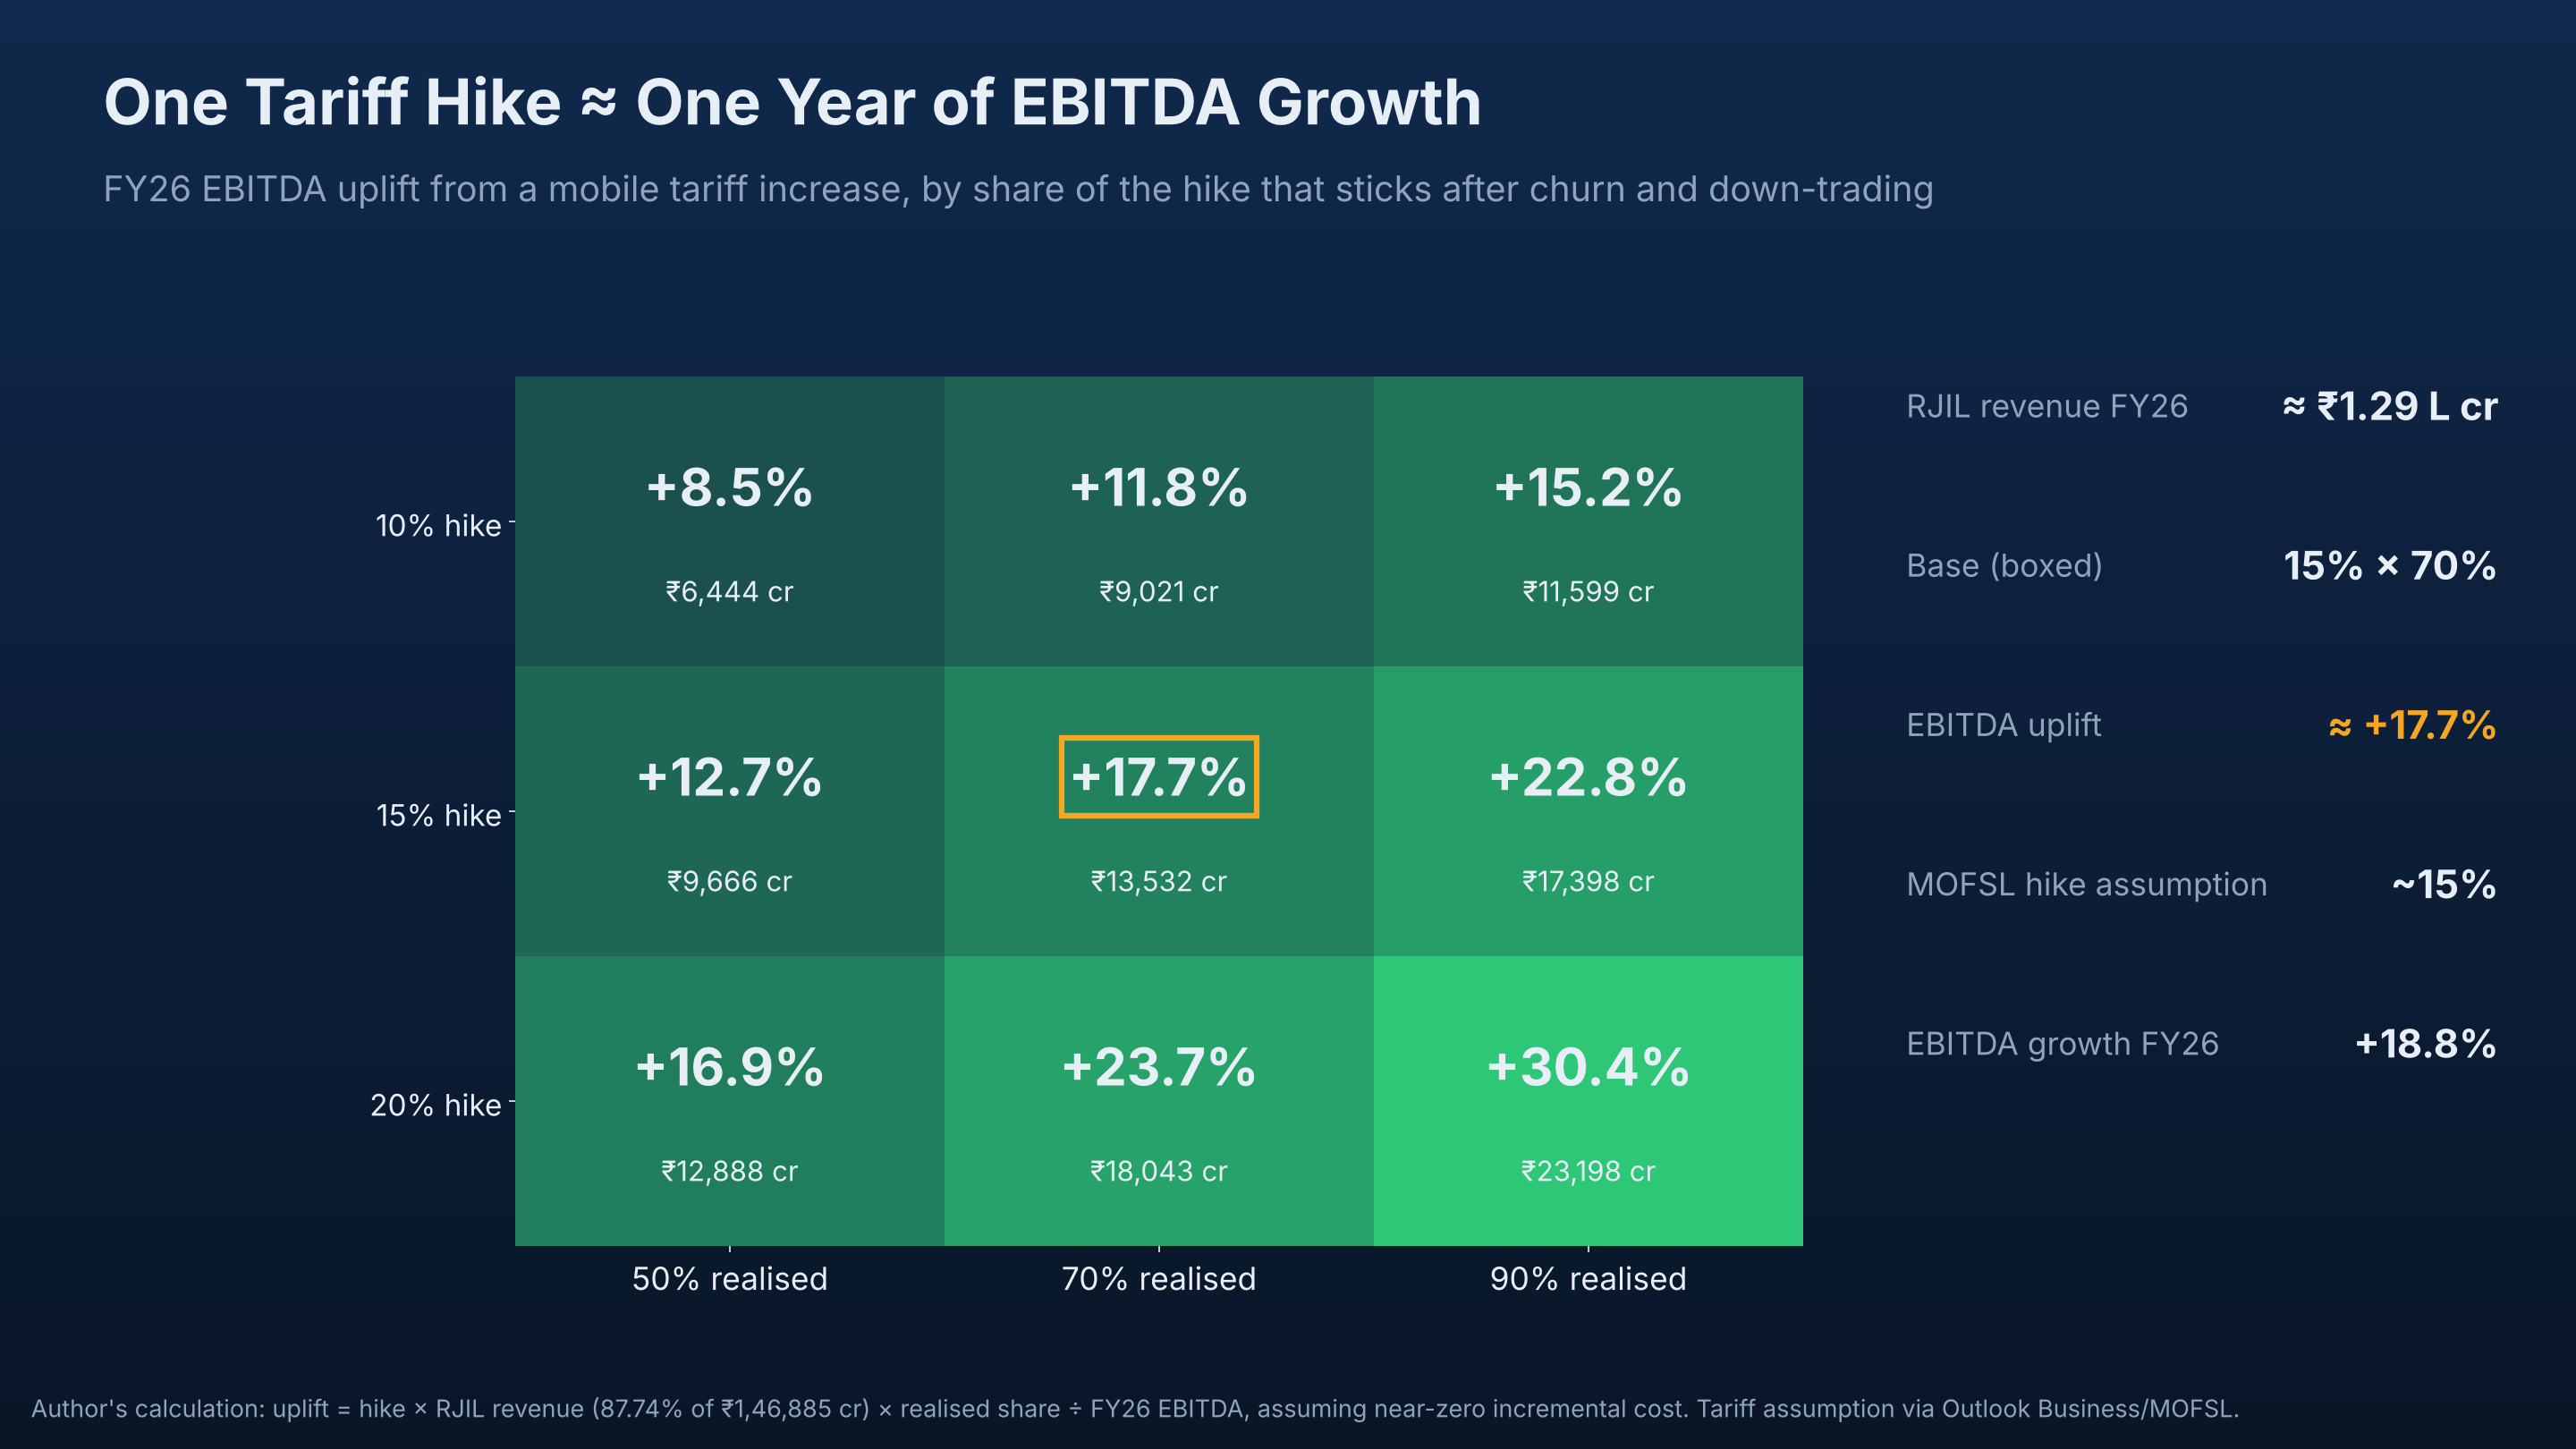
Method. EBITDA uplift = tariff hike × RJIL revenue (≈ ₹1.29 lakh crore) × share of the hike realised after churn and down-trading ÷ FY26 EBITDA, assuming near-zero incremental cost.
| EBITDA uplift | 50% realised | 70% realised | 90% realised |
|---|---|---|---|
| 10% hike | +8.5% | +11.8% | +15.2% |
| 15% hike | +12.7% | +17.7% | +22.8% |
| 20% hike | +16.9% | +23.7% | +30.4% |
Result. A 15% hike with 70% realisation adds about ₹13,500 crore, or +17.7%, to EBITDA, roughly one year of growth. Motilal Oswal assumes such a hike in December 2026. Tariffs are the single fastest lever for closing the ROE gap in Analysis 2. They are also a regulatory and competitive variable that Jio does not fully control.
7. Five ways the market can get Jio wrong#↑ Contents
1. Confusing demand with value#
A 22× subscription says the shares are scarce. It says nothing about whether ₹1,119 is cheap. With a 2.9% float, demand from index funds and allocation-hungry institutions can outrun fundamentals for months.
2. Valuing EBITDA instead of cash#
Jio's 52% EBITDA margin is world-class. Its 2.6% FCFF yield on enterprise value is not. The difference is capex, tax and spectrum. Valuation should start from the cash, as in Analysis 1.
3. Ignoring the spectrum liability#
Leaving out ₹1.04 lakh crore of deferred spectrum dues cuts EV/EBITDA from about 15× to about 13×. That flatters Jio by roughly 1.5 turns of EBITDA against peers whose leverage figures include similar items.
4. Assuming the multiple holds#
Analyses 3 and 4 show that the exit multiple drives returns as much as earnings growth. Global telecom operators trade well below 30× earnings. Jio's premium is partly a platform and scarcity premium, and premiums are the first thing to compress.
5. Treating the listing price as the entry price#
Allottees bought at ₹1,119. Anyone buying near the grey-market level of ≈₹1,365 pays about 42× trailing earnings. The Monte Carlo puts their median return close to zero.
8. The quant dashboard: what to watch#↑ Contents
| Signal | Current level | What would change the view |
|---|---|---|
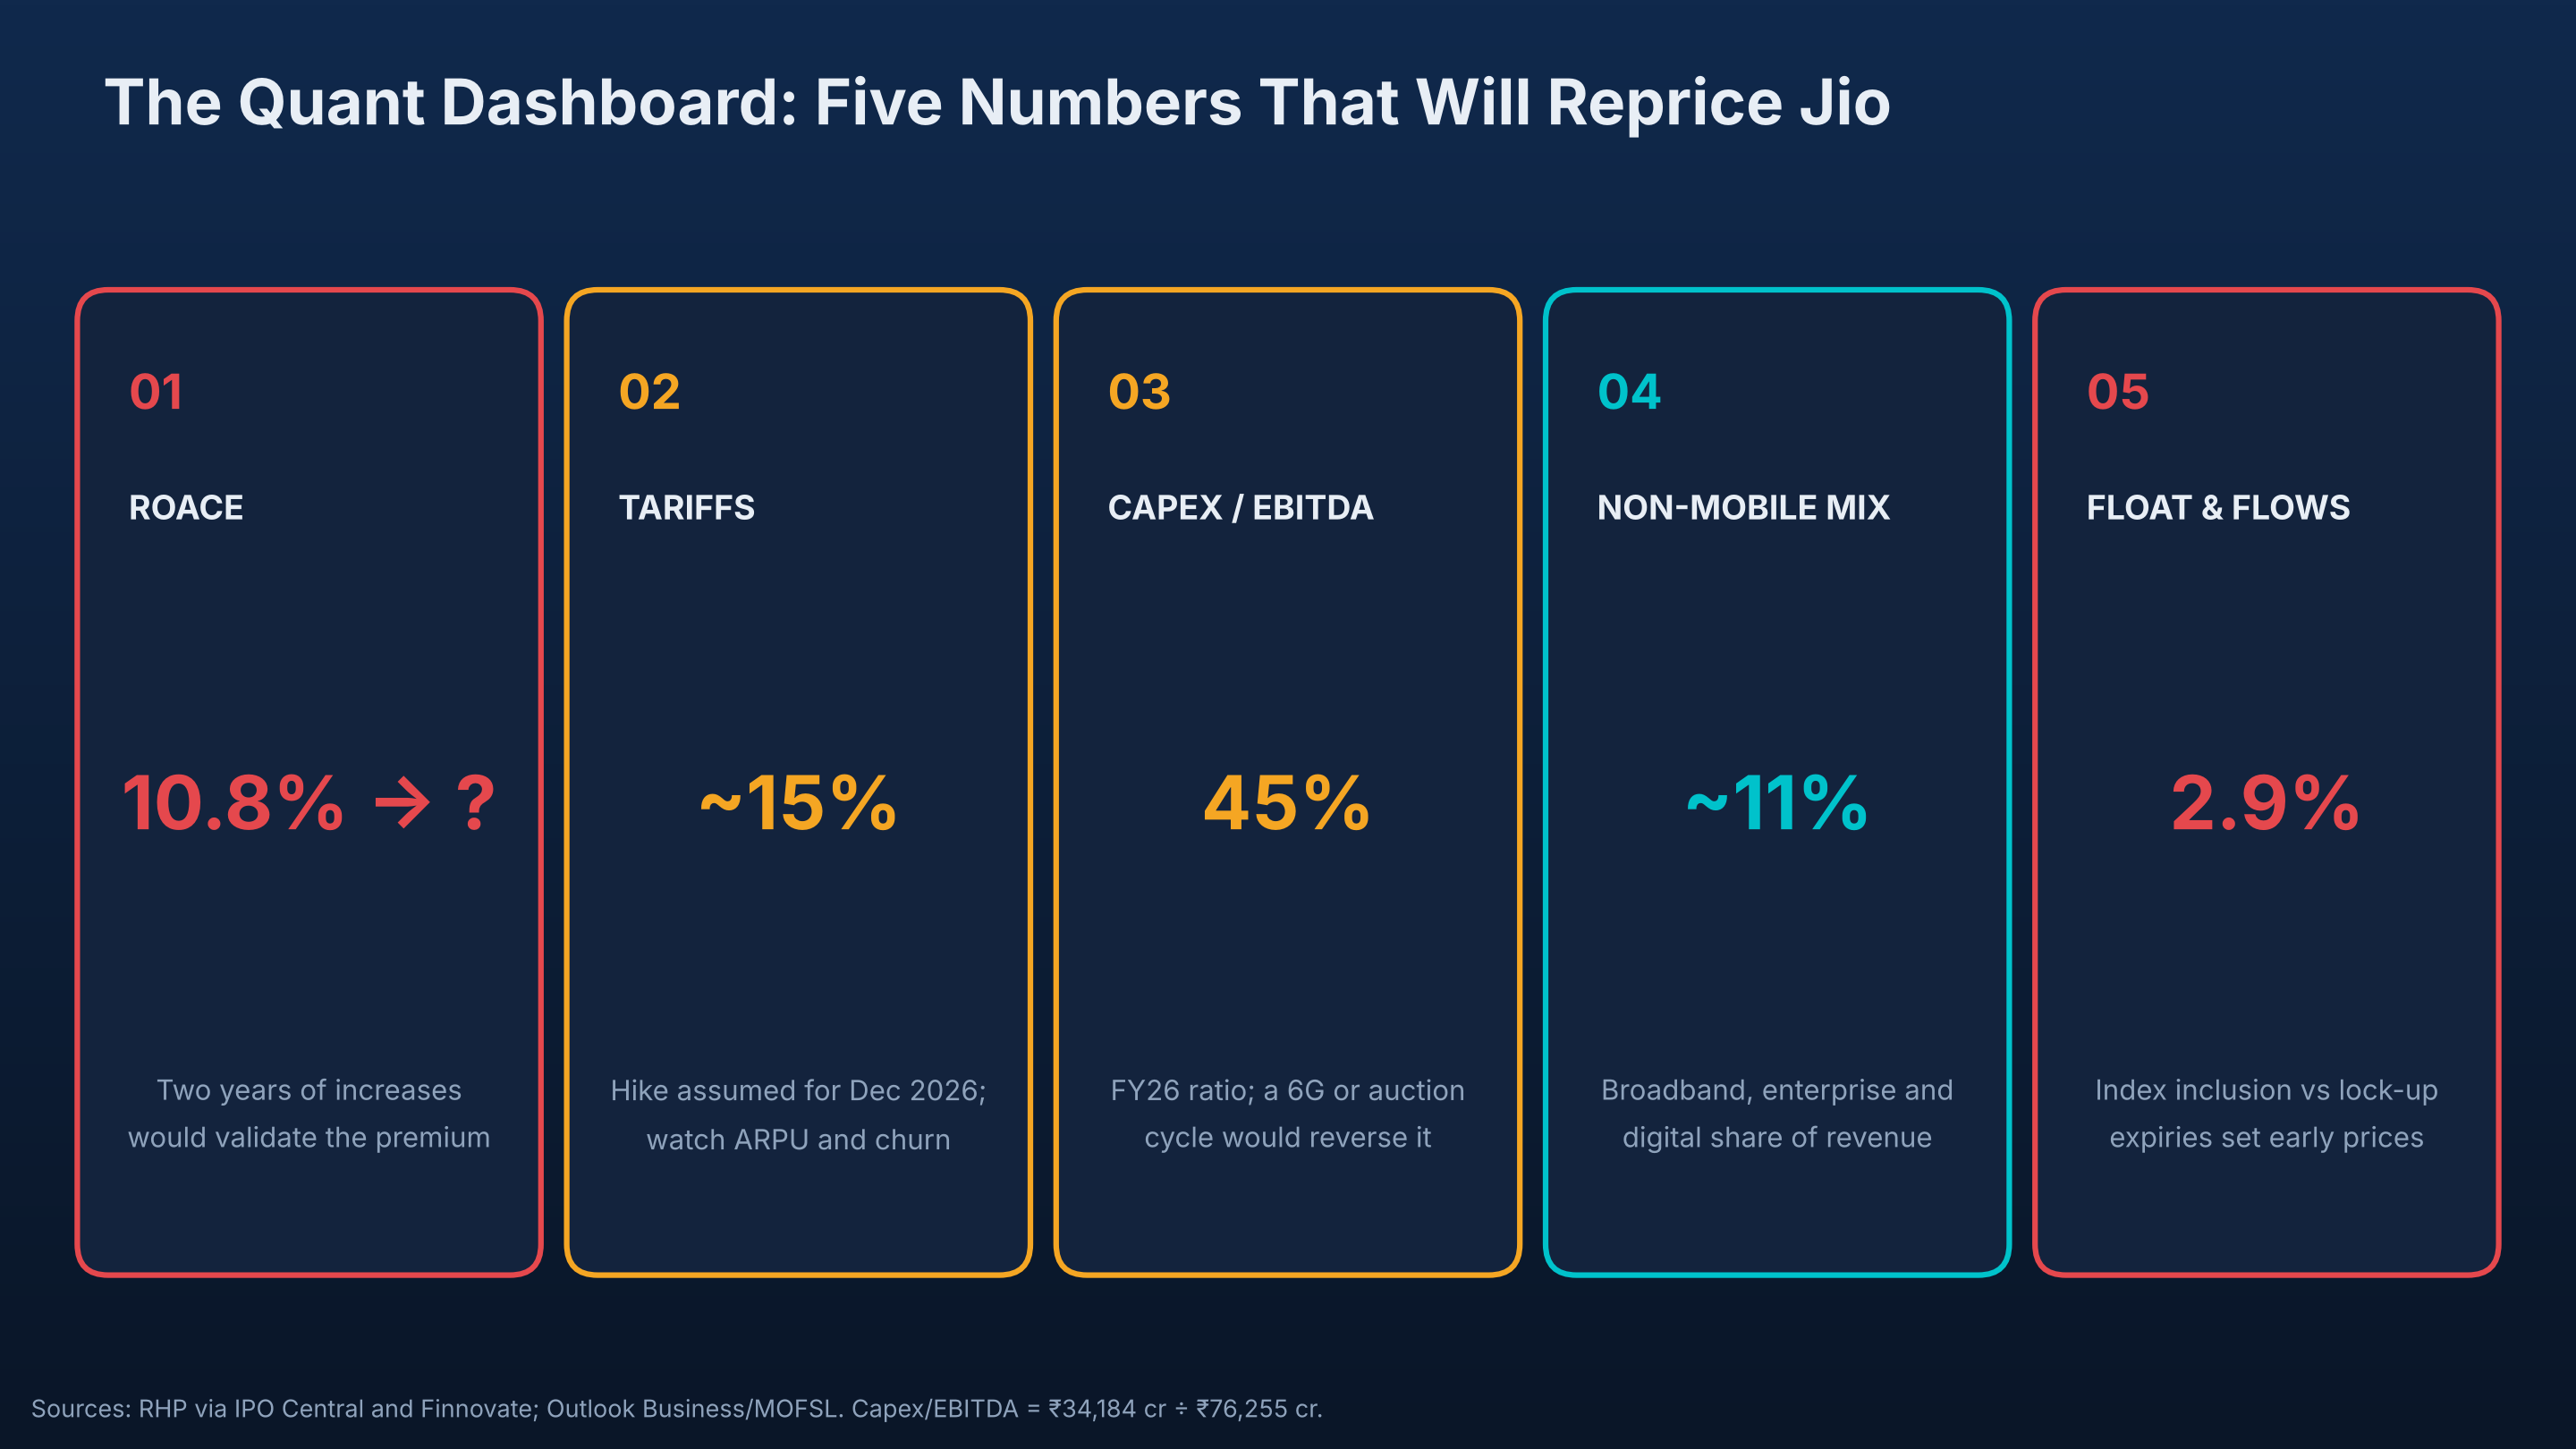
| ROACE | 10.8% | Two consecutive years of increases would validate the premium |
| Tariffs and ARPU | ~15% hike assumed for Dec 2026 | Realisation above 70% with stable churn |
| Capex / EBITDA | 45% | A spectrum auction or 6G cycle pushing it back up |
| Non-mobile revenue mix | ~11% | Broadband, enterprise and digital rising without margin dilution |
| Float and flows | 2.9% | Index inclusion versus lock-up expiries in the first year |
| Risk | Why it matters |
|---|---|
| Multiple compression | 34× leaves little room for disappointment |
| Regulation | Licence fees, spectrum pricing, satellite-broadband entry |
| Concentration | RJIL is about 95% of EBITDA |
| Governance | Promoter-controlled group; related-party dealings with RIL |
| Holdco discount | Markets often discount listed stakes held by a parent, which may weigh on RIL |
9. Why this matters beyond Mumbai#↑ Contents
Jio's IPO shows that a developing-country capital market can now absorb a $3.6 billion primary issue largely from domestic savings. For smaller markets from Kathmandu to Dhaka, three lessons stand out:
| Lesson | Implication for frontier markets |
|---|---|
| Domestic depth is the real story | Retail bid ₹6,900 crore on day one. Mutual-fund penetration, digital demat accounts and investor protection built that depth; markets like Nepal's NEPSE still need it. |
| Thin floats are a policy trade-off | India eased float rules to list a giant. The cost is weaker price discovery. Regulators such as Nepal's SEBON face the same tension with large state-owned telecom and hydropower firms. |
| Connectivity is development infrastructure | Jio's cheap data after 2016 brought hundreds of millions online and seeded digital payments. The productivity dividend matters more than any one valuation. |
For readers outside India: Jio's offering documents state there is no public offering of the shares in the United States, and residents of many countries, including Nepal, face restrictions on portfolio investment abroad. Check the rules that apply to you.
The bottom line#↑ Contents
The Jio IPO is a vote of confidence in India's digital economy, and the business deserves it: dominant scale, 52% EBITDA margins, falling capex and minimal conventional debt.
But the price is a forecast. At ₹1,119, the market is assuming ≈15% cash-flow growth for a decade and a return on equity near 24%, against 9.4% today. That can happen through tariff increases, capex discipline and a growing non-mobile business. It has not happened yet.
Oversubscription measures demand, not value. The test for Jio is not how many investors wanted the shares, but whether its return on capital rises to meet the price they paid.
Your take#
Is Jio a telecom utility that deserves a telecom multiple, or a digital platform that deserves a premium? Share your view in the comments.
Methodology and research
All valuation models in Section 6 are the author's own calculations from Jio Platforms' RHP figures as reported in secondary summaries. Reverse DCF: two-stage FCFF model, 10-year explicit period, Gordon terminal value. Implied ROE: justified P/B model. Monte Carlo: 200,000 draws, seed 42.
Also by the author: > When Backtests Lie (SSRN) · Conditional Tail Episode Risk (SSRN) · Systemic Tail Episode Risk (SSRN)
About the author#
Niraj Neupane, CA (ICAI), is a quantitative researcher whose work focuses on validating machine-learning risk models and measuring path-dependent and systemic tail risk for financial institutions and regulators. He is the founder of Korvane, an AI-powered trade, risk and validation platform, and Calderyn Institute, which trains professionals in quantitative finance and AI engineering. ORCID: 0009-0003-7026-7026.
Views expressed are the author's own and do not represent any employer. This article is for information and education only and is not investment advice or a recommendation to buy or sell any security. The author holds no position in Jio Platforms or Reliance Industries at the time of writing.
Sources#
IPO terms and subscription
- Chittorgarh, Jio Platforms IPO details and valuation: https://www.chittorgarh.com/ipo/jio-platforms-ipo/
- ICICI Direct, Jio Platforms IPO terms and objects of the issue: https://www.icicidirect.com/ipo/reliance-jio-ipo
- IPOji, Jio Platforms IPO subscription and GMP: https://www.ipoji.com/ipo/jio-platforms-ipo
- PSU Connect, Jio Platforms IPO fully subscribed in 100 minutes: https://www.psuconnect.in/ipo/jio-platforms-ipo-fully-subscribed-in-100-minutes-indias-largest-30213-cr-issue
- TelecomTalk, Jio Platforms IPO breaks records on day one: https://telecomtalk.info/jioplatformsipo-breaksrecords-on-day1-qibdemand-surges-9-42times/1013110/
- Kotak Neo, India's biggest private IPO in works: https://www.kotakneo.com/news/market-news/indias-biggest-private-ipo-in-works-as-jio-prepares-drhp-filing/
Financials (RHP summaries)
- 5paisa, Jio Platforms FY26 financials: https://www.5paisa.com/index.php/blog/jio-platforms-fy26-financials-revenue-profit
- DSIJ, RHP balance sheet and cash flow: https://insights.dsij.in/dsijarticledetail/jio-platforms-ipo-rs-30213-crore-mega-issue-from-indias-telecom-leader-should-you-subscribe
- Finnovate, segment contribution, Q1 FY27 and net debt: https://www.finnovate.in/learn/blog/jio-platforms-review-details-investment-guide
- IPO Central, capex, leverage and ROACE: https://ipocentral.in/?p=265153
- IPO Central, Jio Platforms IPO review: https://ipocentral.in/jio-platforms-ipo-review/
- Kotak Neo, top 10 things from the DRHP: https://www.kotakneo.com/news/ipos/jio-ipo-journey-moves-ahead-top-10-things-investors-should-know-from-drhp/
Valuation and peers
- INDmoney, Jio Platforms IPO review (P/E, ROCE, spectrum dues): https://www.indmoney.com/blog/ipo/jio-platforms-ipo-review
- Business Today, Jio likely to seek premium over Airtel valuations: https://www.businesstoday.in/markets/ipo-corner/story/jio-platorms-ipo-likely-to-seek-premium-over-bharti-airtel-valuations-fresh-gmp-what-analysts-say-560019-2026-10-07
- Business Today, 14.8× EV/EBITDA at the upper band: https://www.businesstoday.in/markets/ipo-corner/story/jio-platforms-ipo-issue-subscribed-57-in-pre-ipo-window-nse-data-shows-check-latest-gmp-562677-2026-10-21
- Outlook Business, Jio's IPO can put Airtel's valuation in focus (MOFSL): https://www.outlookbusiness.com/amp/story/corporate/jios-ipo-can-put-airtels-valuation-in-focus
- Multibagg, Emkay valuation checks: https://www.multibagg.ai/market-pulse/articles/jio-platforms-ipo-valuation-checks-cmvilk7g000002wphbs3h51lb
- Business Today, Nuvama on RIL shareholders: https://www.businesstoday.in/amp/markets/stocks/story/jio-platforms-ipo-why-nuvama-says-reliance-shareholders-may-not-gain-much-after-listing-538408-2026-06-22