MARKETS · AI · TAIL RISK · U.S. FINANCIAL STABILITY
By Niraj Neupane, CA (ICAI) Quantitative Researcher, Korvane · Financial Economist, Calderyn Institute · Founder, Wall Street Feed
Key takeaways
The week. The Nasdaq fell 2.0%, the S&P 500 0.6% and the Dow 0.9%. Most of the damage came on Friday, the S&P 500's worst day since June. Small caps rose 1.3%, a sign the selloff was concentrated in Big Tech.
The Fed. Rates held at 3.75–4.00%, but two officials voted to hike. Growth is "strong" (Q3 GDP 3.4%) and inflation is sticky (September PCE 3.6%, core 3.1%).
The AI reality check. Alphabet, Amazon and Meta are spending faster than they generate cash: free cash flow of −$9.1B, −$42.4B (trailing 12 months) and −$2.1B. Microsoft is the exception, with Azure +48% and +$18.6B of free cash flow. Combined 2026 capex across the four: roughly $725–745 billion.
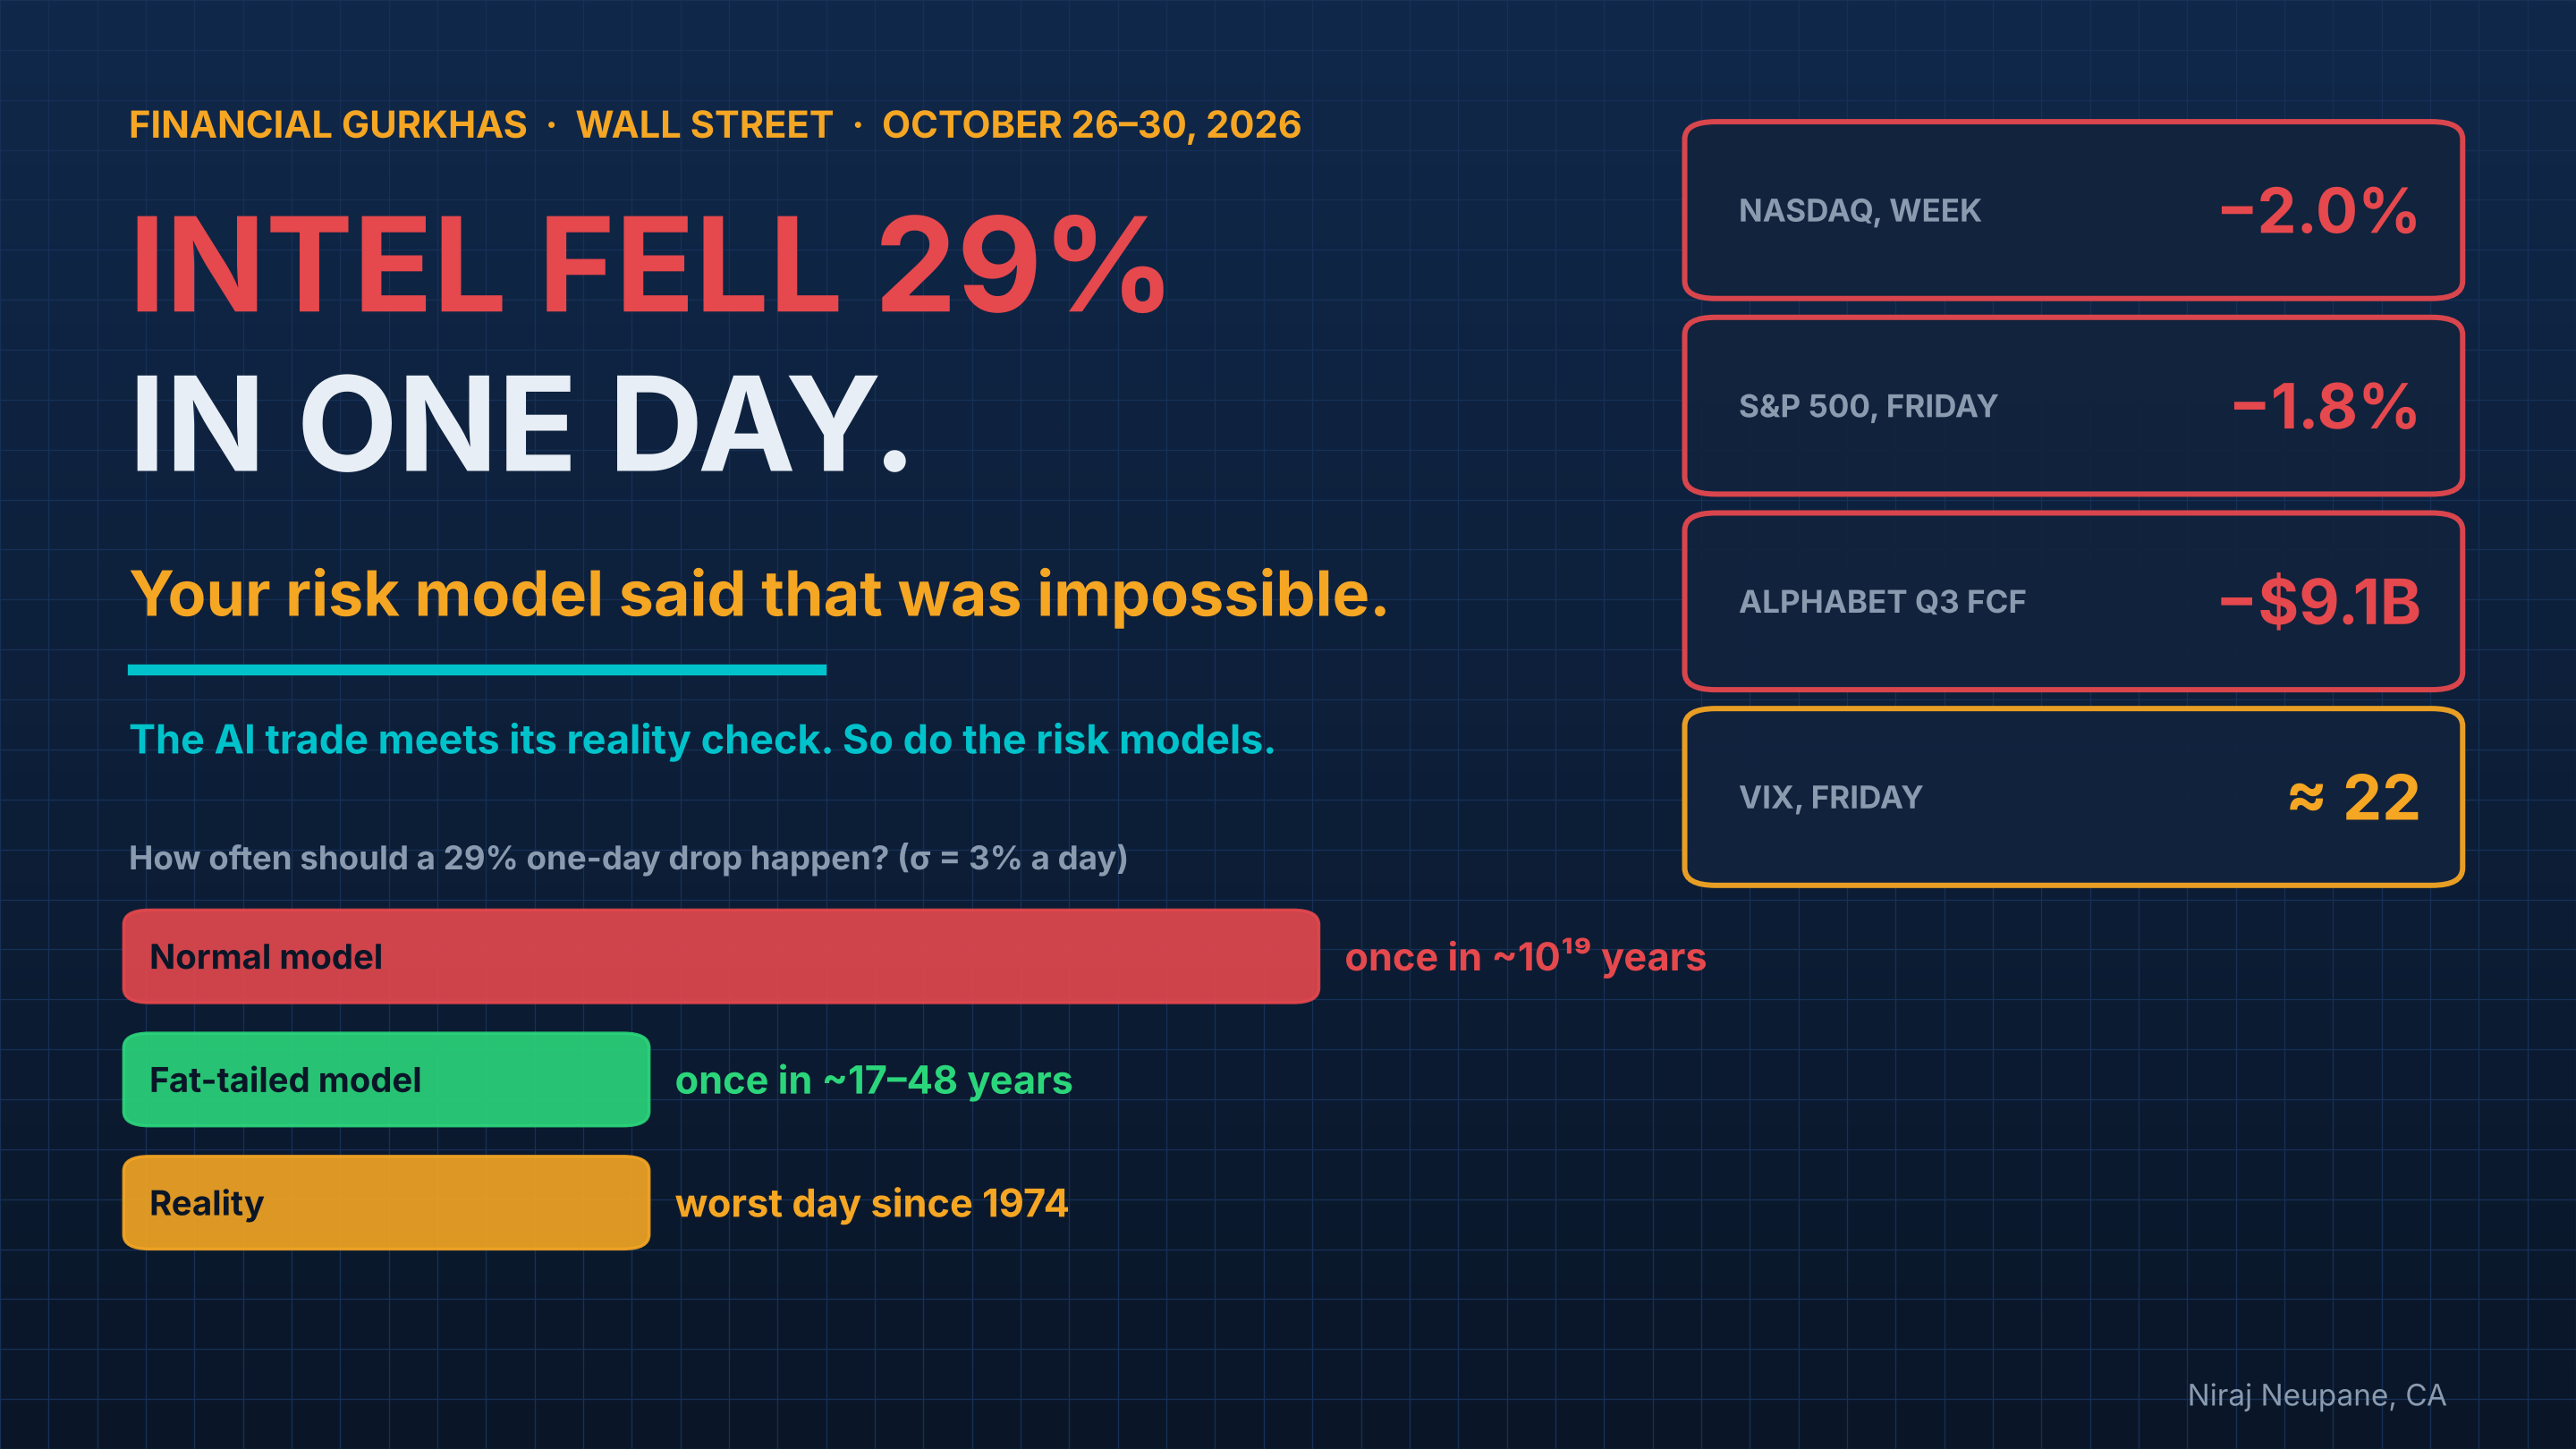
The tail event. Intel beat earnings and still fell about 29%, its worst day since 1974, on a weak outlook.
The research angle. Under a normal-distribution risk model, a 29% one-day drop happens about once every 10¹⁹ years. Under a fat-tailed model, once every 17–48 years. Reality: last seen in 1974. My research is about closing that gap.
What's in this report#
- The week in 10 numbers
- 1. The week: one day did most of the damage
- 2. The Fed holds, but two officials wanted to hike
- 3. The AI reality check: spending is easy, cash flow is the test
- 4. Intel: beat the quarter, lost 29% on the outlook
- 5. Friday's flight from risk
- 6. The research: how "impossible" was Friday?
- 7. Five papers, one week
- 8. What risk managers can do now
- 9. What to watch next week
- The bottom line
The week in 10 numbers#↑ Contents
| # | Story | The number | Why it matters |
|---|---|---|---|
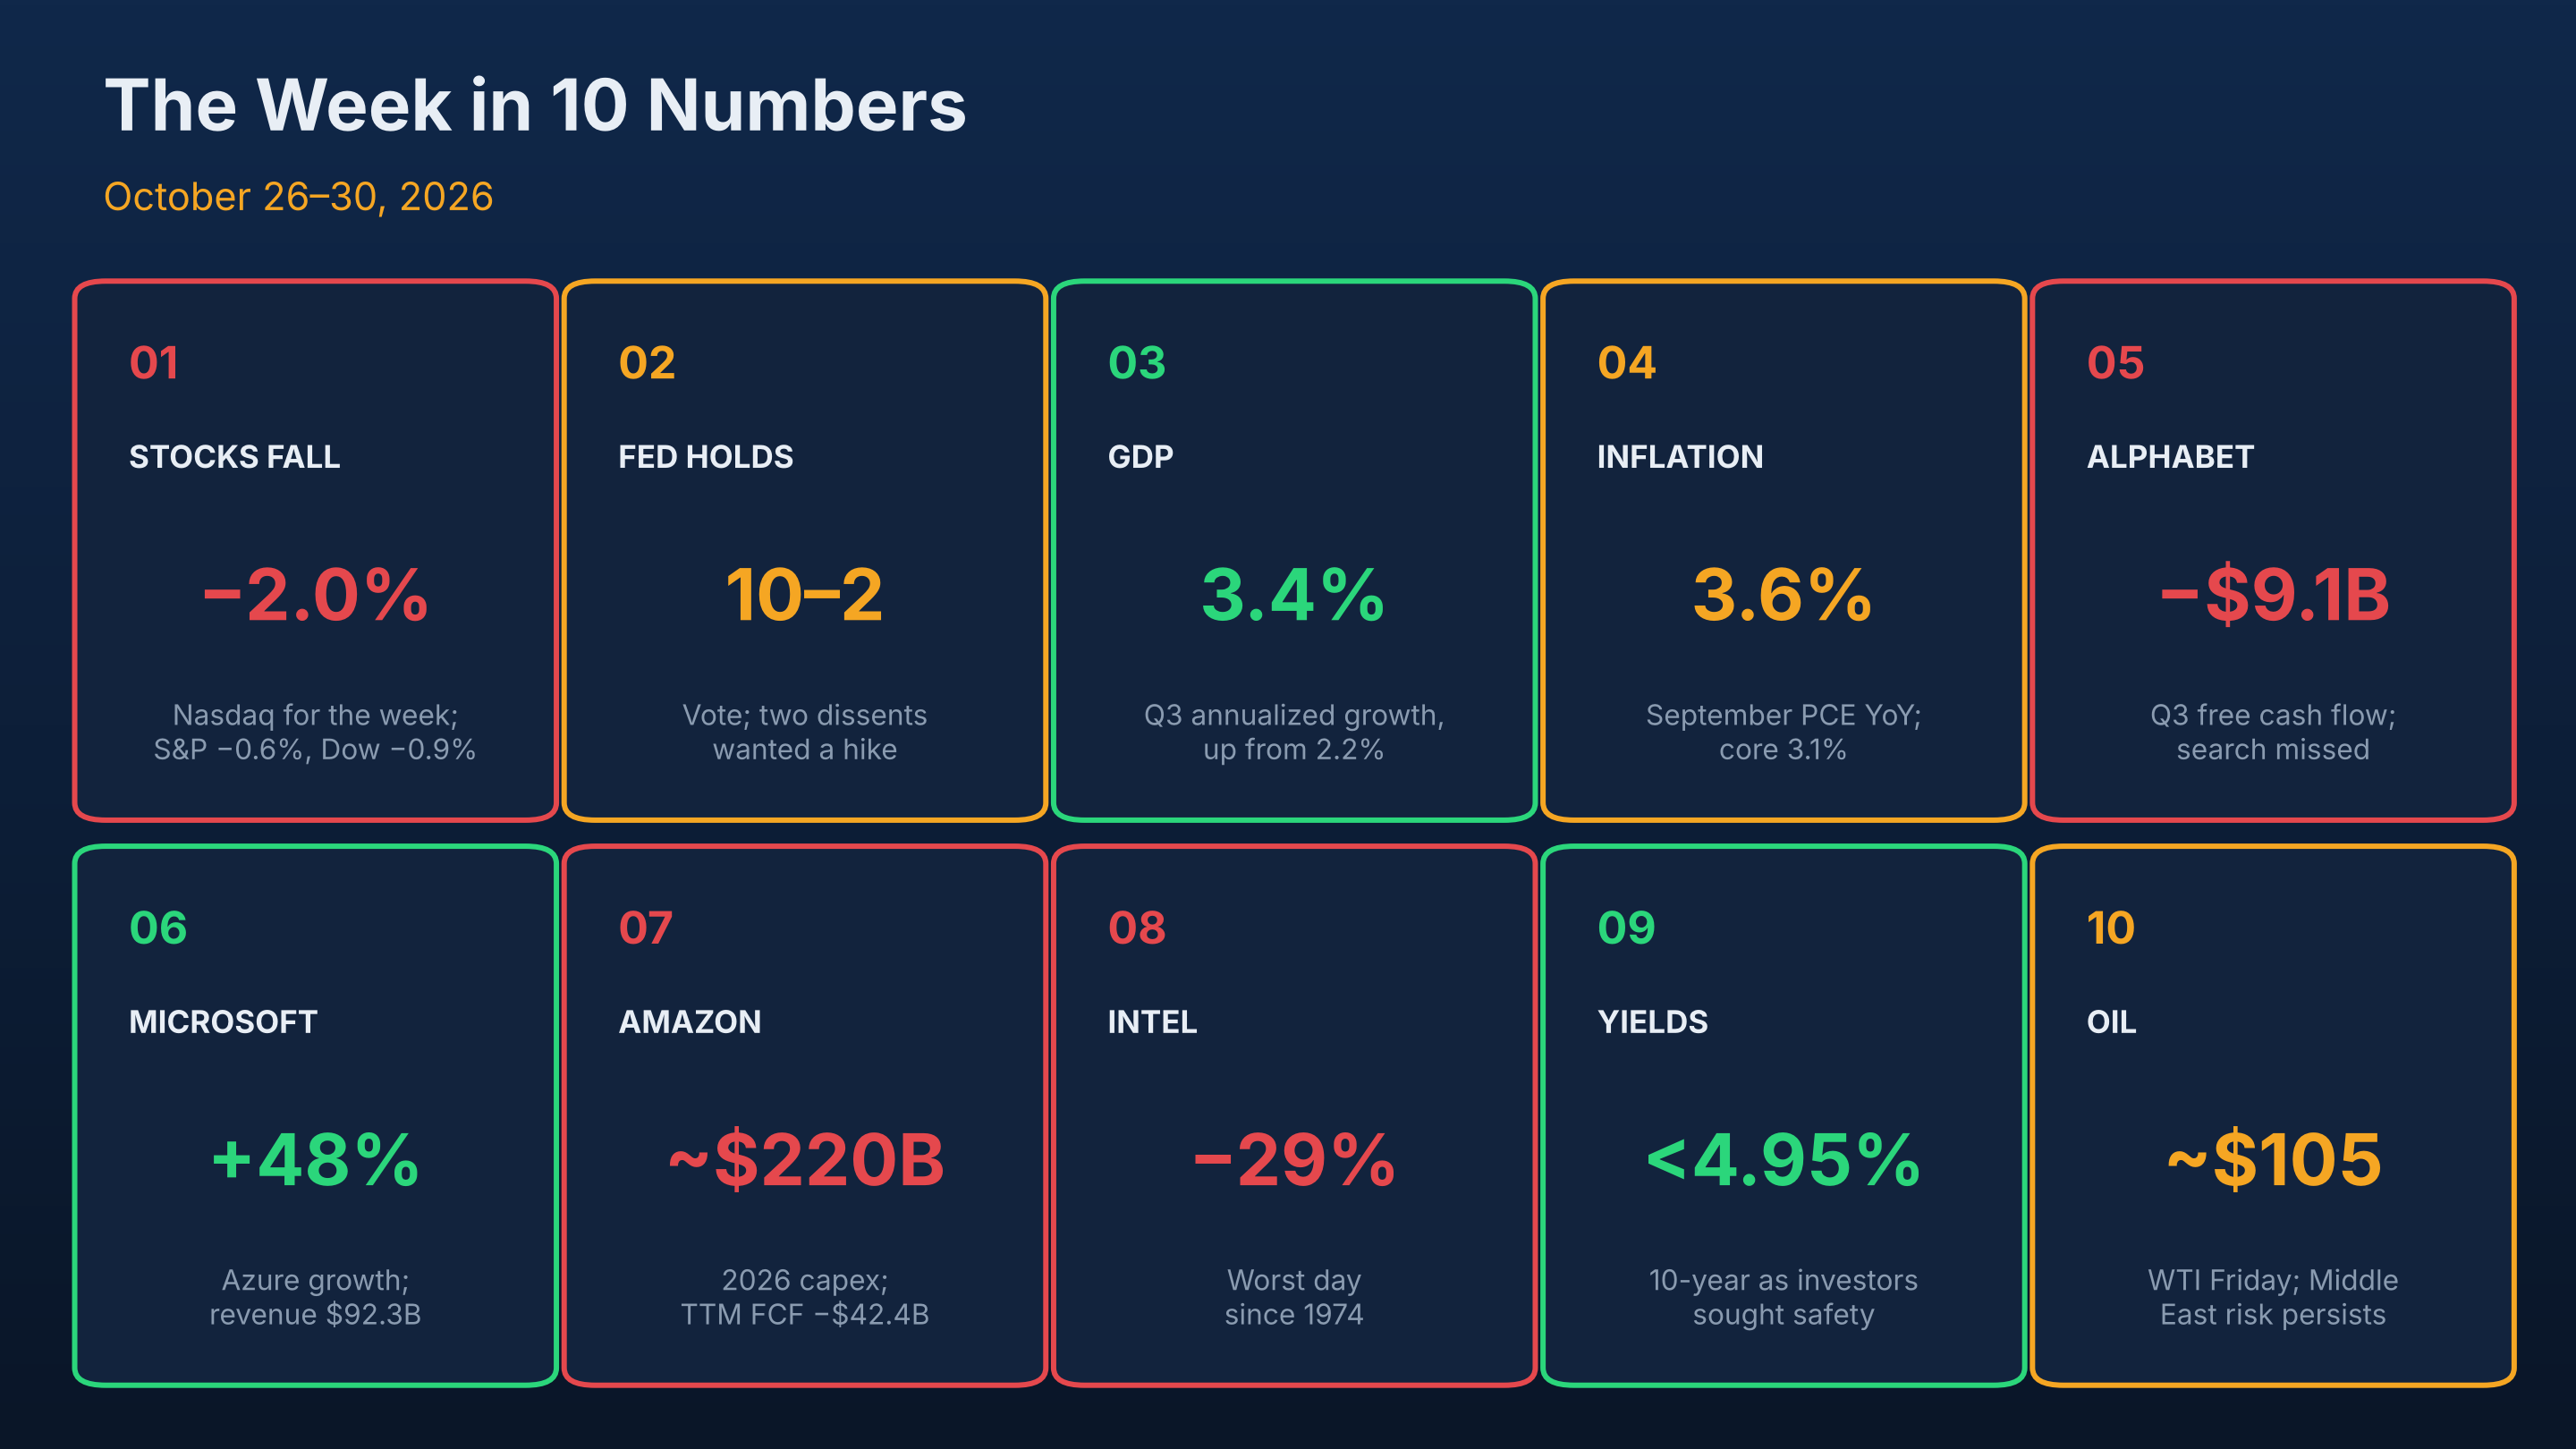
| 1 | Stocks fall | Nasdaq −2.0% for the week | S&P 500 −0.6%, Dow −0.9%; Russell 2000 +1.3% |
| 2 | Fed holds | 10–2 vote at 3.75–4.00% | Two officials wanted a hike; December is live |
| 3 | GDP surprise | 3.4% Q3 growth | Up from 2.2%, led by investment in IT equipment |
| 4 | Inflation | September PCE 3.6%; core 3.1% | Keeps the Fed leaning hawkish |
| 5 | Alphabet | Free cash flow −$9.1B | First revenue and EPS miss in nearly four years |
| 6 | Microsoft | Azure +48% | AI spending that is converting into cash |
| 7 | Amazon | 2026 capex ~$220B | Trailing free cash flow −$42.4B |
| 8 | Intel | −29% in one session | Worst day since 1974, despite beating estimates |
| 9 | Yields | 10-year below 4.95% | Treasuries were the safe haven |
| 10 | Oil | WTI ~$105, Brent near $118 | Middle East risk keeps inflation pressure alive |
1. The week: one day did most of the damage#↑ Contents
| Index | Friday close (Oct 30) | Friday | Week | Year to date |
|---|---|---|---|---|
| Nasdaq Composite | 25,437.00 | −2.9% | −2.0% | +9.4% |
| S&P 500 | 7,580.07 | −1.8% | −0.6% | +10.7% |
| Dow Jones | 51,770.31 | −1.1% | −0.9% | +7.7% |
| Russell 2000 | 2,811.84 | −1.7% | +1.3% | +13.3% |
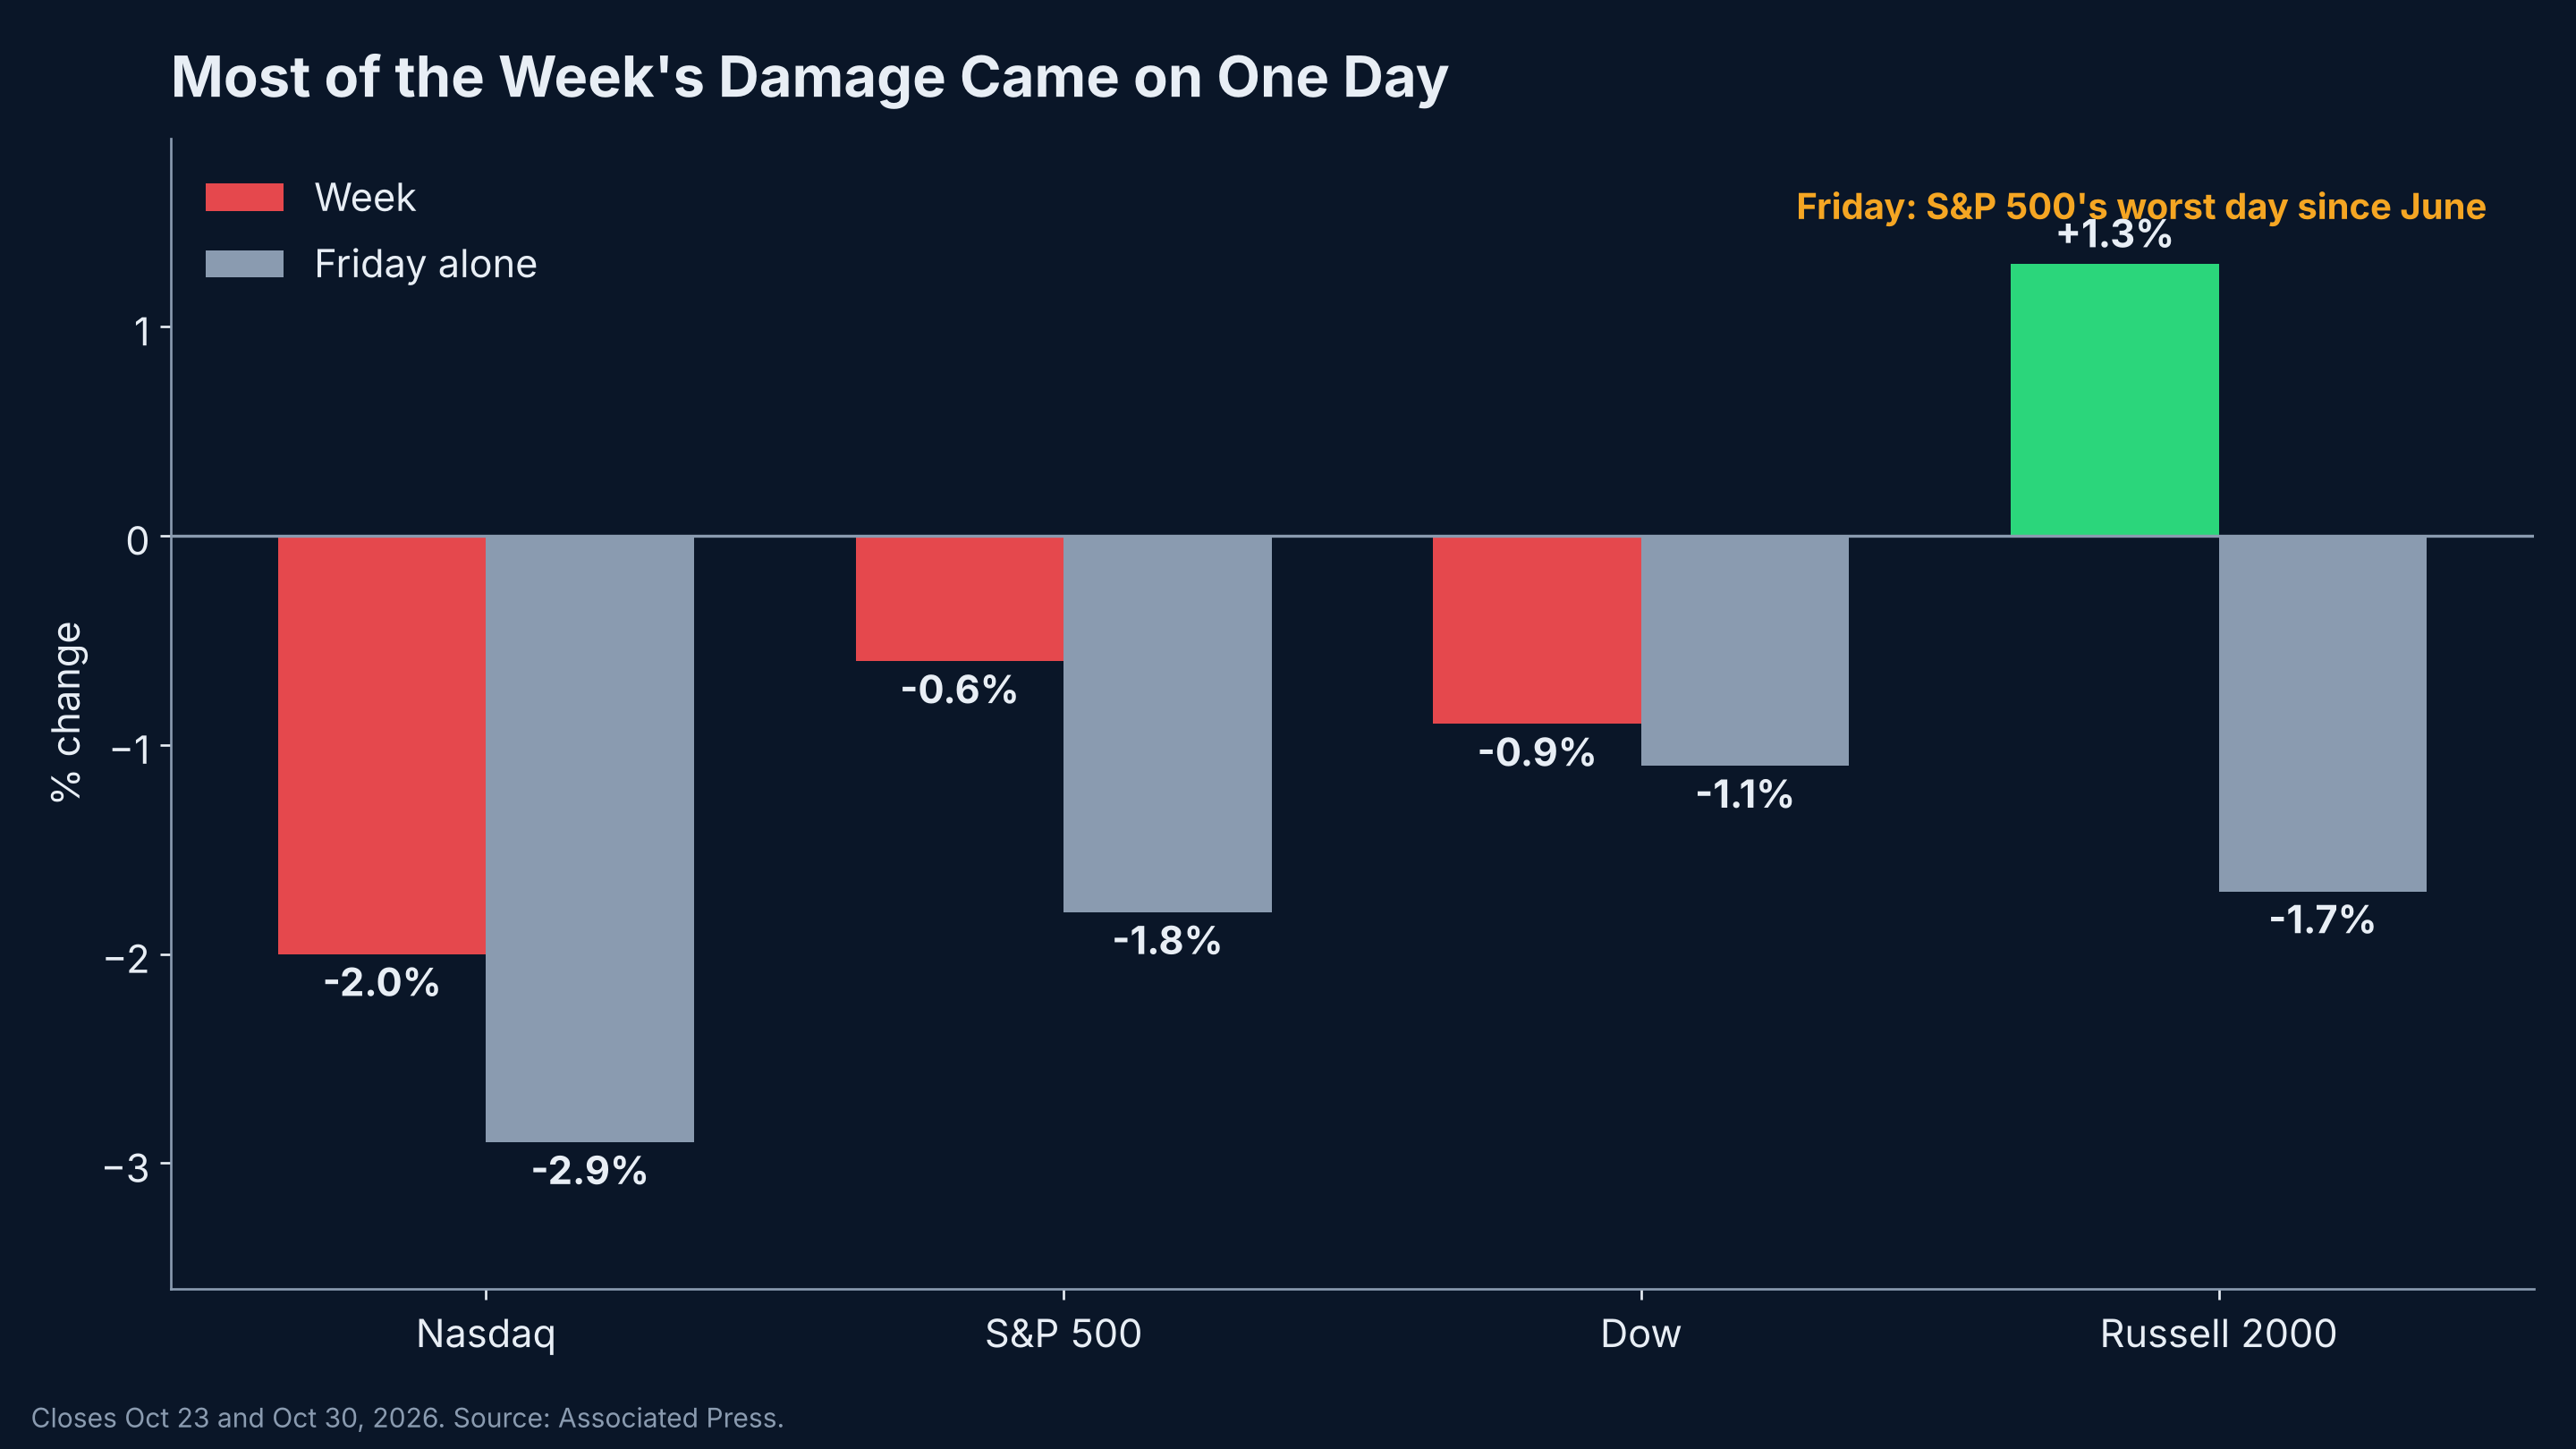
The week began calmly. Stocks rose on Monday as investors waited for the Fed and earnings from roughly a third of the S&P 500. By Friday, in the Associated Press's words, "worries grew that enthusiasm around artificial intelligence had pushed prices too high." The S&P 500 had its worst single day since June and the Nasdaq fell 2.9%.
Two details matter for how we read the week:
- The selloff was narrow. Small caps finished the week up 1.3%. This was a repricing of AI and Big Tech, not a broad flight from the economy.
- The losses came in one session, not a run. Most of the weekly decline happened on Friday. As I discuss in Section 7, a single violent day and a sustained run of losses are different risks, and they call for different measures.
2. The Fed holds, but two officials wanted to hike#↑ Contents
The Federal Reserve held its target range at 3.75%–4.00% on October 28. The vote was 10–2: Governor Lisa Cook and Cleveland Fed President Beth Hammack dissented in favor of a quarter-point hike. Markets had widely expected a hold, so the dissents were the surprise.
The statement was hawkish. It upgraded the economy from "solid" to "strong", said "inflation remains elevated," and pledged that "the Committee will deliver price stability." Chair Warsh called inflation "too high." There was no forward guidance and no dot plot.
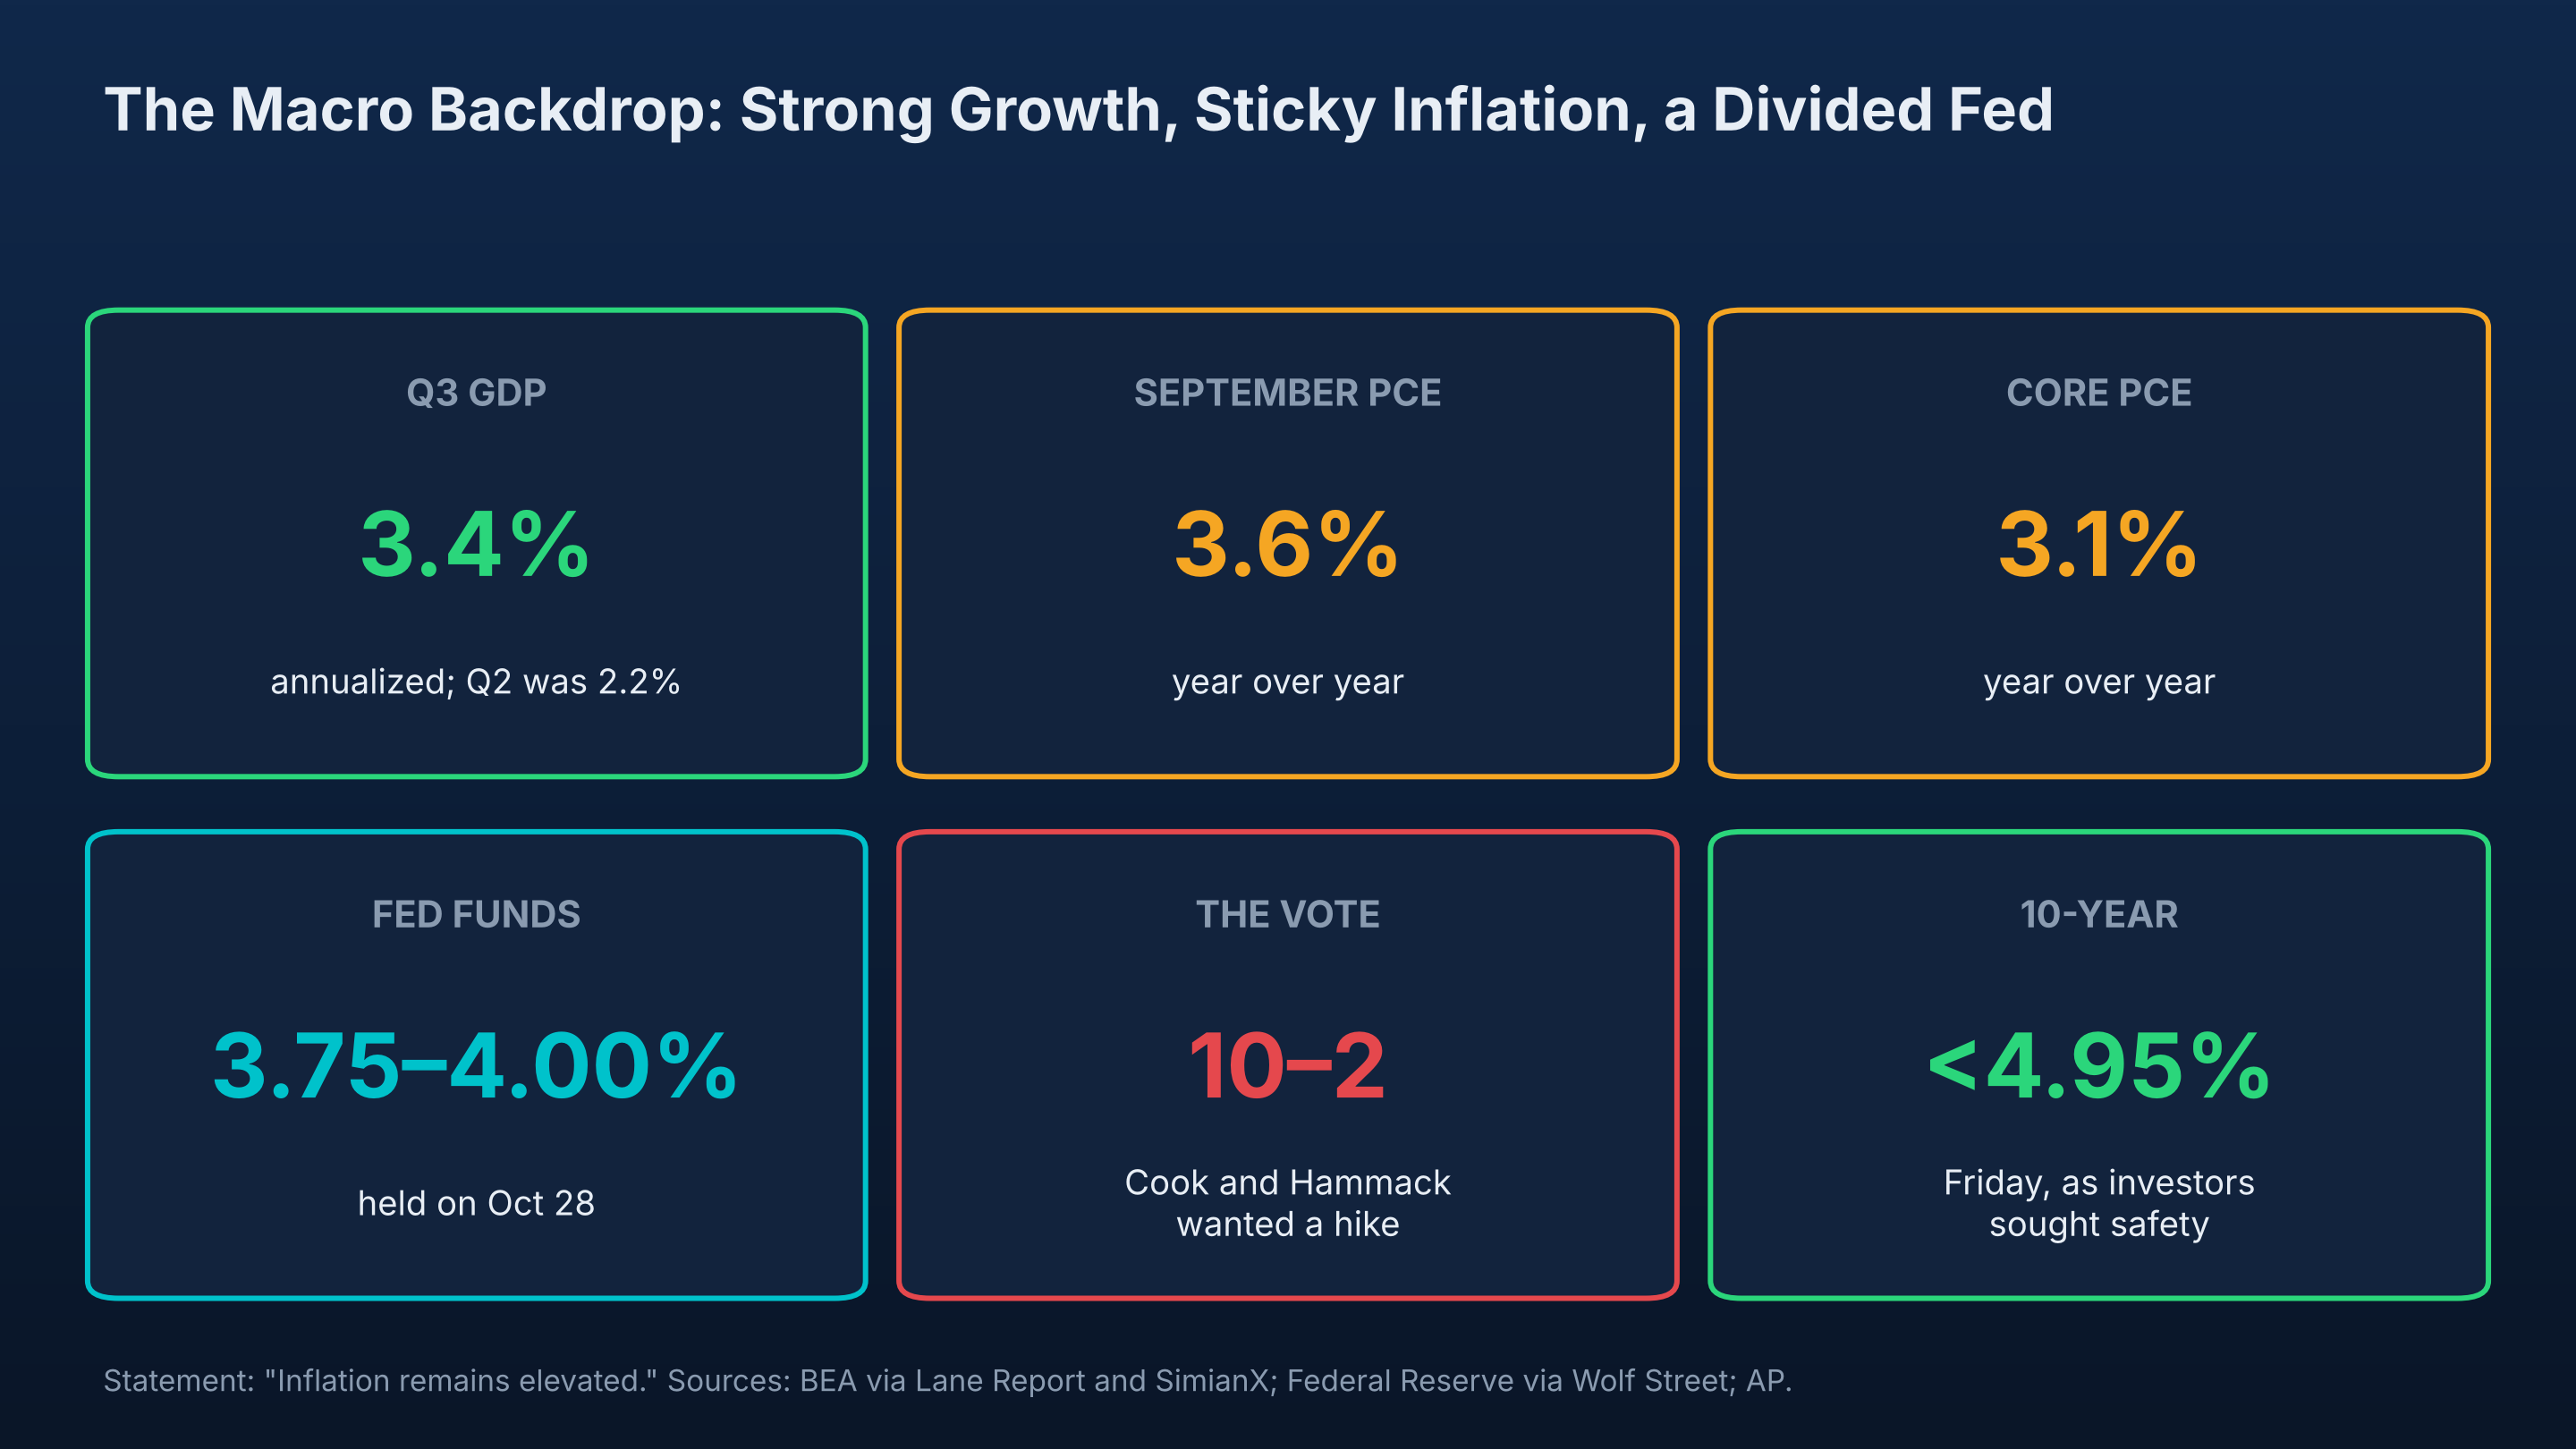
| Indicator | Reading | What it tells us |
|---|---|---|
| Q3 GDP (advance) | 3.4% annualized (Q2: 2.2%) | Growth is accelerating, driven by business investment, especially computers and information-processing equipment |
| September PCE | 3.6% year over year (+0.5% on the month) | Energy is keeping headline inflation high |
| Core PCE | 3.1% year over year (+0.3% on the month) | Well above the 2% target, and not falling quickly |
| Fed vote | 10–2, two for a hike | A December hike remains a real possibility |
| 10-year Treasury | Rose to about 5.04% after the decision, then fell below 4.95% by Friday | Investors chose safety over inflation fears at week's end |
The tension in one line: the AI investment boom is helping drive 3.4% growth, and that same strength is keeping rates high, which raises the cost of financing the AI boom.
3. The AI reality check: spending is easy, cash flow is the test#↑ Contents
 Illustration.
This was the busiest earnings week of the season for Big Tech. Every report came back to one question: is AI spending turning into cash?
How much is being spent#
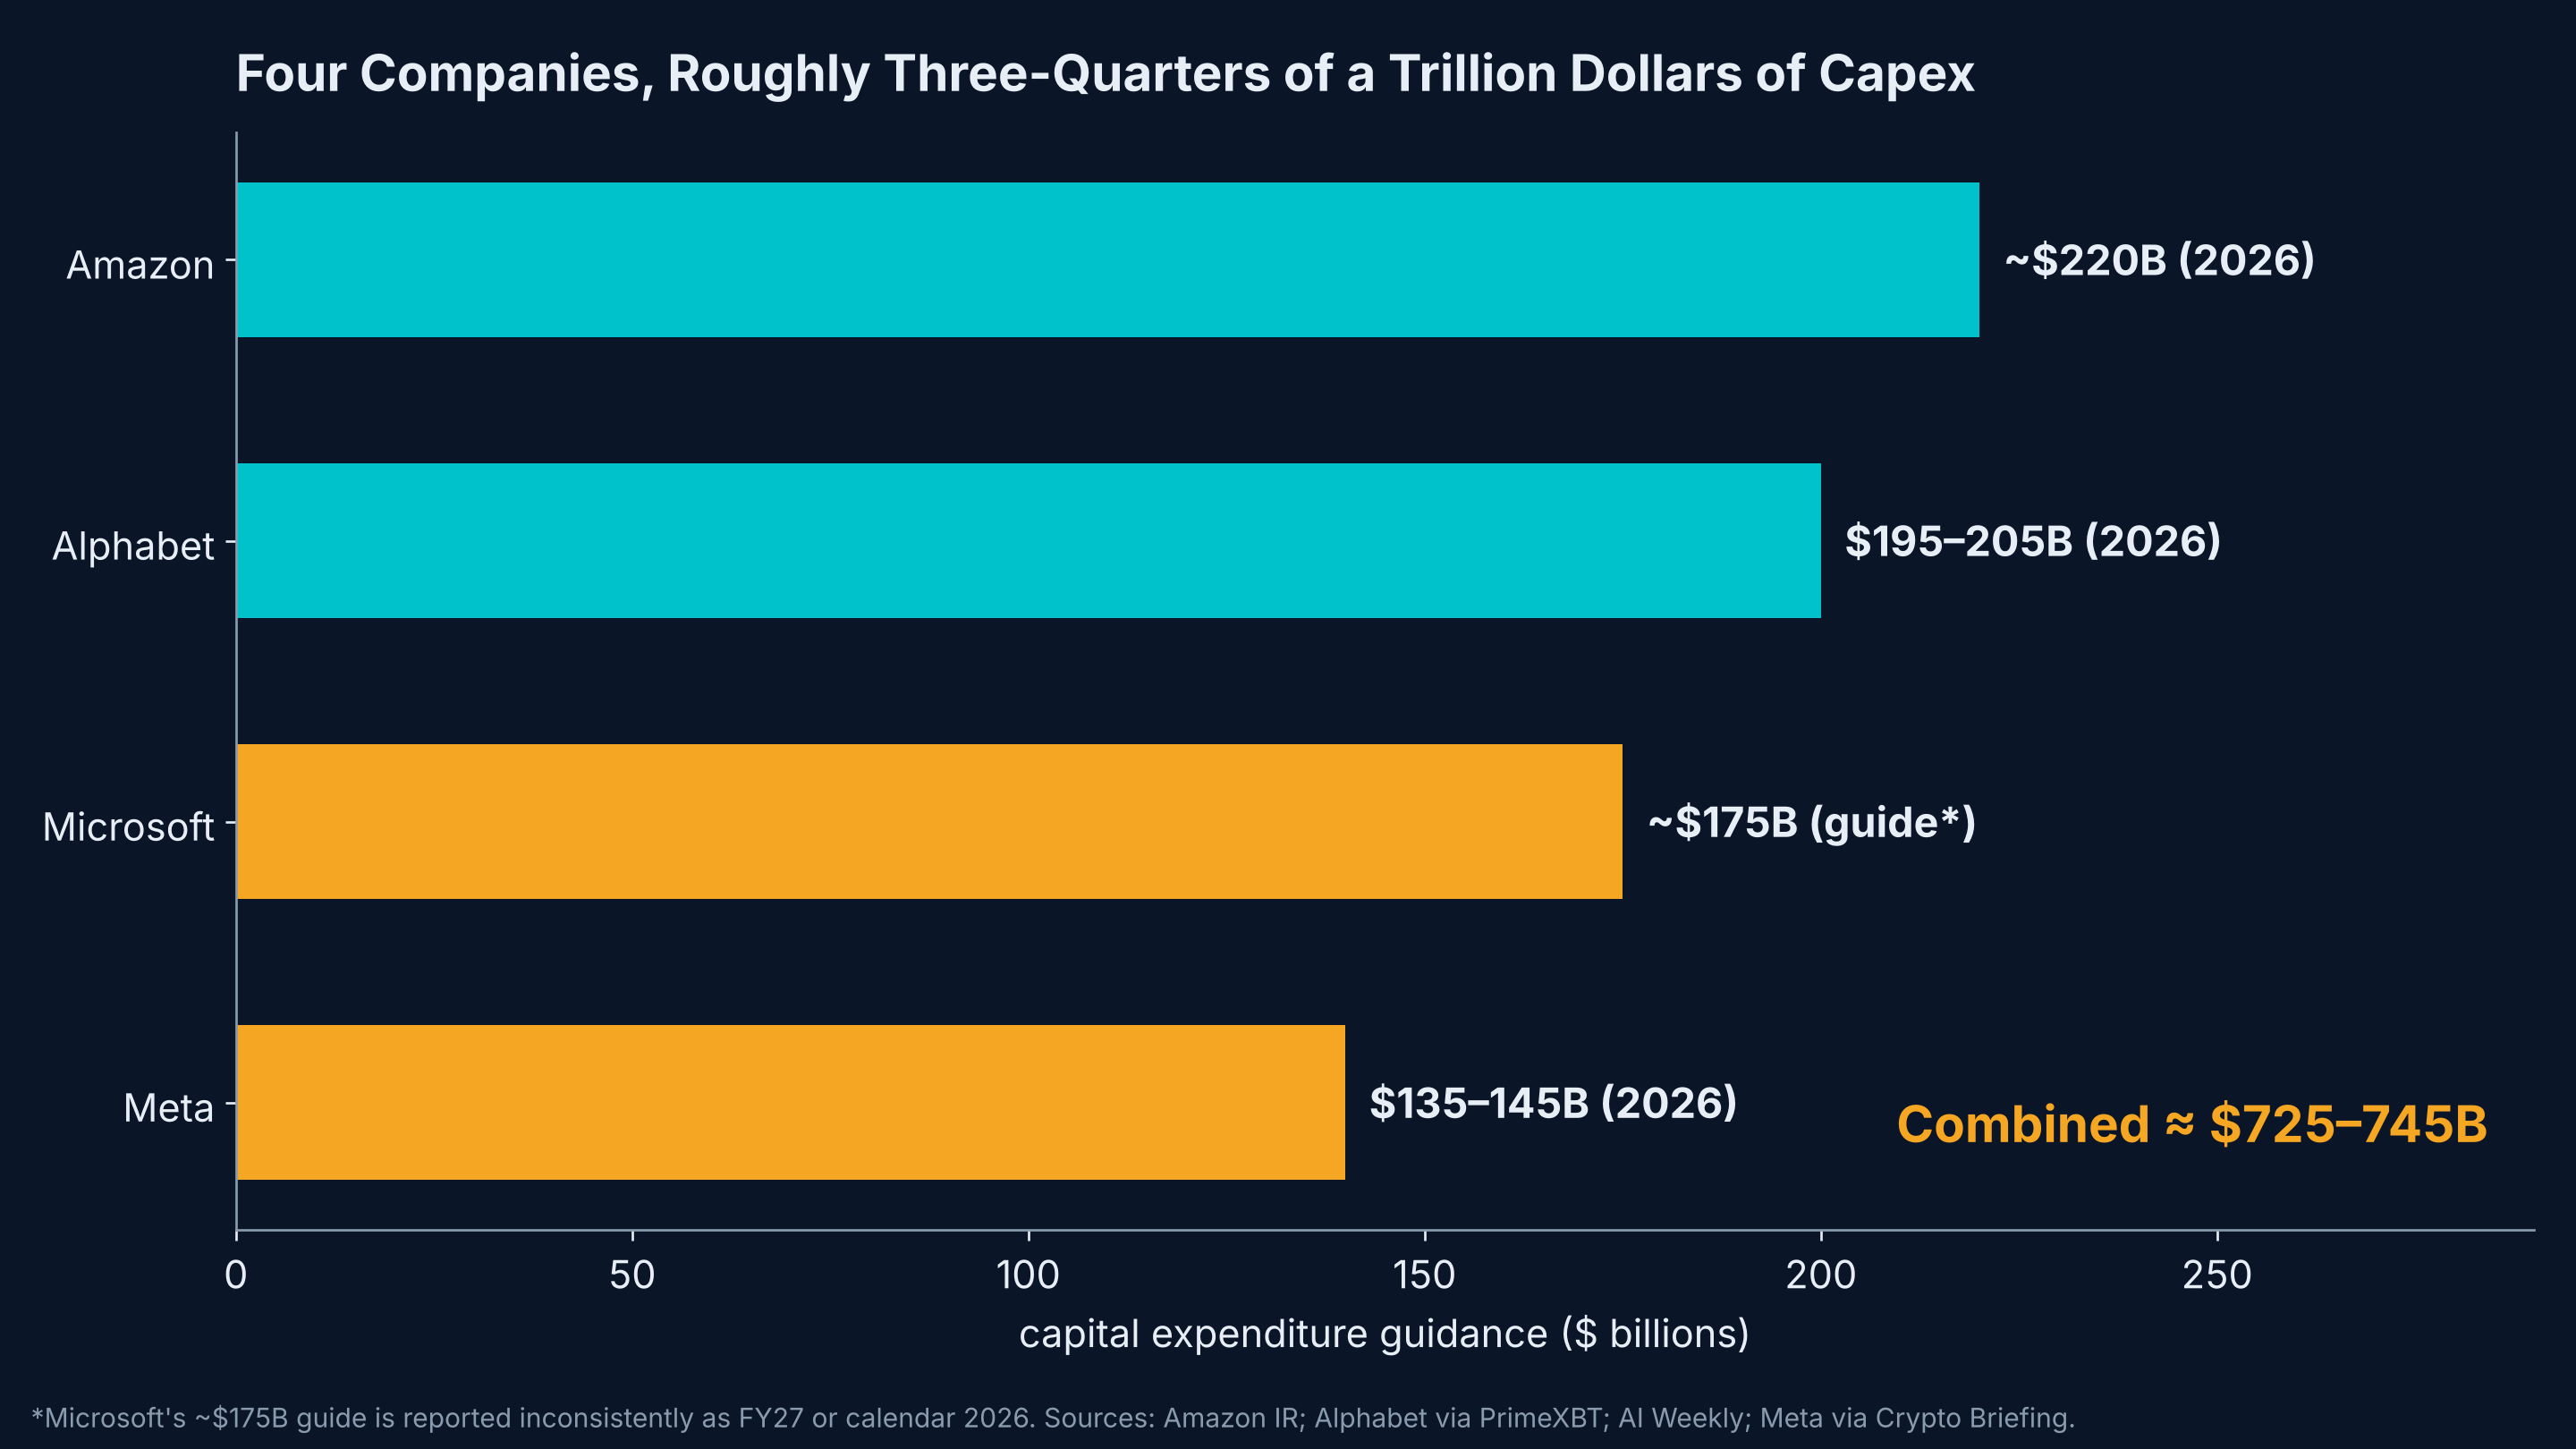
| Company | Capex guidance | Period | Notes |
|---|---|---|---|
| Amazon | about $220B | 2026 | Trailing 12-month property and equipment purchases already $215.2B |
| Alphabet | $195–205B | 2026 | Expects capex to "increase significantly" in 2027 |
| Microsoft | about $175B | Reported as fiscal 2027 or calendar 2026 | Quarterly capex $39.4B, nearly double a year earlier |
| Meta (reported last week) | $135–145B | 2026 | Low end raised from $130B |
| Combined | roughly $725–745B | Close to three-quarters of a trillion dollars |
Who is converting spending into cash#
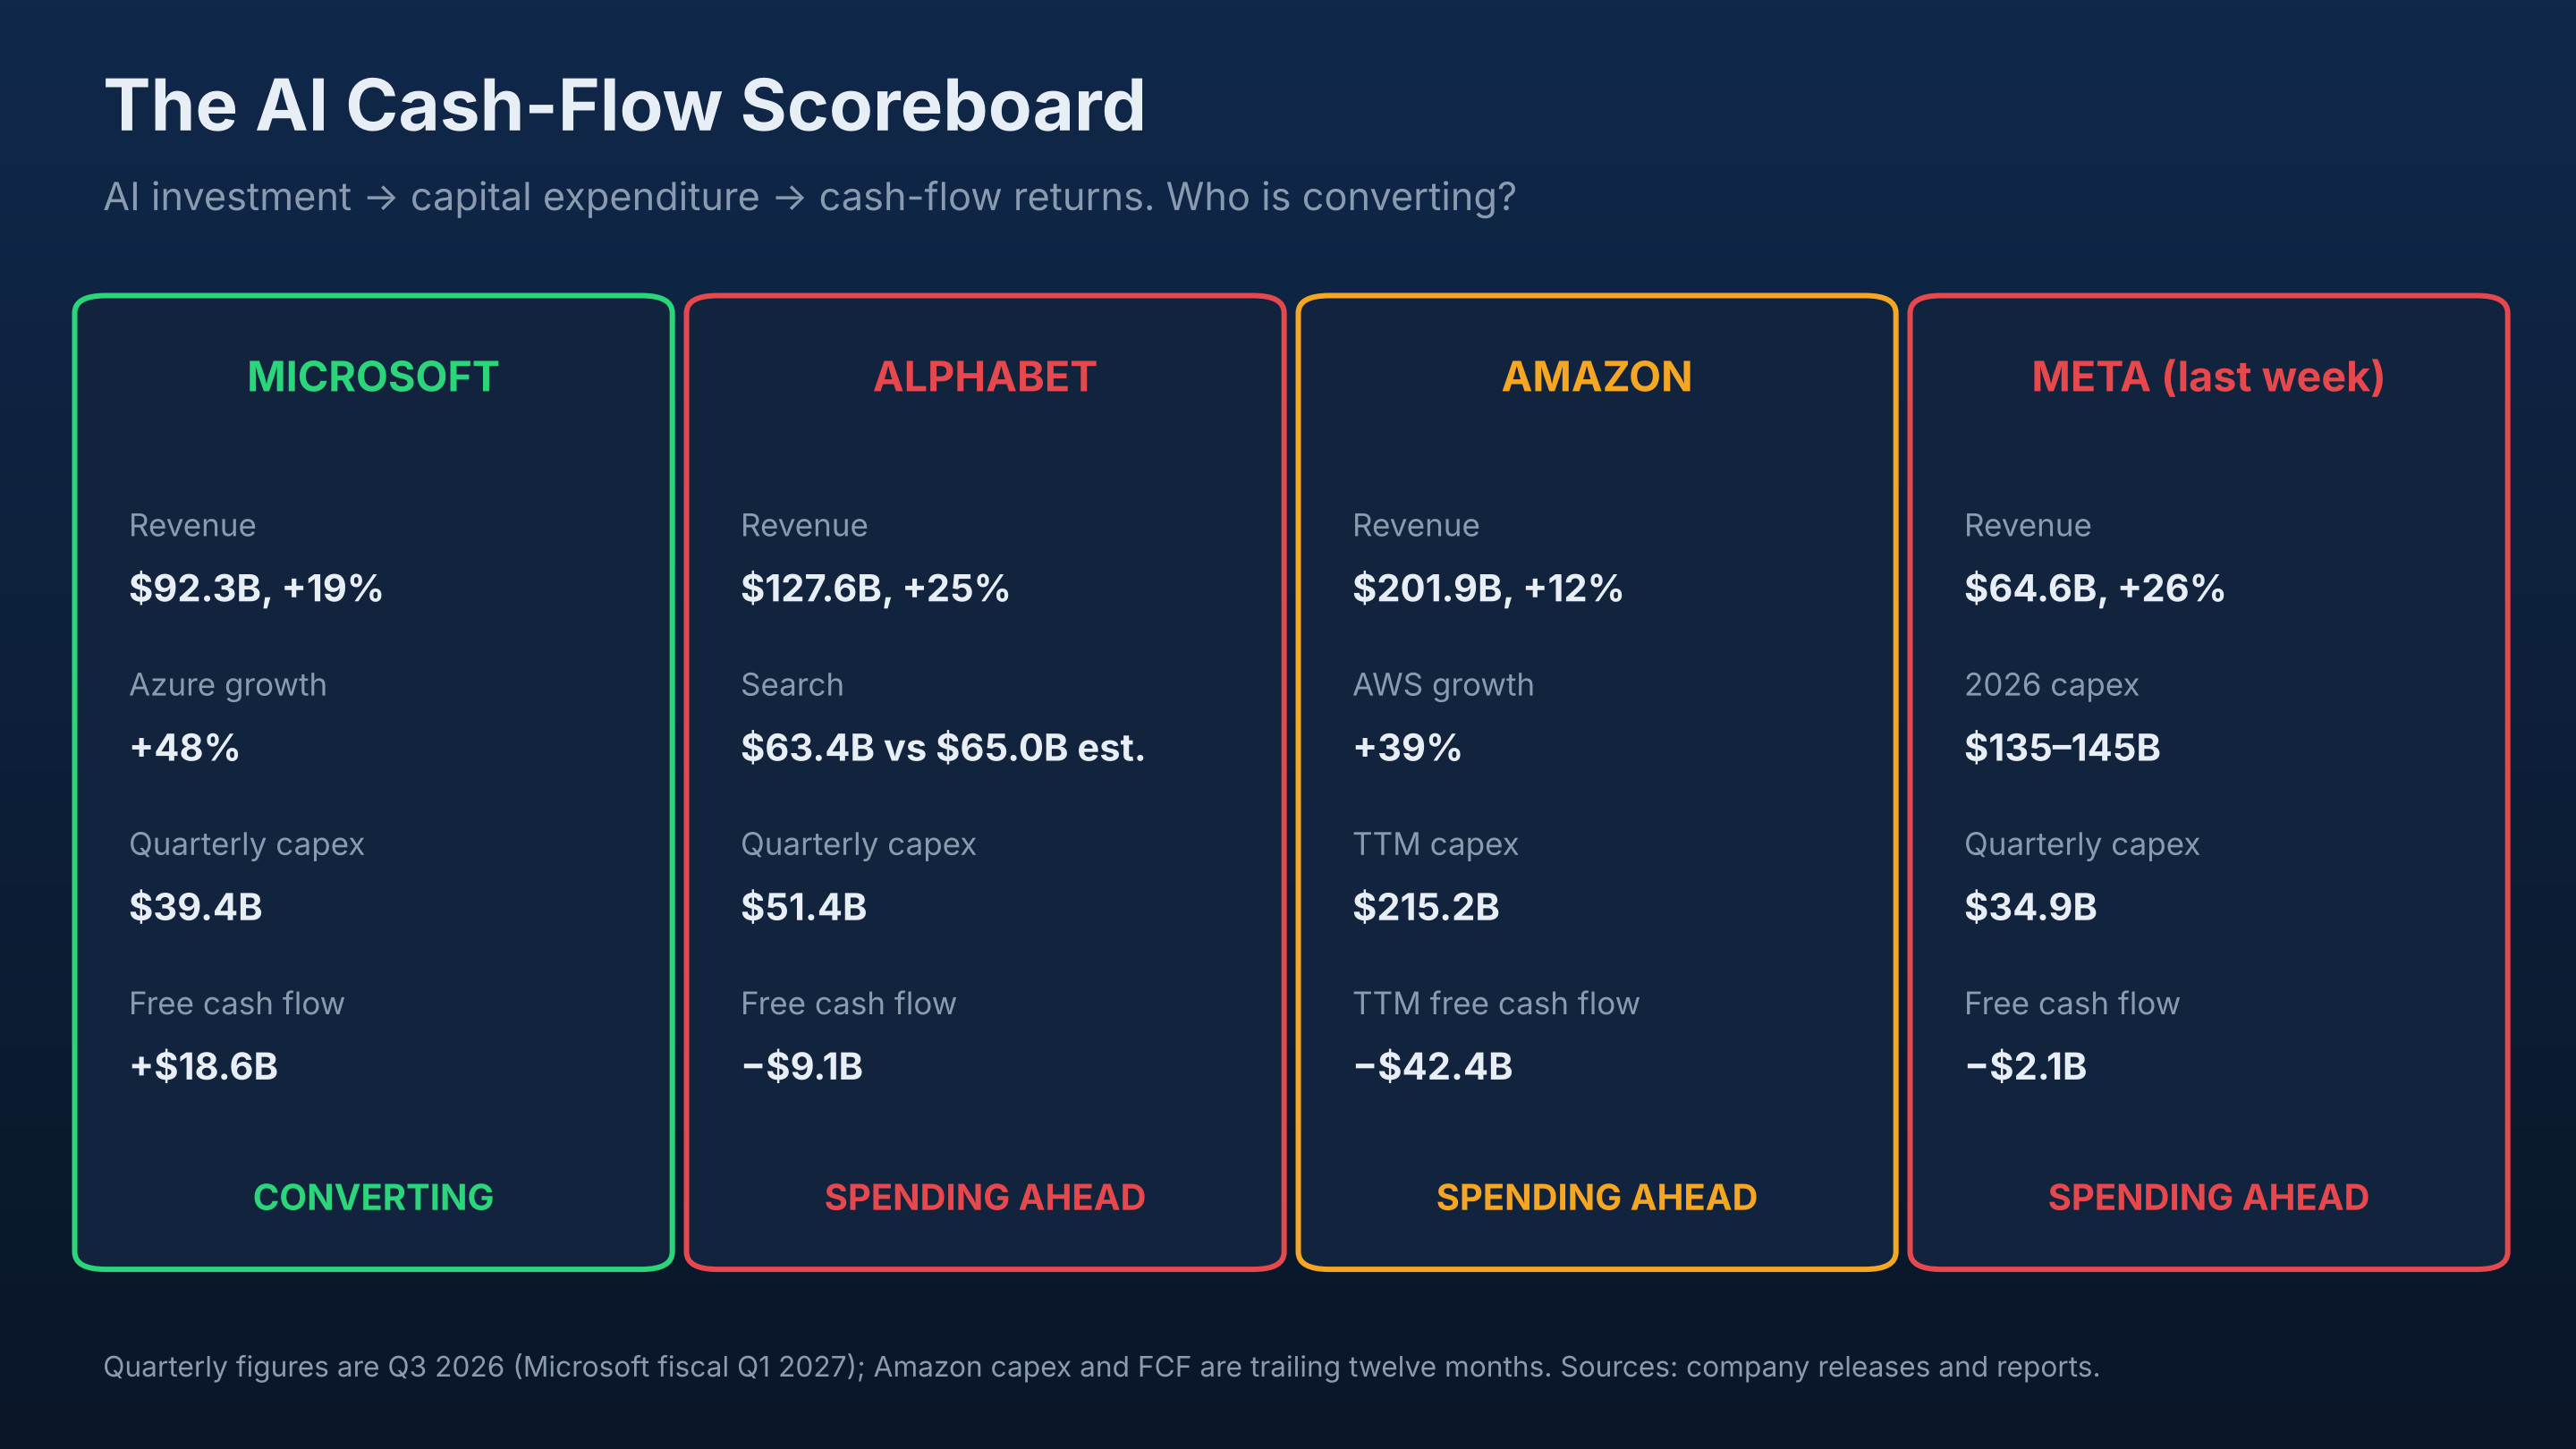
| Microsoft | Alphabet | Amazon | Meta | |
|---|---|---|---|---|
| Revenue | $92.3B, +19% | $127.6B, +25% | $201.9B, +12% | $64.6B, +26% |
| Cloud | Azure +48% | Cloud more than doubled to $30.7B | AWS +39%, fastest in ~5 years | n/a |
| Capex | $39.4B (quarter) | $51.4B (quarter) | $215.2B (trailing 12 months) | $34.9B (quarter) |
| Free cash flow | +$18.6B | −$9.1B | −$42.4B (trailing 12 months) | −$2.1B |
| Verdict | Converting | Spending ahead | Spending ahead | Spending ahead |
Capital intensity and the rise of debt#
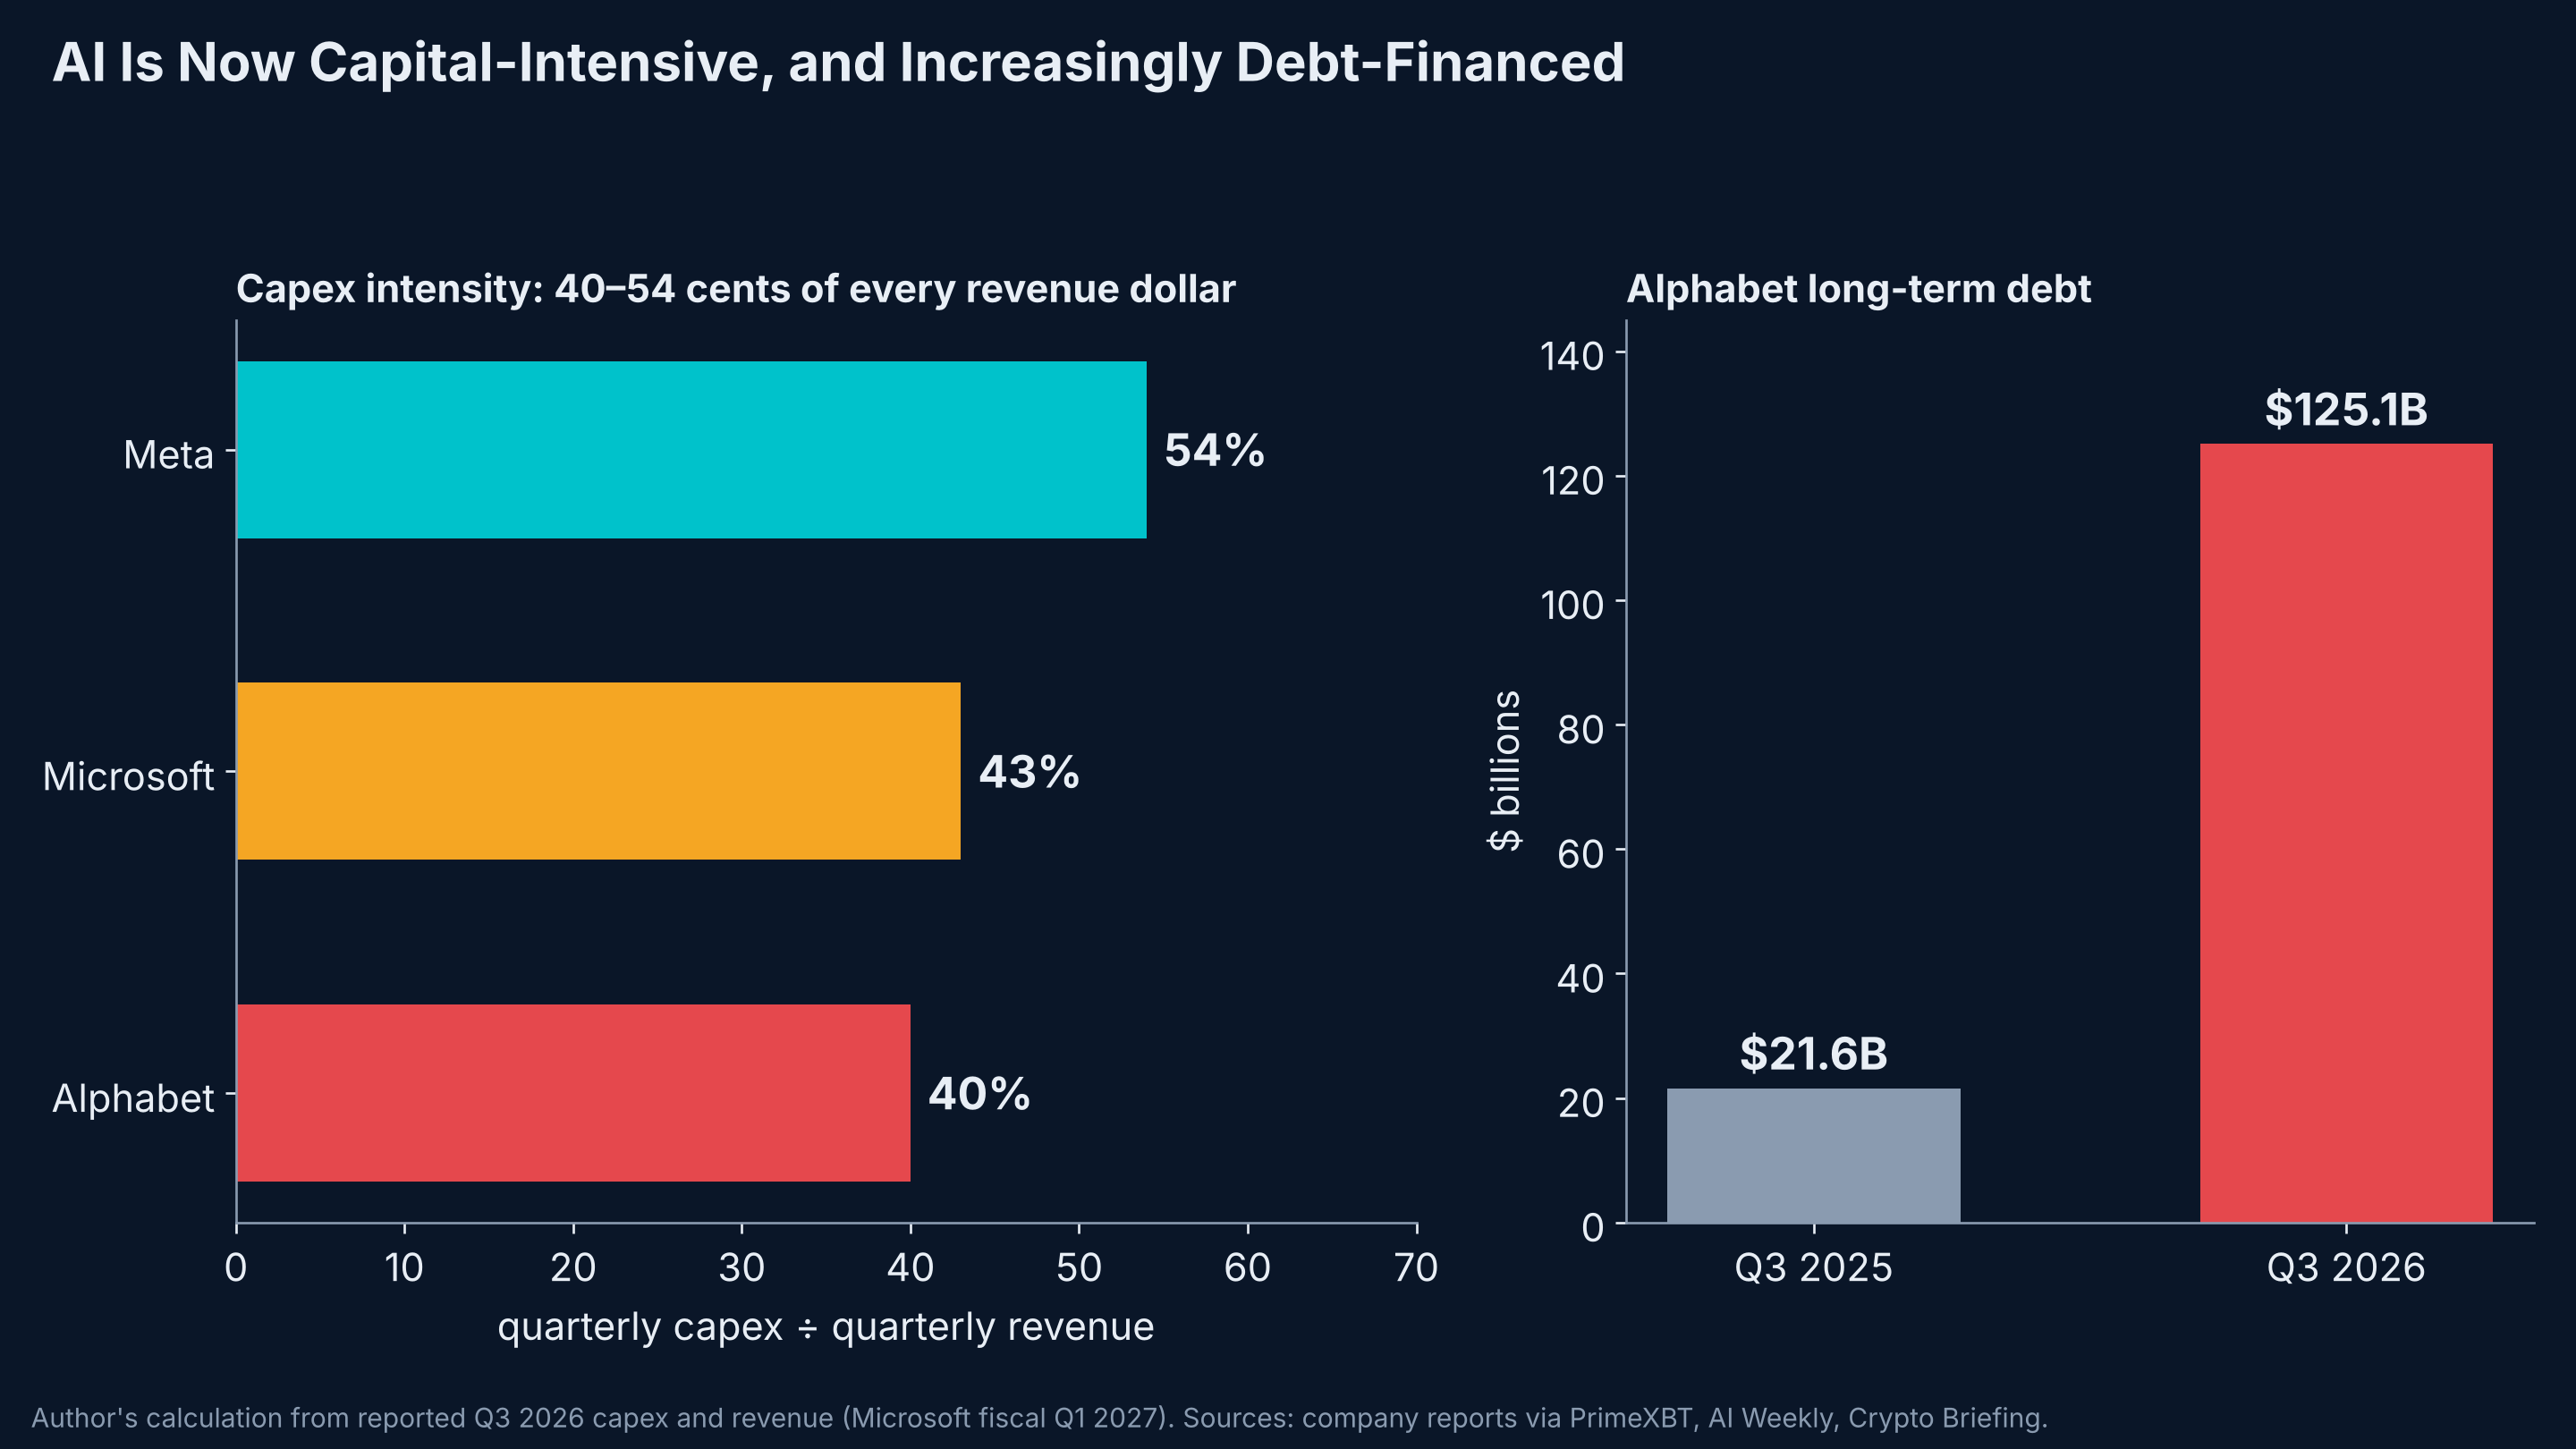
Two numbers capture how much the economics of Big Tech have changed:
- Capex intensity. In the latest quarter, Meta spent about 54 cents of capex for every dollar of revenue, Microsoft about 43 cents and Alphabet about 40 cents (author's calculation from reported figures). These were once asset-light software businesses. They now look more like utilities or telecom networks in their capital needs.
- Debt. Alphabet's long-term debt rose to $125.1B from $21.6B a year earlier. Part of the AI build-out is now financed with borrowed money, which makes it sensitive to the interest rates the Fed is keeping high.
The company details#
- Alphabet missed on both revenue ($127.6B vs $128.2B expected) and adjusted EPS ($2.67 vs $3.02) for the first time in nearly four years. Search revenue of $63.4B fell short of the $65.0B estimate. Cloud was the bright spot. Shares fell more than 10%.
- Amazon posted its highest-ever operating margin (13.9%) and AWS growth of 39%, but trailing free cash flow swung from +$14.8B to −$42.4B in a year. It guided Q4 sales to $240–247B.
- Microsoft grew revenue 19%, Azure 48%, and generated $18.6B of free cash flow even with nearly double the capex of a year earlier.
The market is not abandoning AI. It is starting to price the gap between AI spending and AI cash returns, and to reward the companies that close it.
4. Intel: beat the quarter, lost 29% on the outlook#↑ Contents
 Illustration.
Intel's third quarter was better than expected. Its outlook was not.
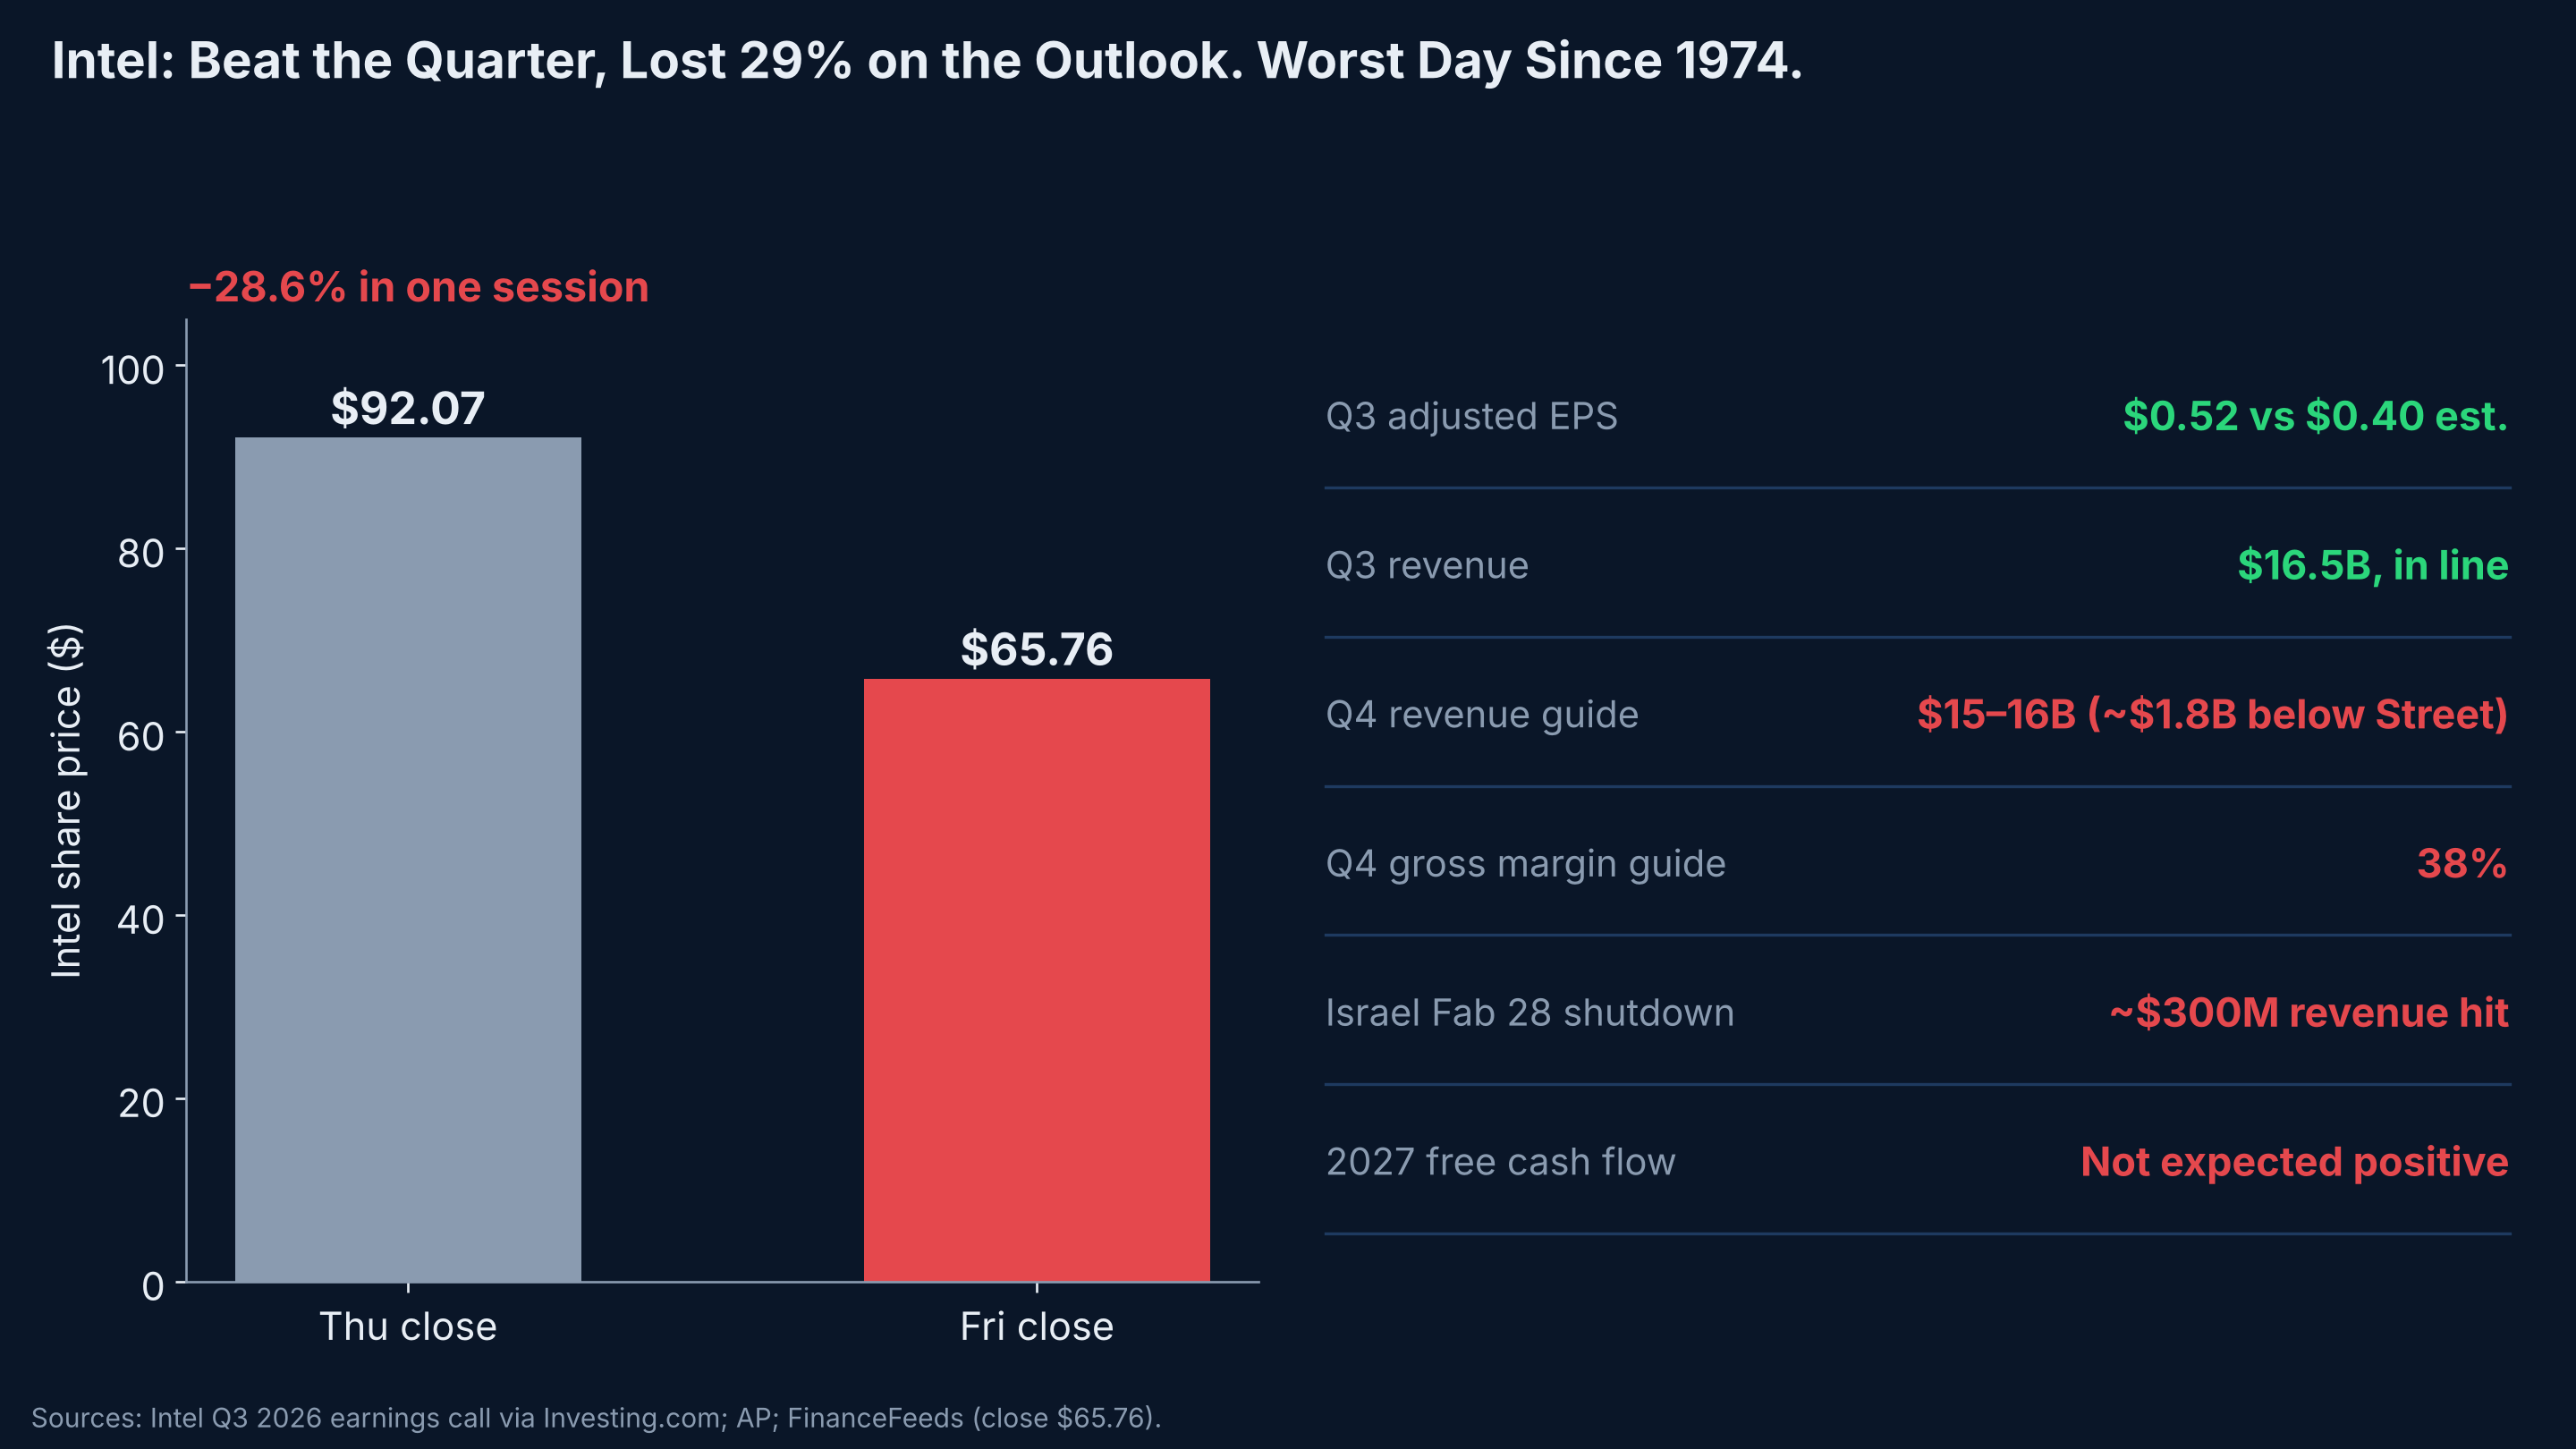
| Item | Result |
|---|---|
| Q3 adjusted EPS | $0.52 vs $0.40 expected, its eighth straight beat |
| Q3 revenue | $16.5B, in line |
| Data center and AI revenue | $7.3B, up nearly 80% year over year, with demand exceeding supply |
| Client computing revenue | $8.1B, down 9% from the prior quarter |
| Foundry | $6.7B revenue, but a $1.9B operating loss |
| Q4 revenue guidance | $15–16B, about $1.8B below Street expectations |
| Q4 gross margin guidance | 38%, down from 44.1% in Q3 |
| Israel Fab 28 shutdown | About $300M of lost Q4 revenue and ~200 bp of margin |
| 2027 outlook | An "investment year"; free cash flow not expected to be positive |
| Stock | From $92.07 to about $65.76, roughly −29%, its worst day since 1974 |
Intel's story is the week's theme in a single company: real AI demand (data center revenue up nearly 80%), heavy capital needs (foundry losses, rising capex), and no positive free cash flow in sight for 2027. The market's verdict was immediate.
The damage spread across the sector in one session: AMD fell about 10%, Marvell 9%, Broadcom and Micron about 5%, and Nvidia about 4%. The iShares Semiconductor ETF fell about 8%.
5. Friday's flight from risk#↑ Contents
 Illustration.
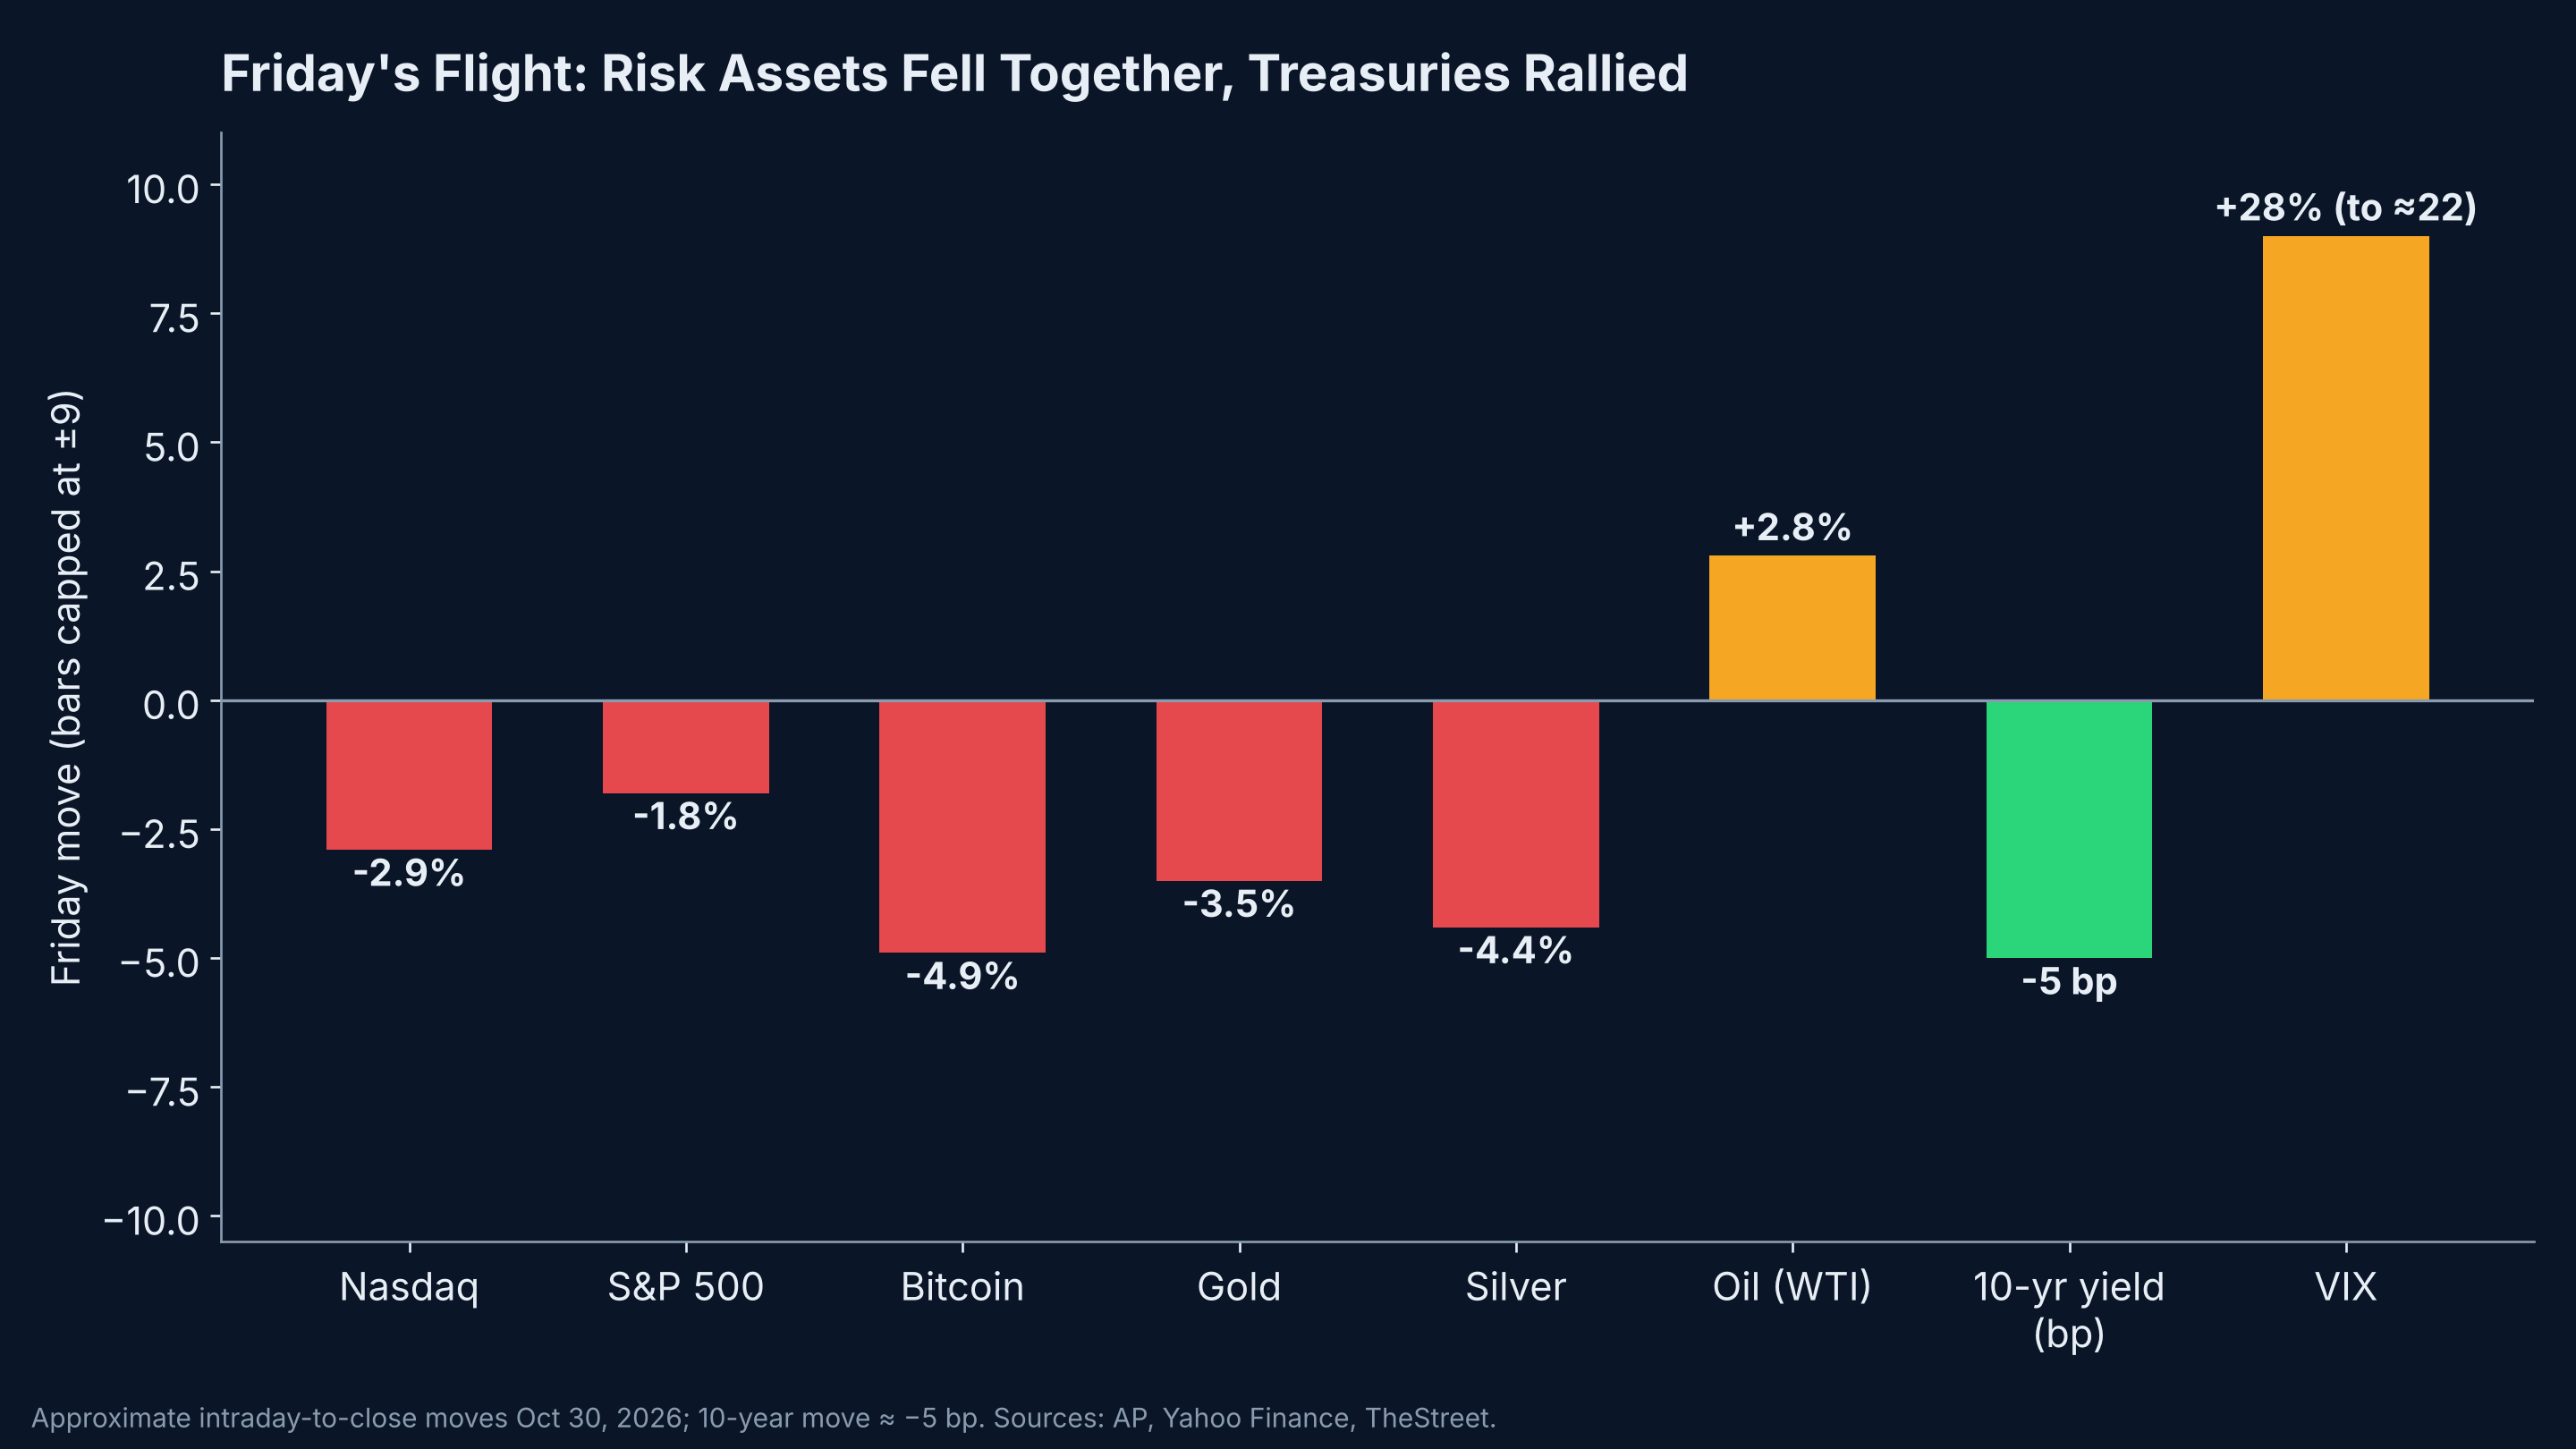
| Asset | Friday | Signal |
|---|---|---|
| Nasdaq | −2.9% | AI and chip selloff |
| Bitcoin | about −4.9% | Risk appetite falls |
| Gold | about −3.5% | Even the traditional haven sold off |
| Oil (WTI) | about +2.8%, to ~$105 | Middle East supply risk |
| 10-year Treasury | below 4.95% | Treasuries were the haven |
| VIX | up about 28%, to ≈ 22 | Volatility jumped |
Approximate moves from intraday reports; closing levels may differ slightly.
Stocks, crypto and precious metals fell together, while Treasuries rallied. Bonds are still doing their job as a hedge, but the list of assets falling together grew longer this week, and that is the pattern risk managers should watch.
6. The research: how "impossible" was Friday?#↑ Contents
This is where the week connects directly to my research. Intel's fall is a textbook example of the gap between how many risk models are built and how markets actually behave.
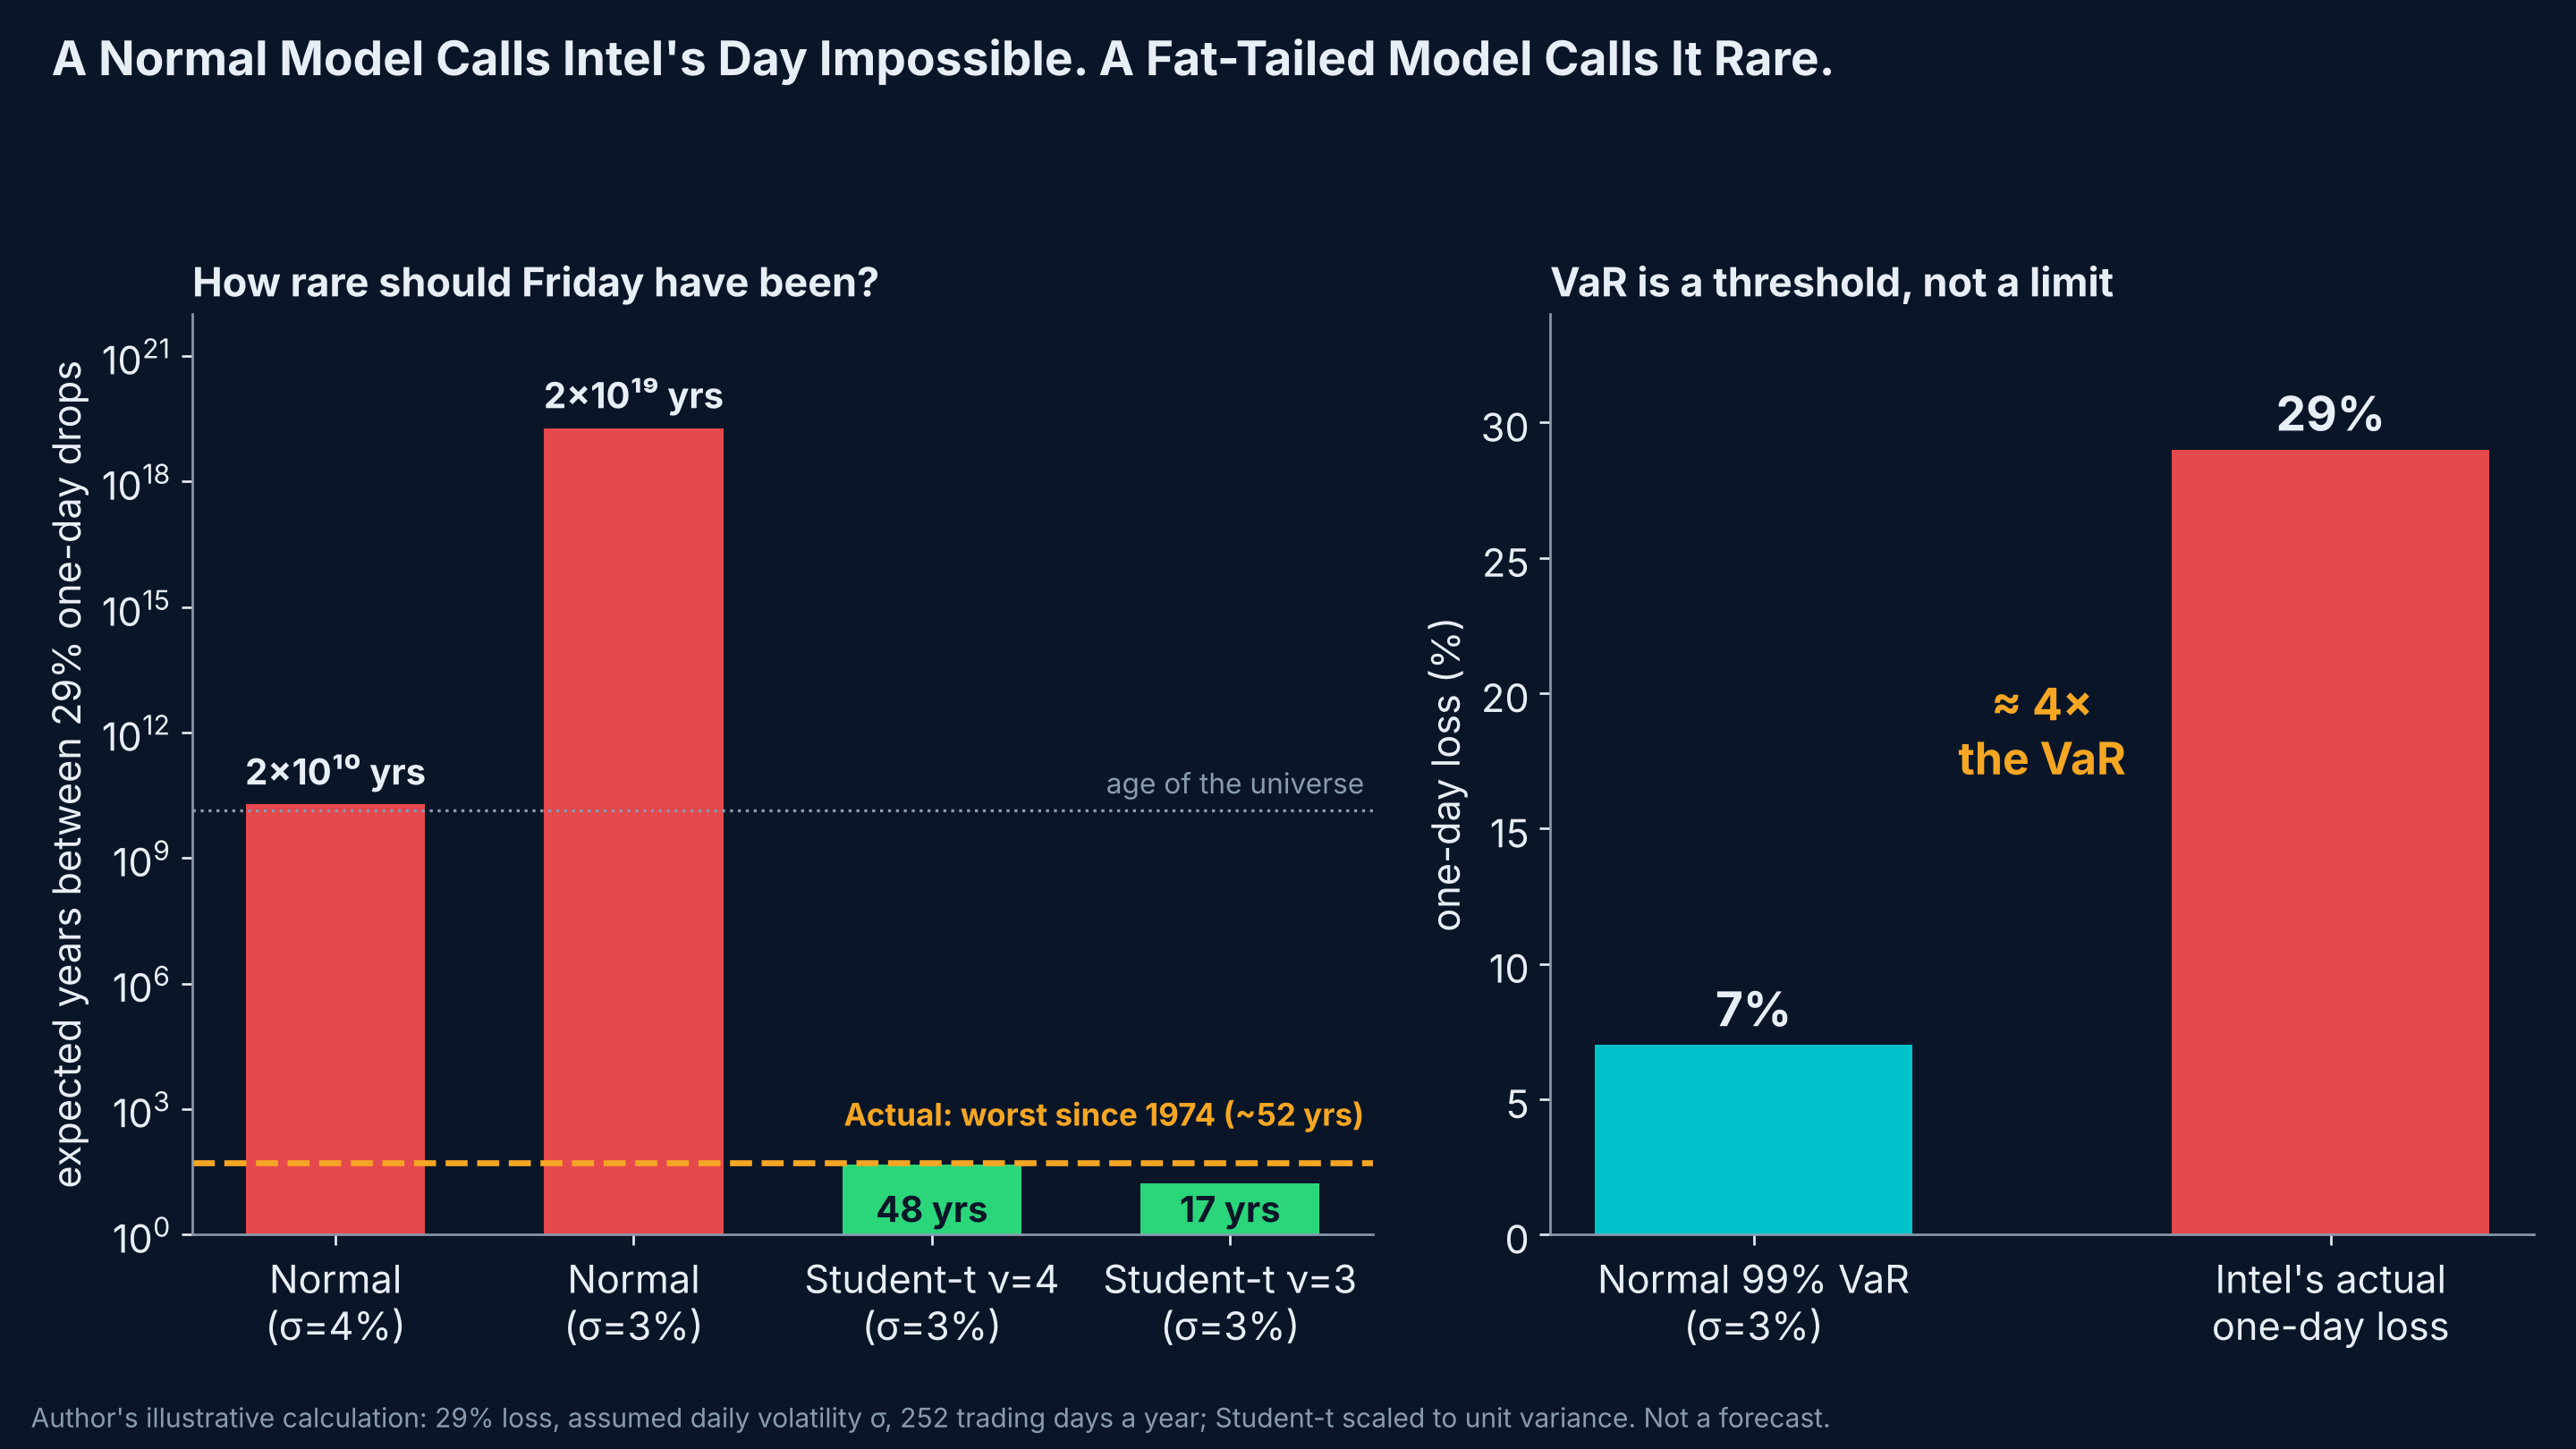
Many Value-at-Risk (VaR) models assume, explicitly or implicitly, that daily returns follow a normal distribution. Here is what that implies for a stock with about 3% daily volatility, a reasonable level for a large chip stock:
| Model | Daily volatility | Expected time between 29% one-day drops |
|---|---|---|
| Normal distribution | 4% | about 2 × 10¹⁰ years, longer than the age of the universe |
| Normal distribution | 3% | about 2 × 10¹⁹ years |
| Student-t, 4 degrees of freedom (fat tails) | 3% | about 48 years |
| Student-t, 3 degrees of freedom (fat tails) | 3% | about 17 years |
| Reality | Worst day since 1974, about 52 years |
Author's illustrative calculation, not a forecast. Student-t distributions are scaled to the same volatility.
Same 99% VaR, very different tails#
The most important result is not the 10¹⁹. It is this:
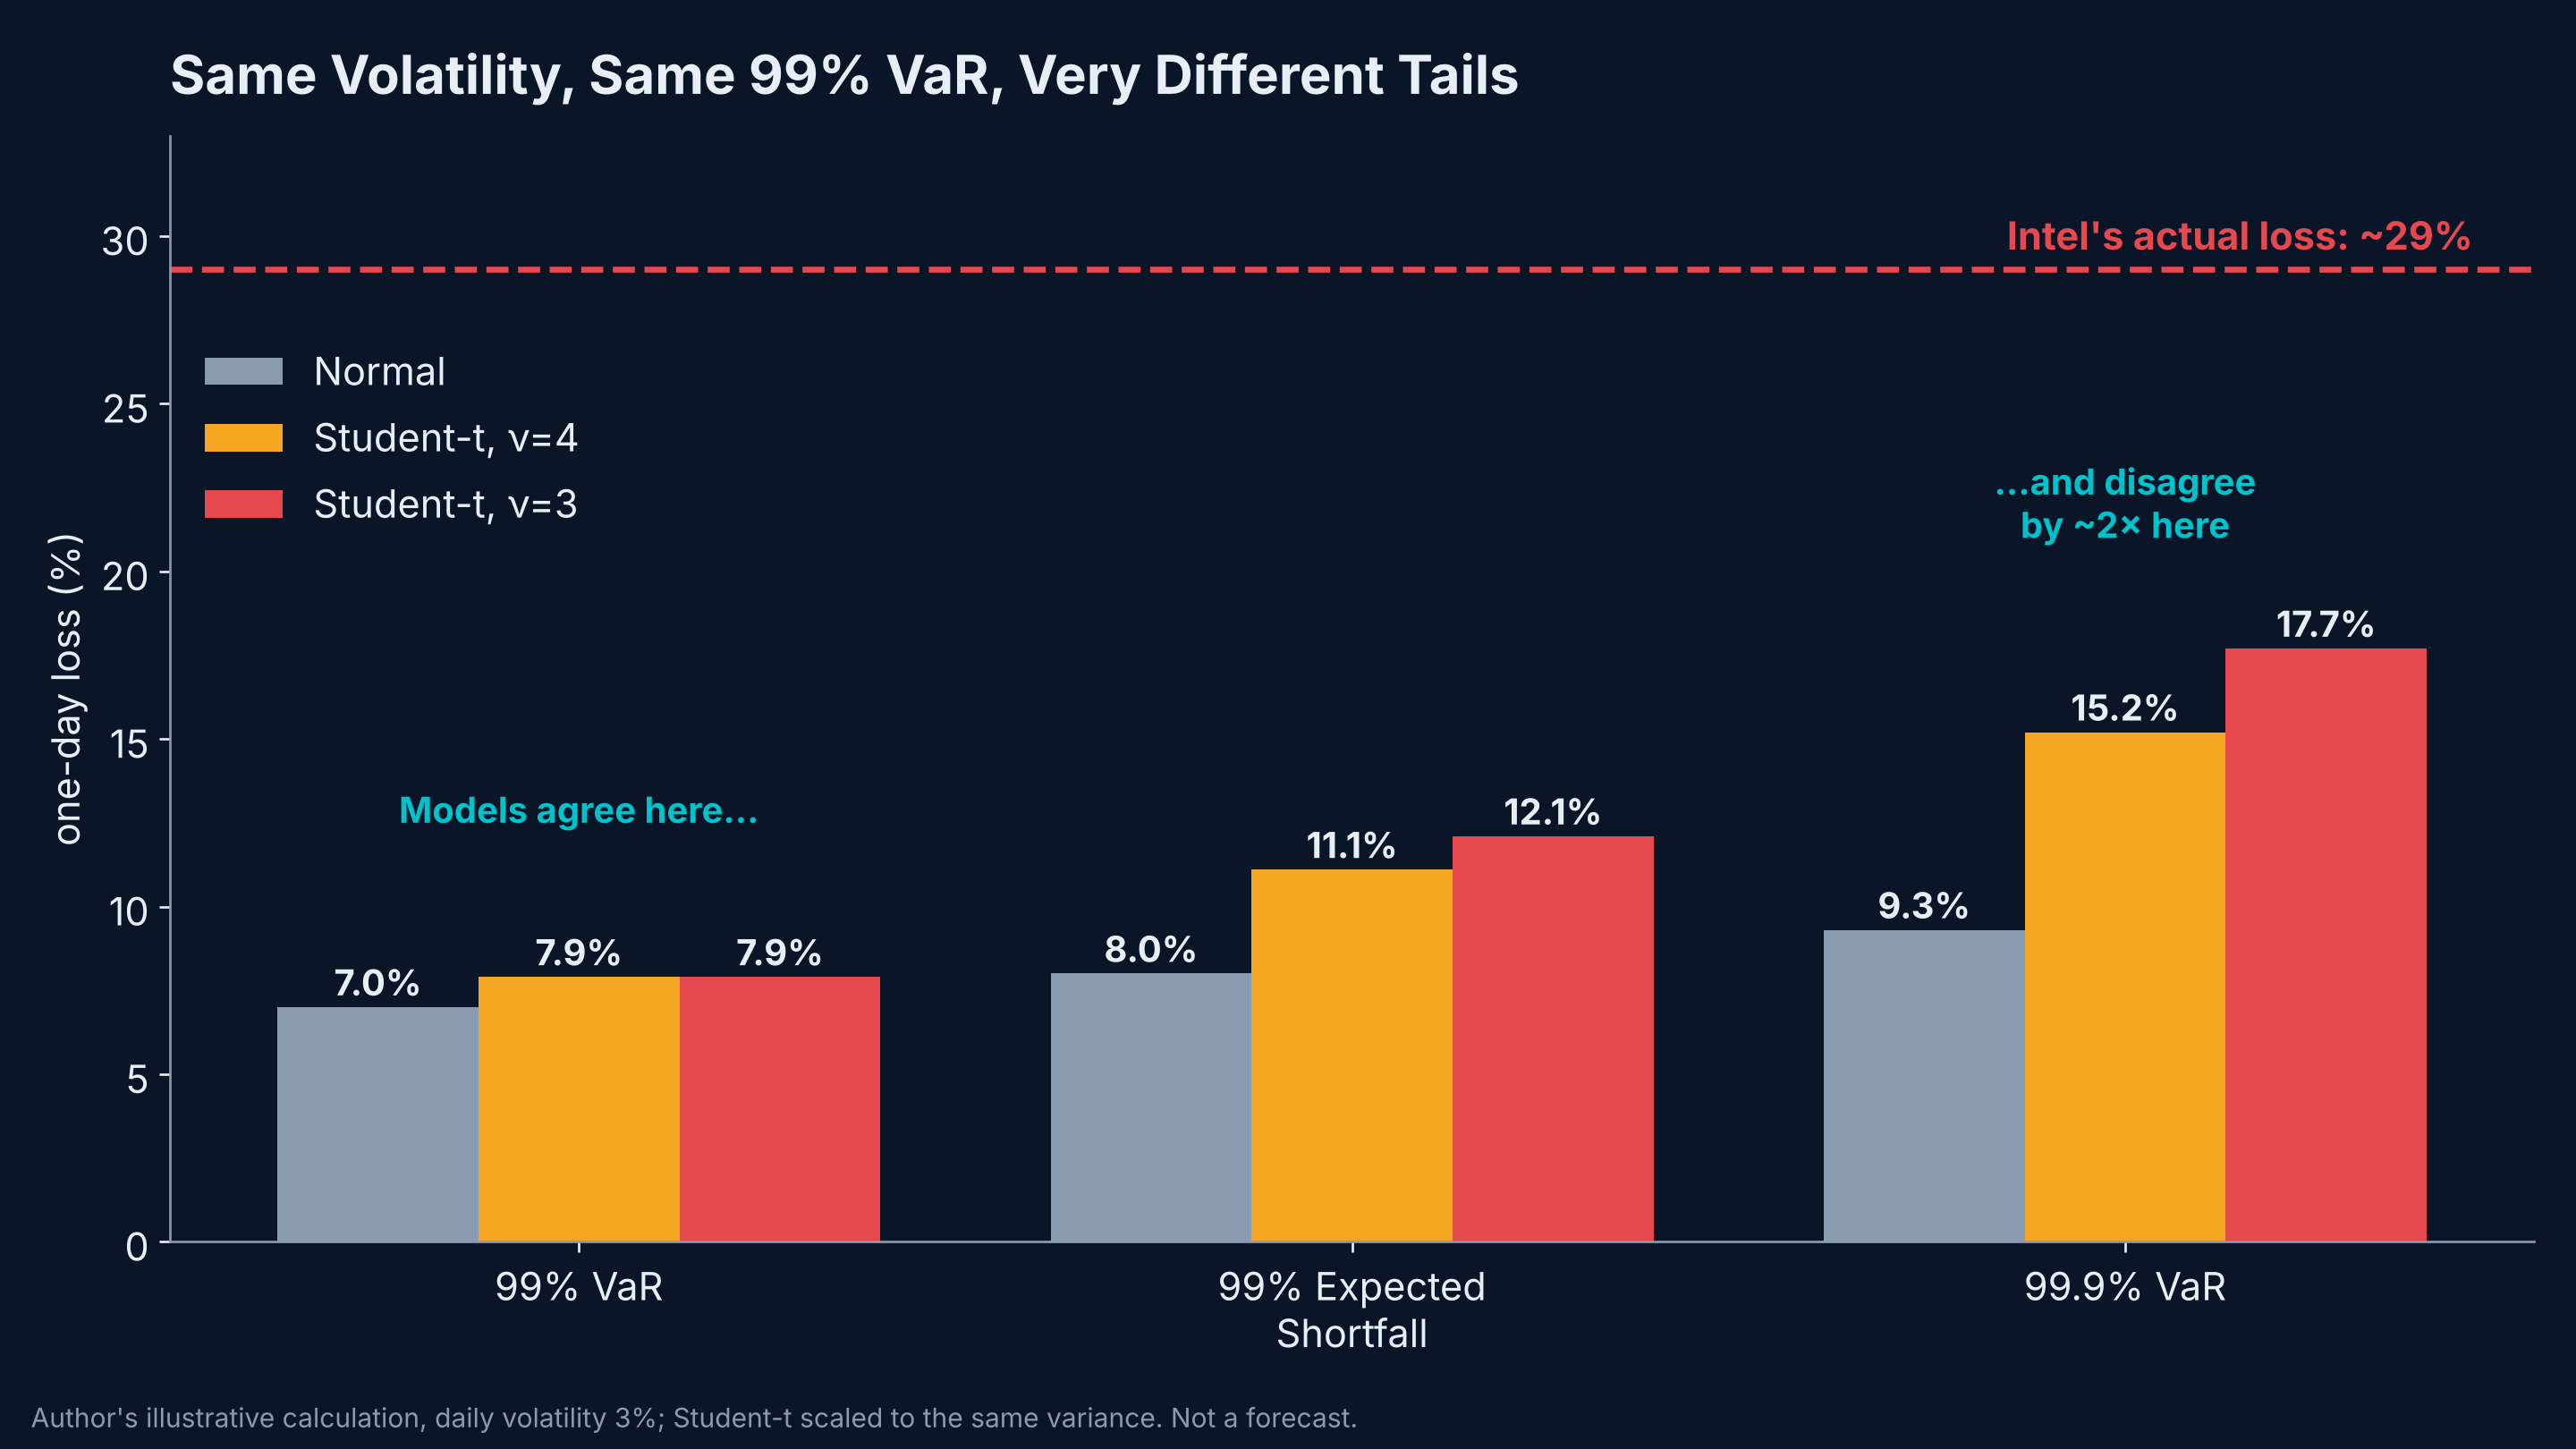
| Risk measure (σ = 3% a day) | Normal | Student-t, ν = 4 | Student-t, ν = 3 |
|---|---|---|---|
| 99% VaR | 7.0% | 7.9% | 7.9% |
| 99% Expected Shortfall | 8.0% | 11.1% | 12.1% |
| 99.9% VaR | 9.3% | 15.2% | 17.7% |
At the 99% VaR level used for most bank reporting, the three models are almost identical: 7.0% to 7.9%. Look one step further into the tail and they diverge sharply. Expected Shortfall is about 50% higher under fat tails, and the 99.9% VaR nearly doubles.
That is why:
- A model can pass its 99% VaR backtest and still badly misjudge crash risk. The 99% level barely distinguishes thin tails from fat ones.
- Regulators moved market-risk capital toward Expected Shortfall under Basel's Fundamental Review of the Trading Book, because ES looks at how bad losses are beyond the threshold, not just how often the threshold is crossed.
- VaR is a threshold, not a limit. At 3% daily volatility, a normal 99% VaR is about 7%. Intel lost about four times that in one session.
7. Five papers, one week#↑ Contents
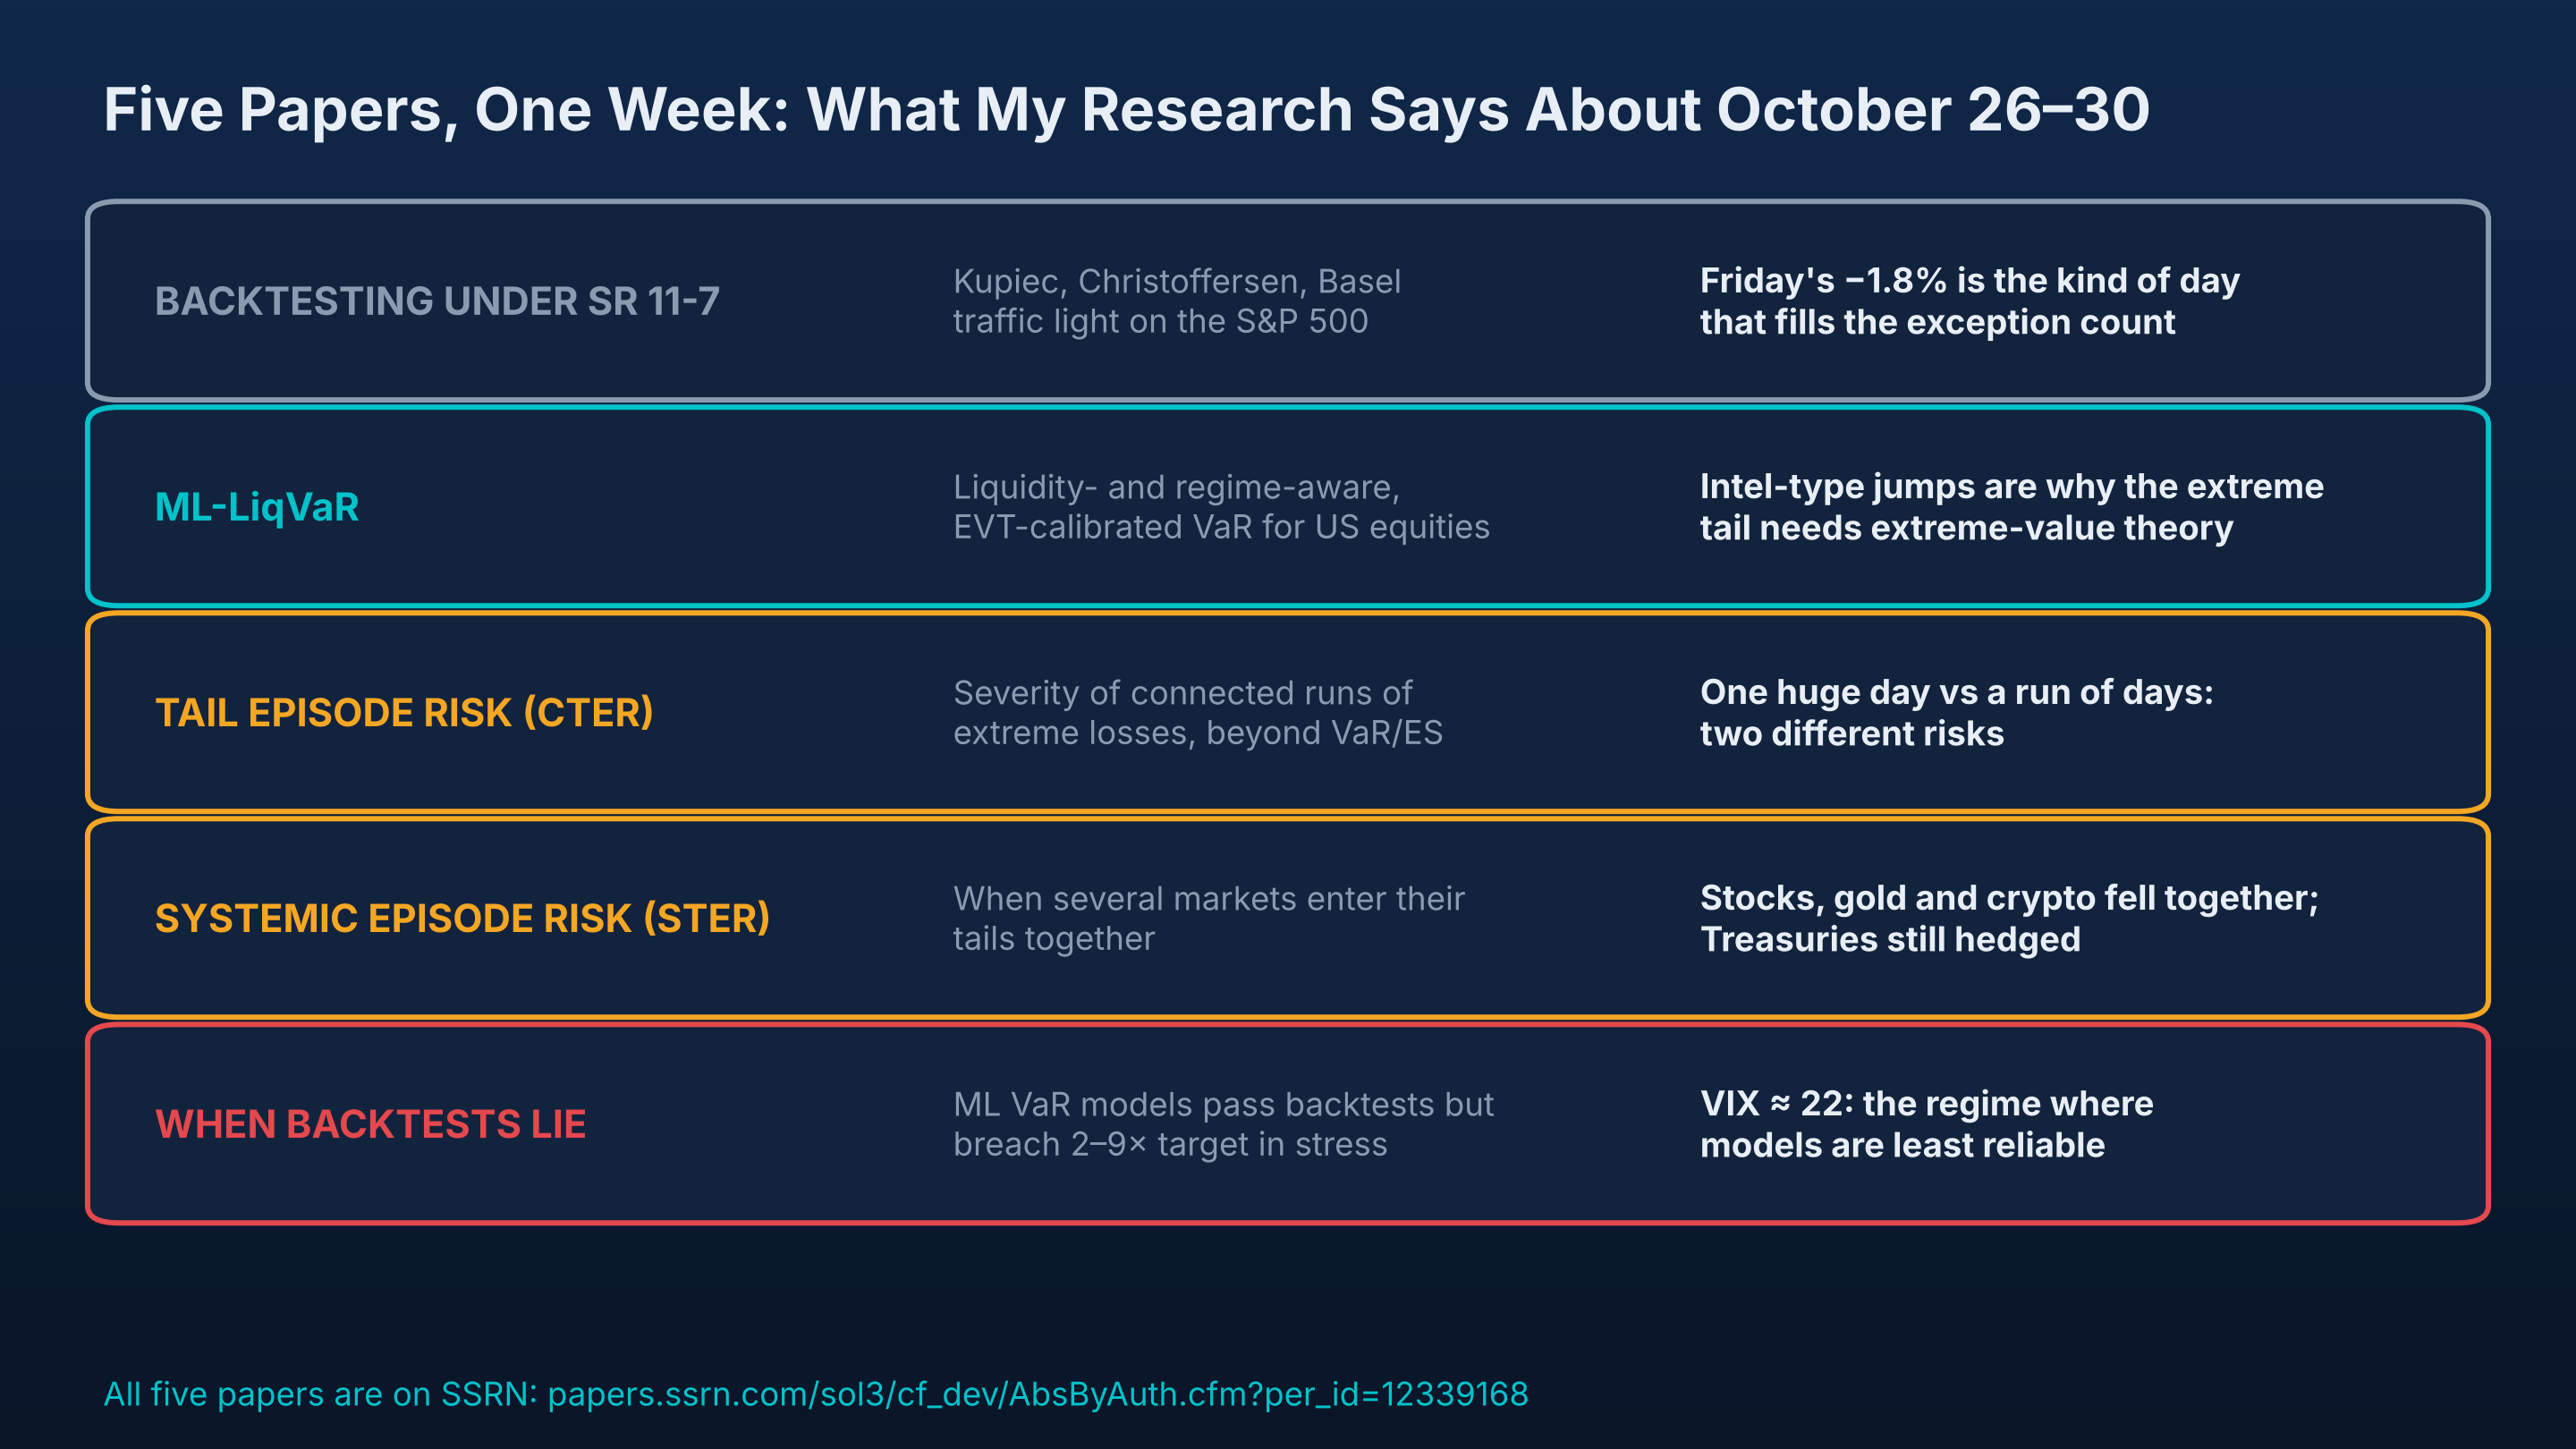
Each of my five working papers on SSRN addresses a different part of what happened this week.
| Paper | What it studies | What it says about this week |
|---|---|---|
| Backtesting Value-at-Risk Models Under SR 11-7 | Kupiec, Christoffersen and Basel traffic-light tests applied to S&P 500 returns, 2018–2024 | Days like Friday's −1.8% fill a bank's exception count, but counting exceptions alone can't tell you how severe they were |
| ML-LiqVaR | A liquidity- and regime-aware gradient-boosting VaR for US equities, with the extreme tail calibrated by extreme-value theory | Intel-type jumps are why the far tail needs dedicated extreme-value calibration rather than a normal assumption |
| Conditional Tail Episode Risk | The severity of connected runs of extreme losses, beyond VaR and Expected Shortfall | A single 29% day and a run of smaller losses are different risks; this week's index losses were concentrated in one session |
| Systemic Tail Episode Risk | When several markets enter their tails together, and for how long | Stocks, crypto and gold fell together on Friday, but Treasuries rallied, so the full cross-market breadth test was not met (qualitative reading) |
| When Backtests Lie | ML VaR models that pass standard backtests yet breach 2–9× their target in stressed markets | The VIX jumped to about 22, a move toward the volatility regime where these models are least reliable |
Why this matters beyond one stock#
Intel is one company, but the lesson scales. A handful of AI-linked companies now make up a large share of the major U.S. indexes, and they are spending close to three-quarters of a trillion dollars a year, increasingly with borrowed money. When one of them disappoints, the move can be far larger than a normal model expects, and it can spread across the sector in a single session, as it did on Friday.
For banks, asset managers and pension funds, measuring that tail correctly is not an academic question. It decides how much capital they hold, how much risk they believe they are carrying, and whether a 99% VaR report gives them real protection or false comfort.
8. What risk managers can do now#↑ Contents
| # | Action | Why |
|---|---|---|
| 1 | Check the tail assumption in every VaR model | A normal tail can understate crash risk by many orders of magnitude |
| 2 | Calibrate the extreme tail separately (e.g., extreme-value theory) | The far tail behaves differently from everyday volatility |
| 3 | Report Expected Shortfall and 99.9% VaR alongside 99% VaR | The 99% level barely separates thin tails from fat ones |
| 4 | Model earnings-date jump risk for concentrated single-stock exposure | Intel lost 29% on a scheduled event, not a surprise headline |
| 5 | Split backtests by volatility regime | Models that look fine in calm markets can fail as volatility rises |
| 6 | Watch concentration in AI-linked names | A sector-wide selloff can start with one earnings report |
| 7 | Track credit, not just equity | AI capex is increasingly debt-financed; stress can travel through bond markets |
9. What to watch next week#↑ Contents
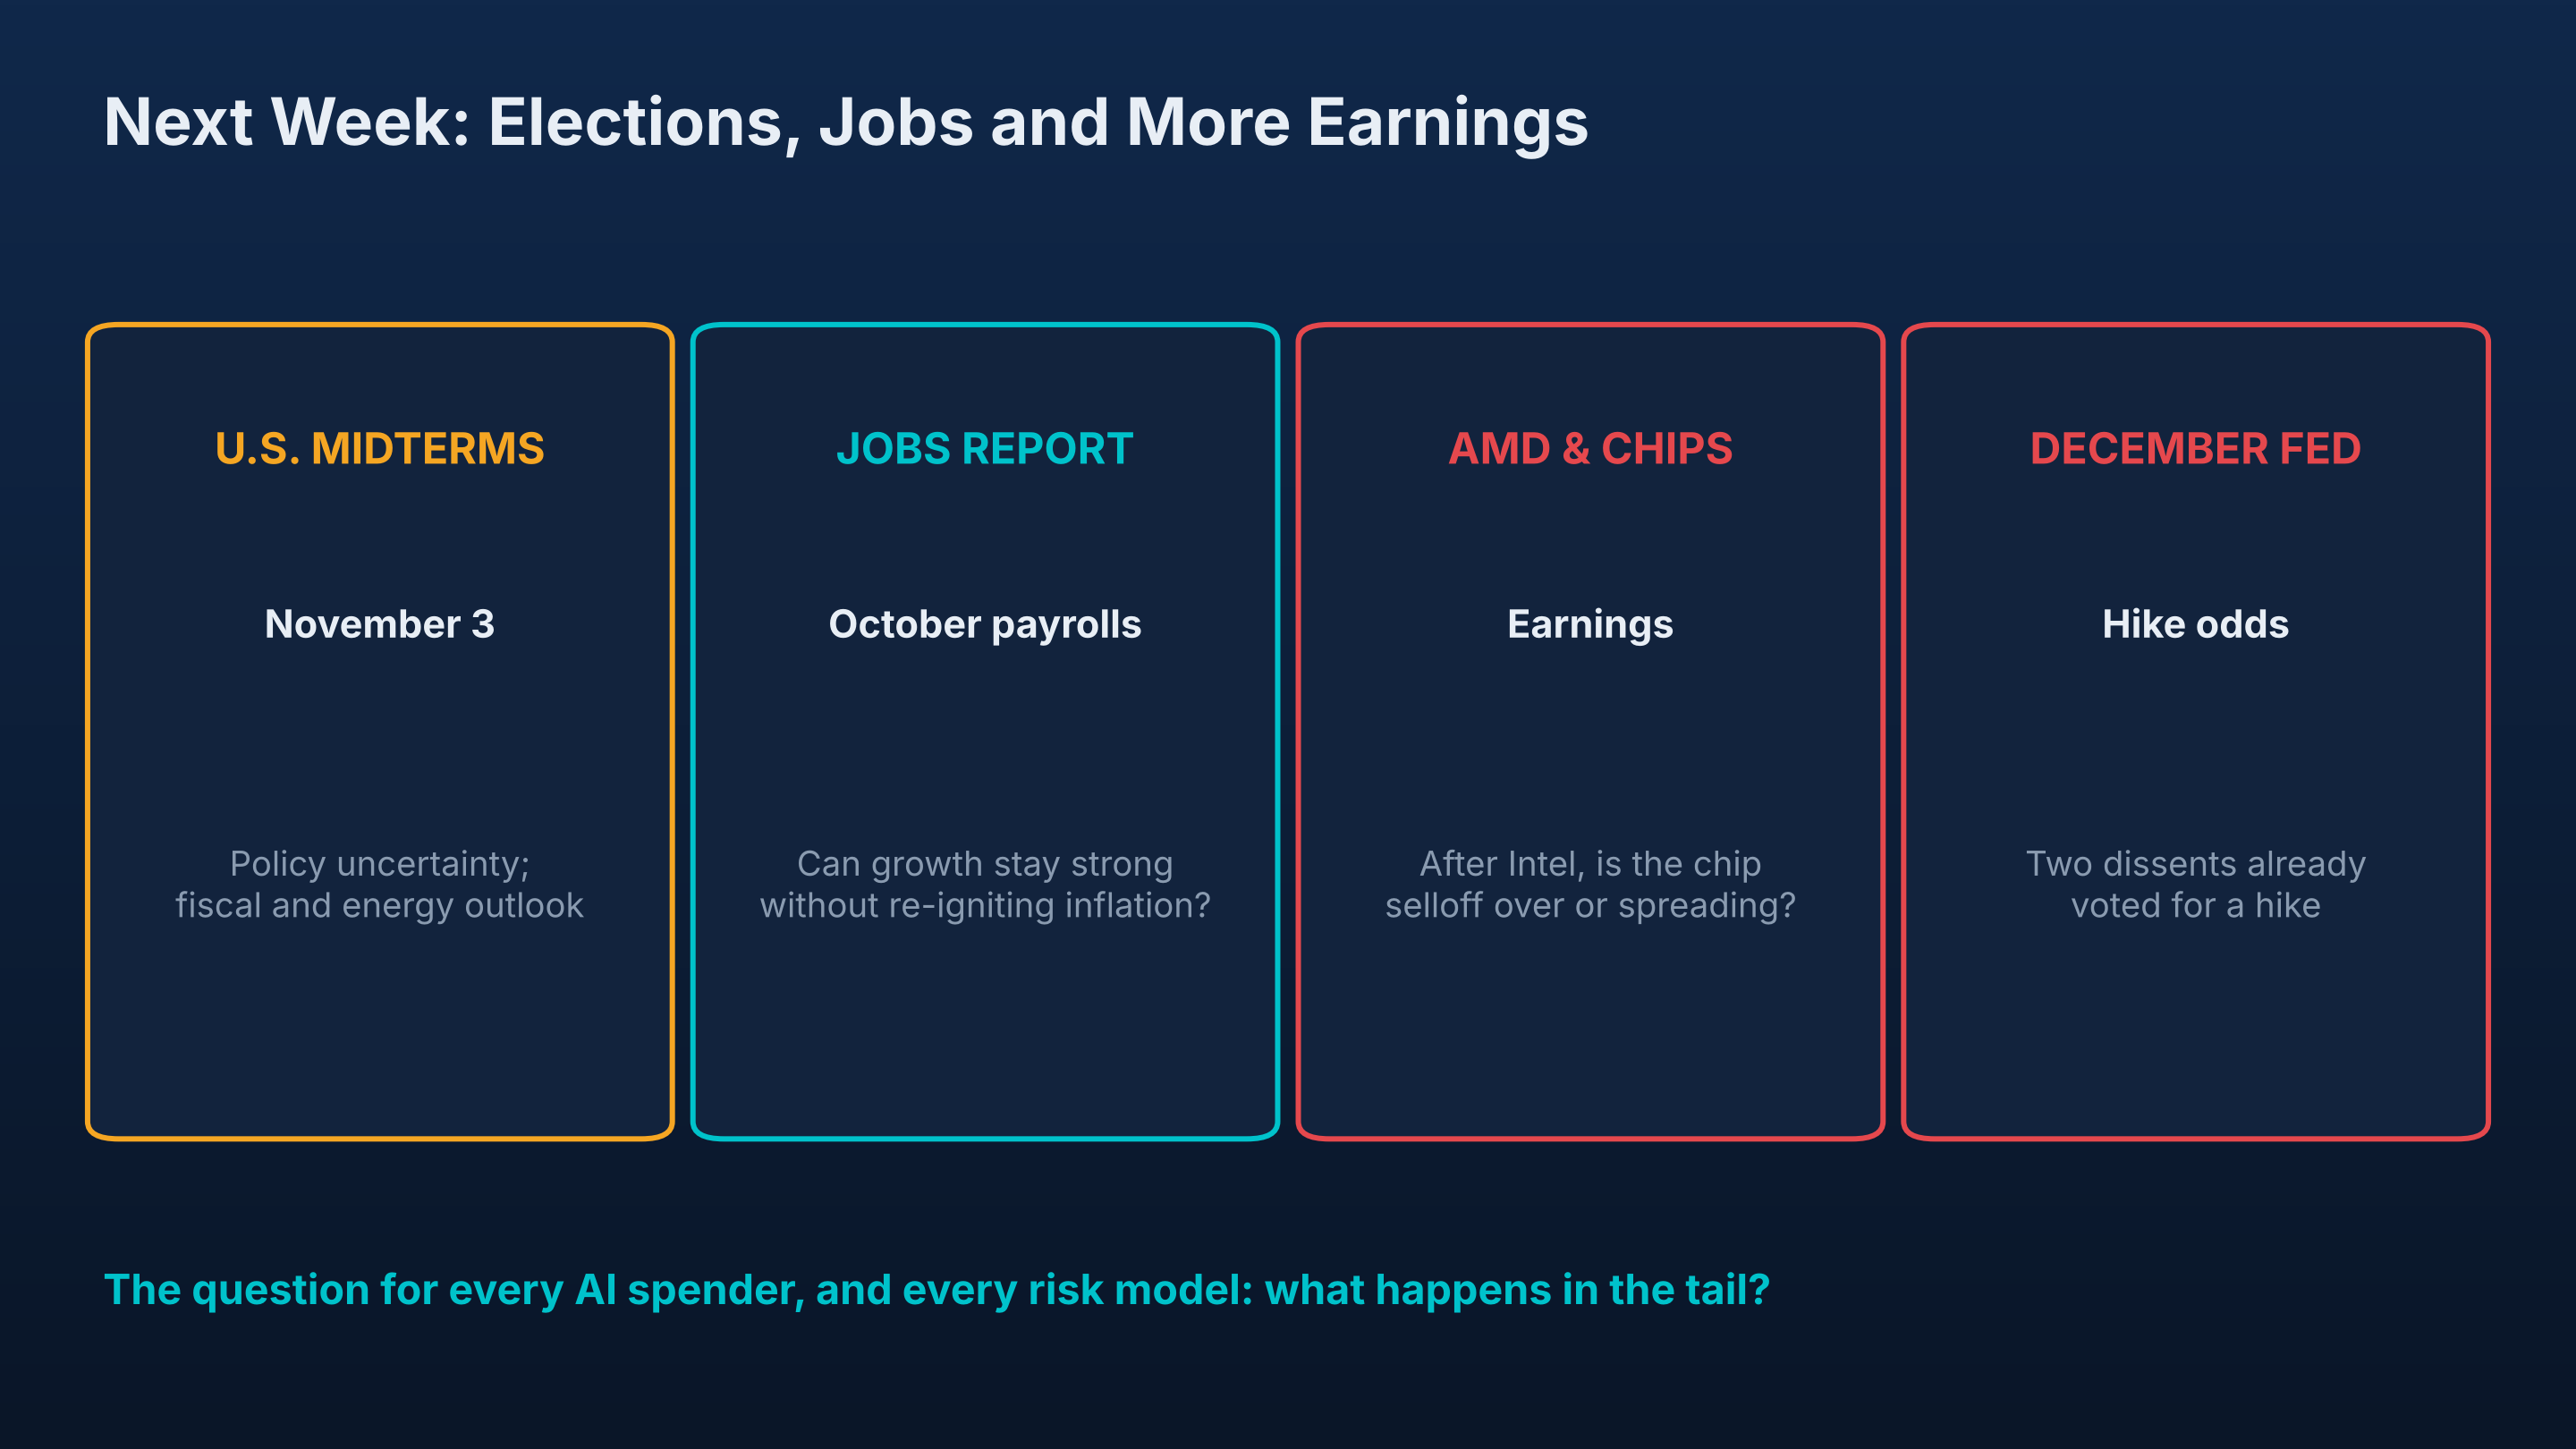
| Event | Why it matters |
|---|---|
| U.S. midterm elections, November 3 | Fiscal, energy and regulatory policy uncertainty |
| October jobs report | Can growth stay strong without re-igniting inflation? |
| AMD and other chip earnings | Is the chip selloff over, or spreading? |
| December Fed meeting | Two officials have already voted for a hike |
| Oil and the Middle East | The fastest path from geopolitics to inflation |
| AI credit markets | Watch spreads on AI-infrastructure debt as borrowing grows |
The bottom line#↑ Contents
This week, the AI trade met its reality check. Investors are no longer rewarding spending for its own sake. They want cash-flow returns, and they are separating the companies that deliver them, like Microsoft, from those still spending ahead of revenue.
Friday also delivered a reminder that risk is not shaped like the average day. Intel lost 29% in a single session, an event a normal-distribution model treats as essentially impossible and a fat-tailed model treats as rare but real. History sided with the fat tails.
Markets don't break in averages. They break in the tails. Our risk models need to be built for the tails, too.
Your take#
Is this week's selloff a healthy reset in the AI trade, or the start of a deeper repricing of AI's cost of capital? And does your risk model treat a day like Intel's Friday as possible? Share your perspective in the comments.
Read the research (all on SSRN)
When Backtests Lie: A Governance-Grade Validation Framework for Machine-Learning Value-at-Risk Models under Regime Shifts papers.ssrn.com/sol3/papers.cfm?abstract_id=7652318
Systemic Tail Episode Risk: Persistence and Cumulative Severity of Synchronized Extreme-Loss Episodes Across Markets papers.ssrn.com/sol3/papers.cfm?abstract_id=7534899
Conditional Tail Episode Risk: A Path-Dependent Framework for Extreme-Loss Episodes Beyond Value-at-Risk and Expected Shortfall papers.ssrn.com/sol3/papers.cfm?abstract_id=7502499
ML-LiqVaR: A Liquidity- and Regime-Aware, Extreme-Value-Calibrated Gradient-Boosting Value-at-Risk Model for US Equity Markets papers.ssrn.com/sol3/papers.cfm?abstract_id=7222958
Backtesting Value-at-Risk Models Under SR 11-7: A Comparative Analysis of Kupiec, Christoffersen, and Basel Traffic-Light Tests Applied to S&P 500 Returns (2018–2024) papers.ssrn.com/sol3/papers.cfm?abstract_id=7170418
All papers: SSRN author page
About the author#
Niraj Neupane, CA (ICAI), is a Quantitative Researcher at Korvane, a Financial Economist at Calderyn Institute, and the founder of Wall Street Feed. His research focuses on Value-at-Risk, tail risk and the validation of AI risk models, and is published on SSRN.
Views expressed are the author's own and are not investment advice.
Sources#
Markets
- AP via KRMG, How major US stock indexes fared Friday 10/30/2026: https://krmg.com/2026/10/30/how-major-us-stock-indexes-fared-friday-10-30-2026/
- AP via La Nación, How major US stock indexes fared Monday 10/26/2026: https://www.lanacion.com.ar/usa/how-major-us-stock-indexes-fared-monday-10262026-nid26102026/
- TheStreet, Stock Market Today (Oct. 30, 2026): https://www.thestreet.com/stock-market-today/stock-market-today-dow-jones-sp-500-nasdaq-updates-oct-30-2026
- Yahoo Finance, Markets News, Oct. 30, 2026: https://finance.yahoo.com/markets/stocks/articles/stock-market-today-nasdaq-p-123540419.html
Fed and economy
- Wolf Street, Fed holds rates, but with 2 dissenters (Oct 28, 2026): https://wolfstreet.com/2026/10/28/fed-holds-rates-but-with-2-dissenters-a-hold-before-the-election-was-expected-dissenters-were-not/
- Lane Report, U.S. GDP grows 3.4% in third quarter of 2026: https://www.lanereport.com/190312/2026/10/us-gdp-growth-third-quarter-2026/
- SimianX, The latest PCE inflation numbers: https://www.simianx.ai/stories/pce-inflation-report-latest-data-and-release-schedule
Companies
- Intel Q3 2026 earnings call transcript via Investing.com: https://www.investing.com/news/transcripts/earnings-call-transcript-intel-beats-q3-2026-estimates-but-stock-sinks-93CH-4985498
- FinanceFeeds, Intel stock at $65.76 after 28.6% drop: https://financefeeds.com/intel-intc-stock-65-76-saturday-after-28-6-percent-drop-week-ahead-amd-3-november-bull-79-bear-58/
- PrimeXBT, Alphabet shares fall 10% after Q3 miss: https://primexbt.com/news/alphabet-shares-fall-10-after-q3-miss-as-2026-capex-holds-and-2027-spending-set/
- AI Weekly, Microsoft Q1 revenue hits $92.3B, Azure up 48%: https://aiweekly.co/alerts/microsoft-q1-revenue-hits-923b-azure-up-48-as-capex-jumps-to-394b-with-175b
- Amazon, Third quarter 2026 results: https://ir.aboutamazon.com/news-release/news-release-details/2026/Amazon-com-Announces-Third-Quarter-Results/
- Crypto Briefing, Meta posts first negative free cash flow in over a decade: https://cryptobriefing.com/meta-negative-free-cash-flow-ai-spending/
Methodology
- Basel Committee on Banking Supervision (2019). Minimum Capital Requirements for Market Risk (Fundamental Review of the Trading Book).