
MARKETS · DIVERSIFICATION · CORRELATION · LIQUIDITY · TAIL RISK
By Niraj Neupane, CA (ICAI) Quantitative Researcher, Korvane · Financial Economist, Calderyn Institute · Founder, Wall Street Feed
The week by the numbers#↑ Contents
| −8.9% | Gold, to about $3,538, a 14-month low |
| −36.7% | Gold below its January 28 record of $5,589 |
| −7.9% | Bitcoin, to about $59,000, its seventh straight weekly decline |
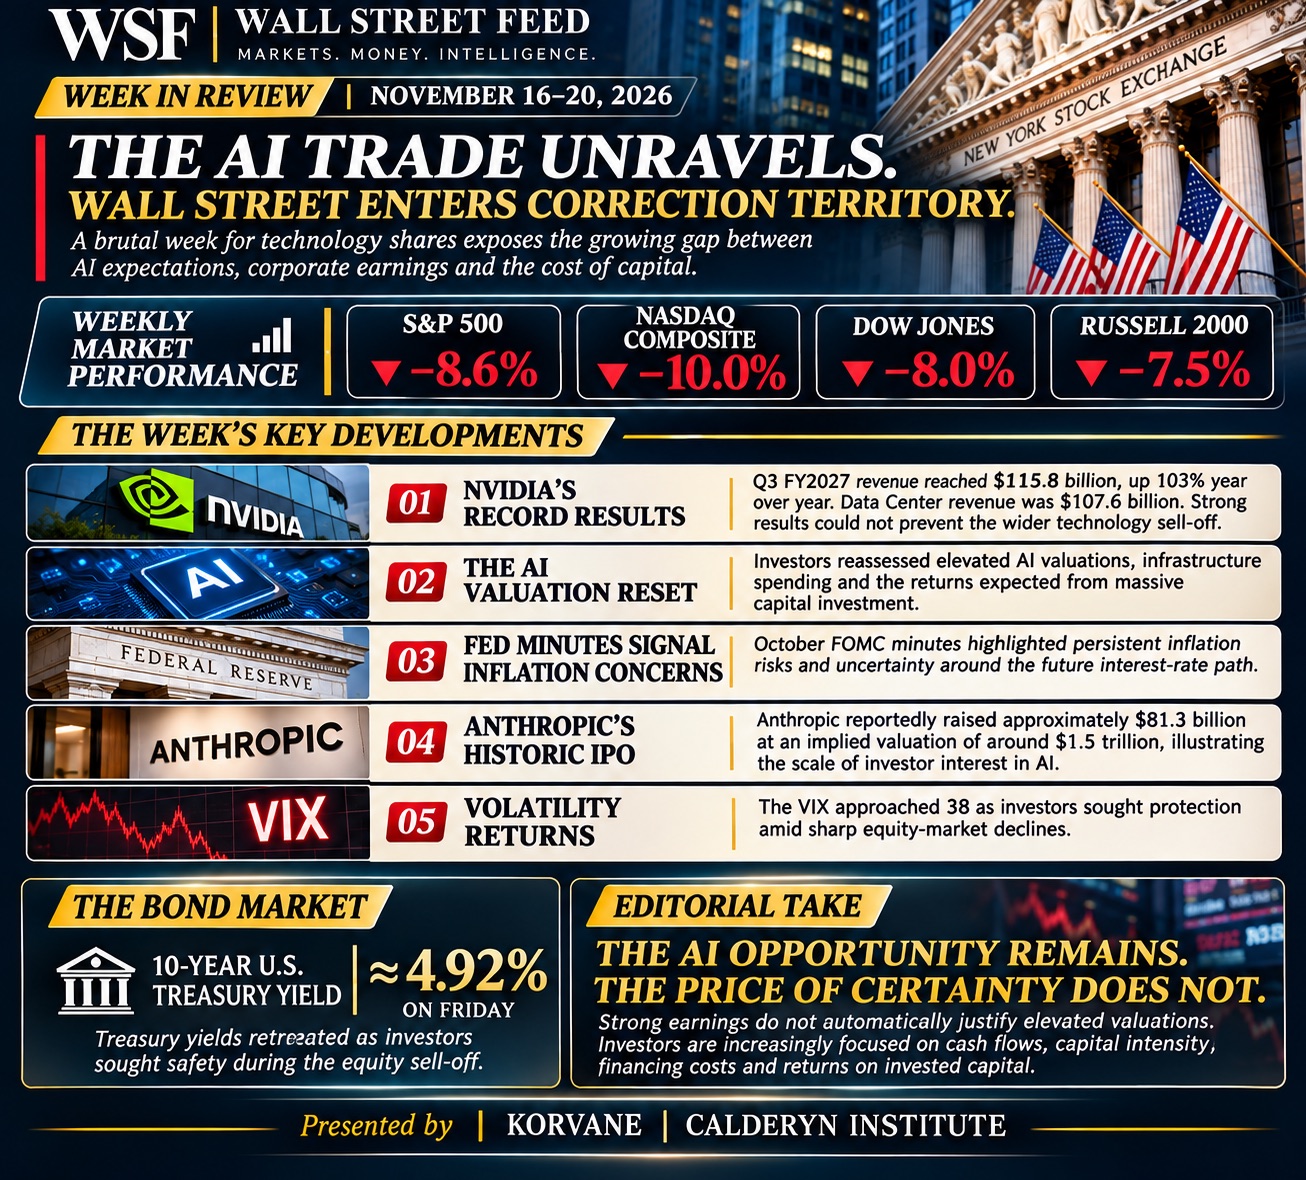
| −8.6% | S&P 500, to 6,910.39, a correction |
| −17% | Taiwanese equities for the week |
| −23bp | 10-year Treasury yield, to 4.92%: the only hedge that worked |
| ≈ −4.4% | Illustrative 60/40 stock–bond portfolio |
| ≈ −7.5% | Illustrative "modern" portfolio with gold and Bitcoin |
Key takeaways
What happened. As AI stocks collapsed, investors sold what they could, not what they wanted to. Gold and Bitcoin, both marketed as protection, fell with stocks. Only Treasuries rallied.
Why. Three forces lined up: margin calls that forced liquidation, a Fed still leaning toward a December hike, and "hedges" that had themselves become crowded trades.
What it means. Diversification measured in calm markets overstates the protection a portfolio has in stress. When correlations rise toward one, ten assets behave like one bet, and the same portfolio carries roughly 50% more risk without any single asset becoming more volatile.
What the research says. My papers on systemic tail risk and Expected Shortfall show this is not a one-week anomaly. Synchronized crashes are more severe than standard risk models measure, and every asset class, including the "safe" ones, has its tail understated in stress.
What's in this report#
- The week by the numbers
- 1. Seven assets, one direction
- 2. Why gold failed
- 3. Why Bitcoin failed
- 4. Why Treasuries worked, this time
- 5. The diversification math
- 6. What the research shows
- 7. What investors and risk managers should take from this
- 8. The case against my reading
- 9. What to watch
- The bottom line
1. Seven assets, one direction#↑ Contents

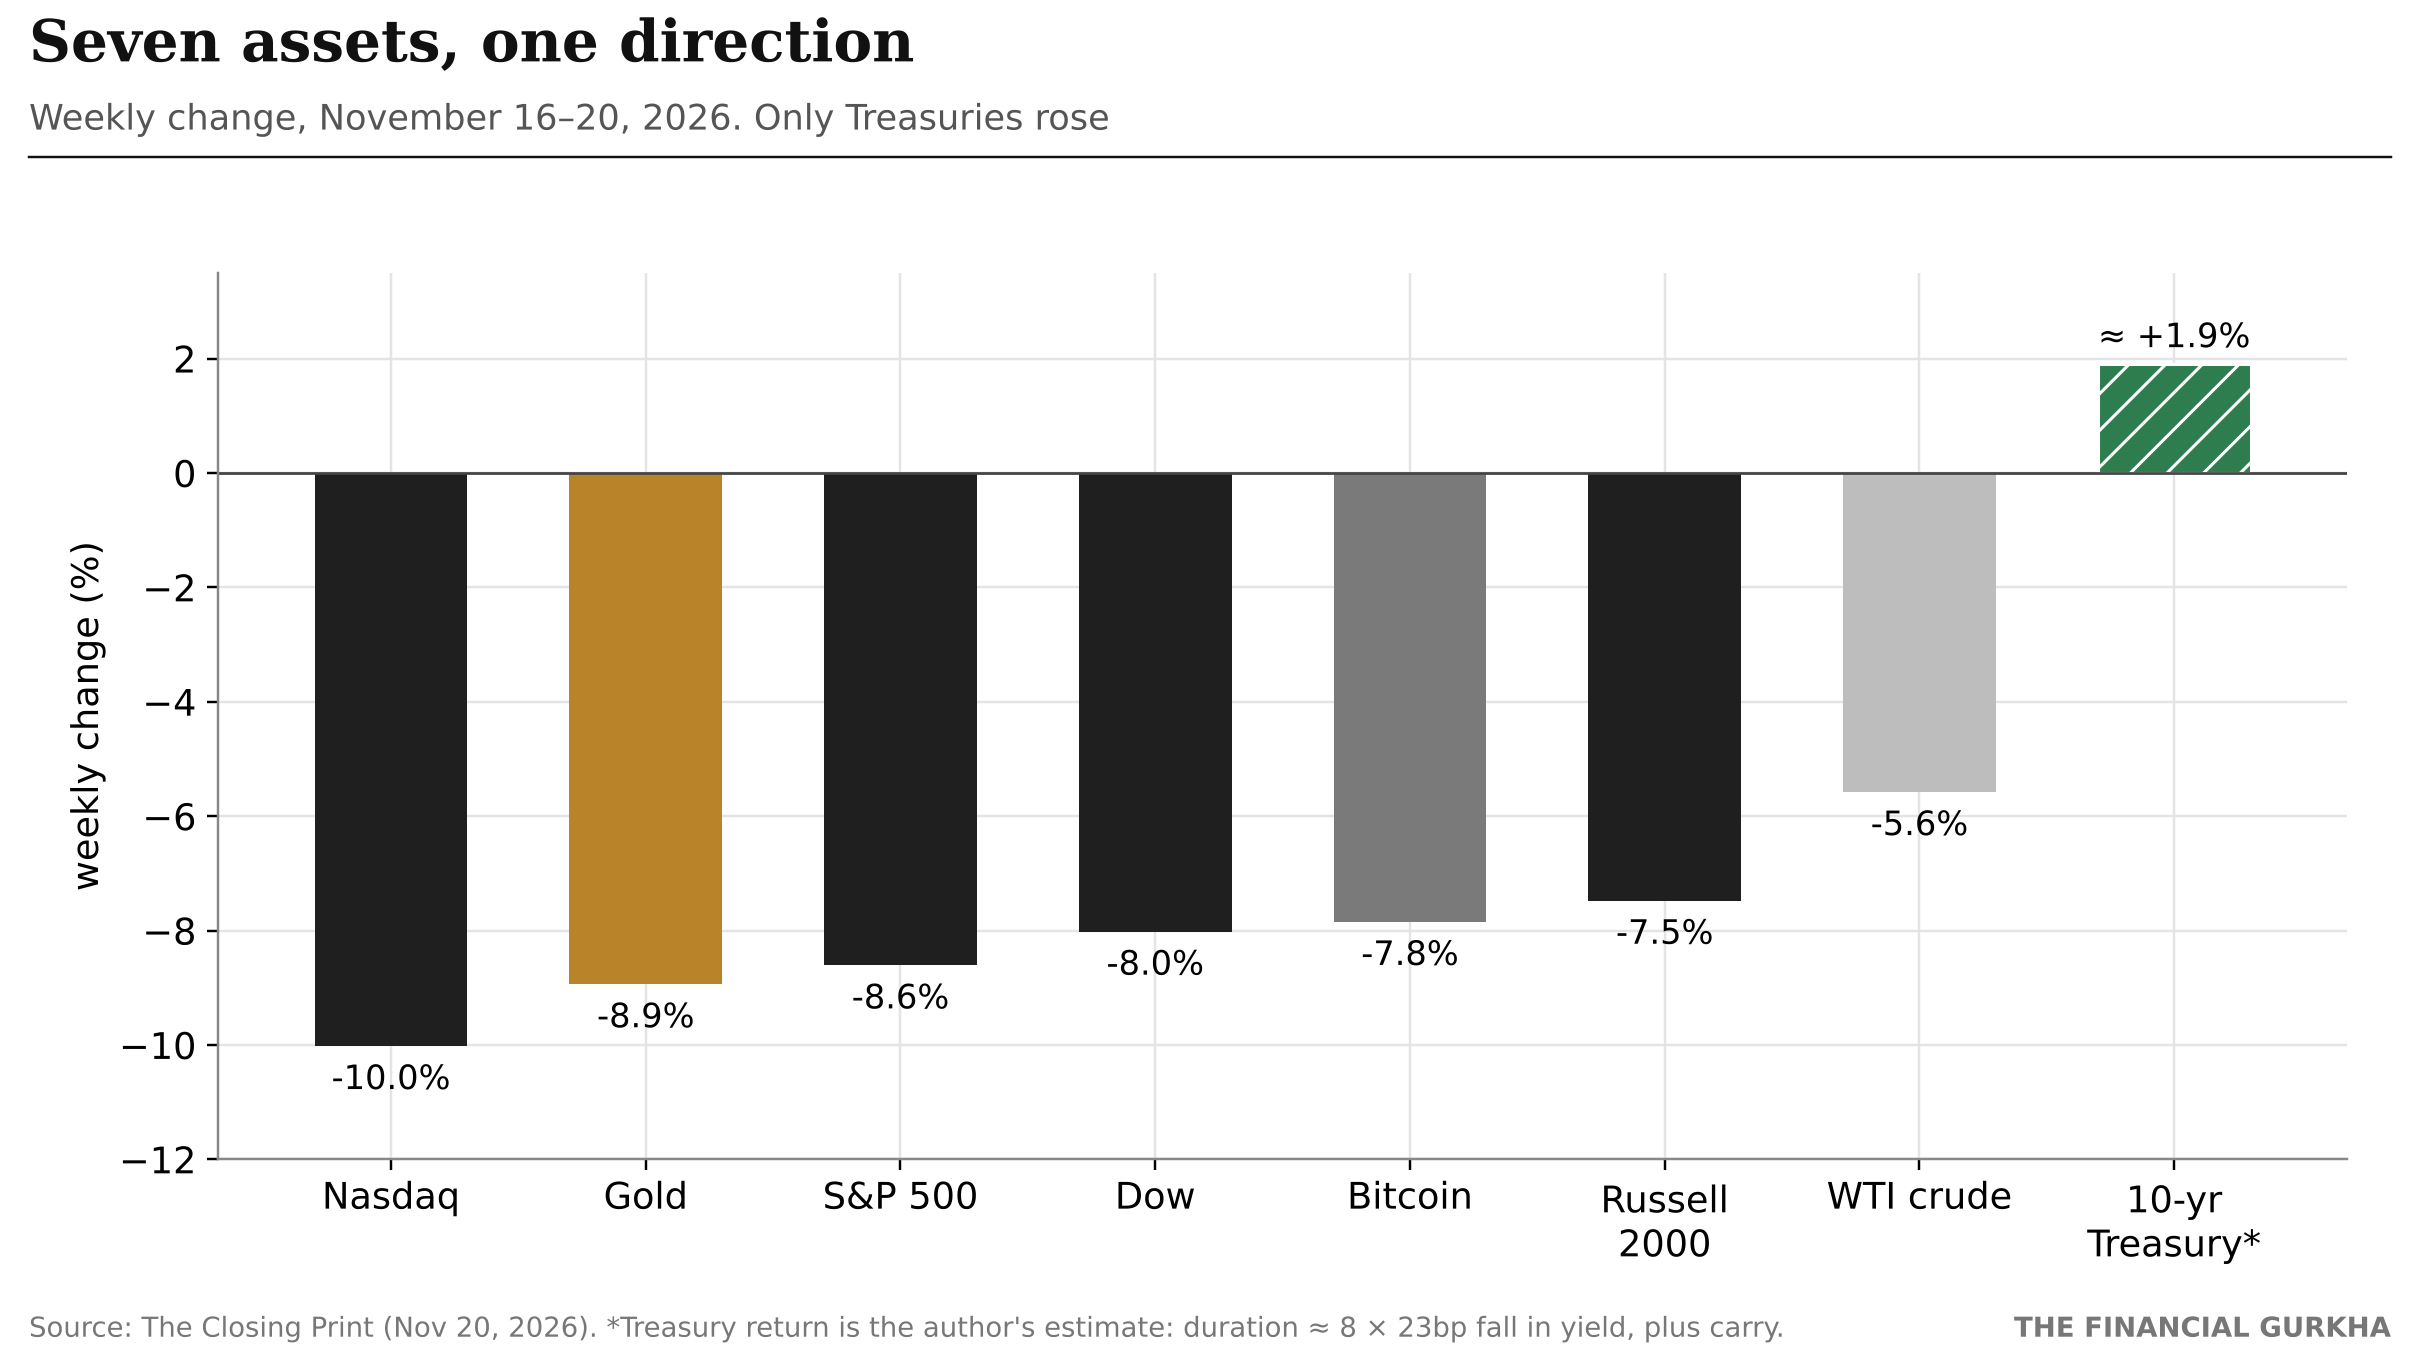
| Weekly change, Nov 16–20 | Normal role in a portfolio | |
|---|---|---|
| Nasdaq Composite | −10.0% | Growth |
| Gold | −8.9% | Safe haven |
| S&P 500 | −8.6% | Core equity |
| Dow | −8.0% | Core equity |
| Bitcoin | −7.9% | "Digital gold" / uncorrelated asset |
| Russell 2000 | −7.5% | Small caps |
| WTI crude | −5.6% | Inflation hedge |
| 10-year Treasury | ≈ +1.9% (yield −23bp) | Safe haven |
Treasury return is the author's estimate: about 8 years of duration × a 23bp fall in yield, plus carry.
On Friday alone, the S&P 500 fell 3.7%, spot gold fell about 2.4% to its lowest level in more than 14 months, and Bitcoin dropped about 5% to near $59,000. Outside the U.S., Taiwanese equities fell about 17% for the week.
Of the assets most investors hold for protection, one in three worked. Gold and Bitcoin, which together account for a growing share of "alternative" allocations, moved with stocks. Treasuries were the only asset that did its job.
2. Why gold failed#↑ Contents

Gold is supposed to rise when stocks fall. This week it fell more than stocks. Three forces explain it.
Force 1: forced liquidation#
When leveraged investors lose money on one position, brokers demand more collateral: a margin call. The fastest way to raise cash is to sell what is liquid and still has gains, and after a 65% rally in 2025, gold had plenty of both.
Analysts were direct about this. "There seems to be a bit of forced liquidation going on across the market in general," said Kyle Rodda, senior financial market analyst. Tim Seymour put it more bluntly on CNBC: "I think it's a funding trade right now. People are probably selling it to settle margin calls." Investing.com reported that gold futures had their worst week since March 2020, the last time a market panic forced investors to sell everything at once.
In a liquidity crisis, an asset's job changes. It stops being a hedge and becomes a source of cash.
Force 2: rates#
Gold pays no interest. When markets price a near-certain December rate hike, the cost of holding a non-yielding asset rises. The Fed minutes released Wednesday showed some officials open to a hike larger than 25 basis points.
Force 3: the hedge was already a crowded trade#
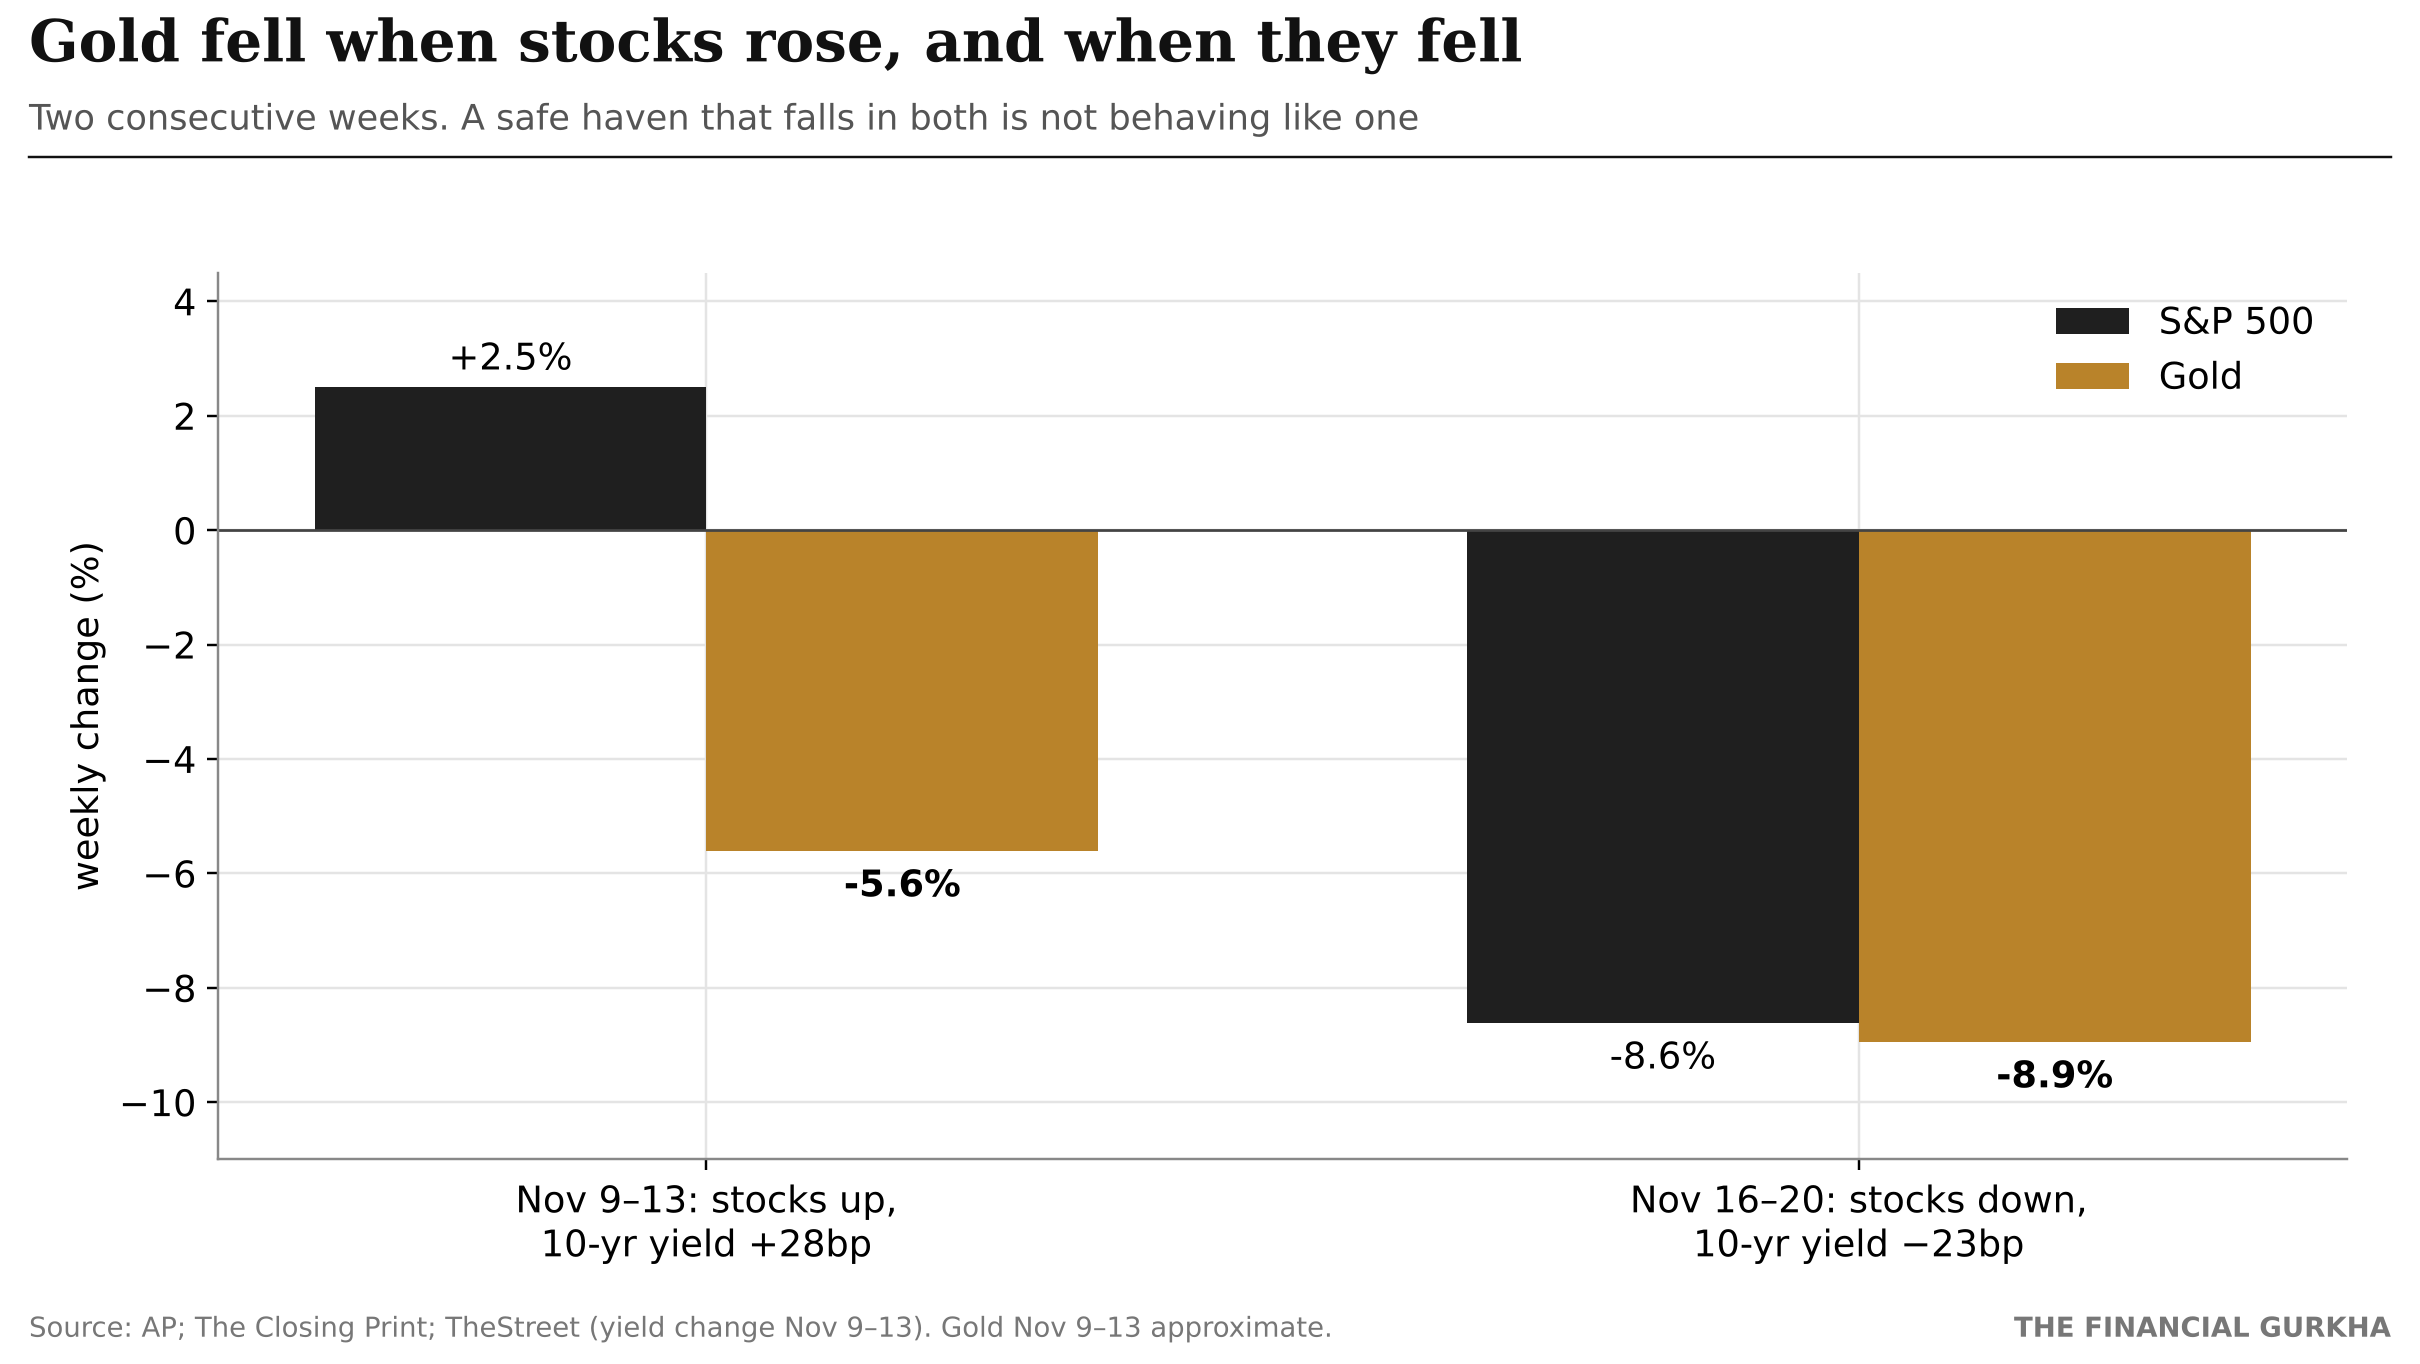
| Week | S&P 500 | Gold | 10-year yield |
|---|---|---|---|
| Nov 9–13 | +2.5% | ≈ −5.6% | +28bp |
| Nov 16–20 | −8.6% | −8.9% | −23bp |
This is the detail that matters most. Gold fell in the week stocks rose, and again in the week stocks fell. A true safe haven does not fall in both.
Gold peaked at $5,589 on January 28. By Friday it was nearly 37% below that record and down 13.4% over the past year. Its decline began months before this month's margin calls. A hedge that is already in a downtrend, with investors leaving and ETF outflows building, offers little protection in a panic: it simply joins the selling.
The lesson: an asset's correlation to stocks is not a fixed property. It depends on who owns it, how much leverage sits behind it, and what kind of shock arrives.
3. Why Bitcoin failed#↑ Contents

Bitcoin has been marketed for years as "digital gold", a store of value outside the financial system. This week it behaved like a leveraged technology stock.
| Bitcoin | |
|---|---|
| Weekly change | −7.9%, to about $59,000 |
| Losing streak | Seven straight weekly declines |
| U.S. spot Bitcoin ETF outflows | $1.28B (Nov 2–6) and $1.07B (Nov 9–13) |
| Technical level | Fell below its 200-week moving average, near $68,000 |
The reason is ownership. Since spot Bitcoin ETFs launched, Bitcoin has increasingly been held by the same institutions and advisers who own technology stocks, often in the same accounts and often for the same reason: a bet on technological change. When those accounts need to cut risk, Bitcoin is sold alongside Nvidia, not against it.
That is not a criticism of Bitcoin as an asset. It is a statement about its correlation regime: in calm markets it can look uncorrelated, and in stress it moves with the riskiest parts of the equity market.
4. Why Treasuries worked, this time#↑ Contents
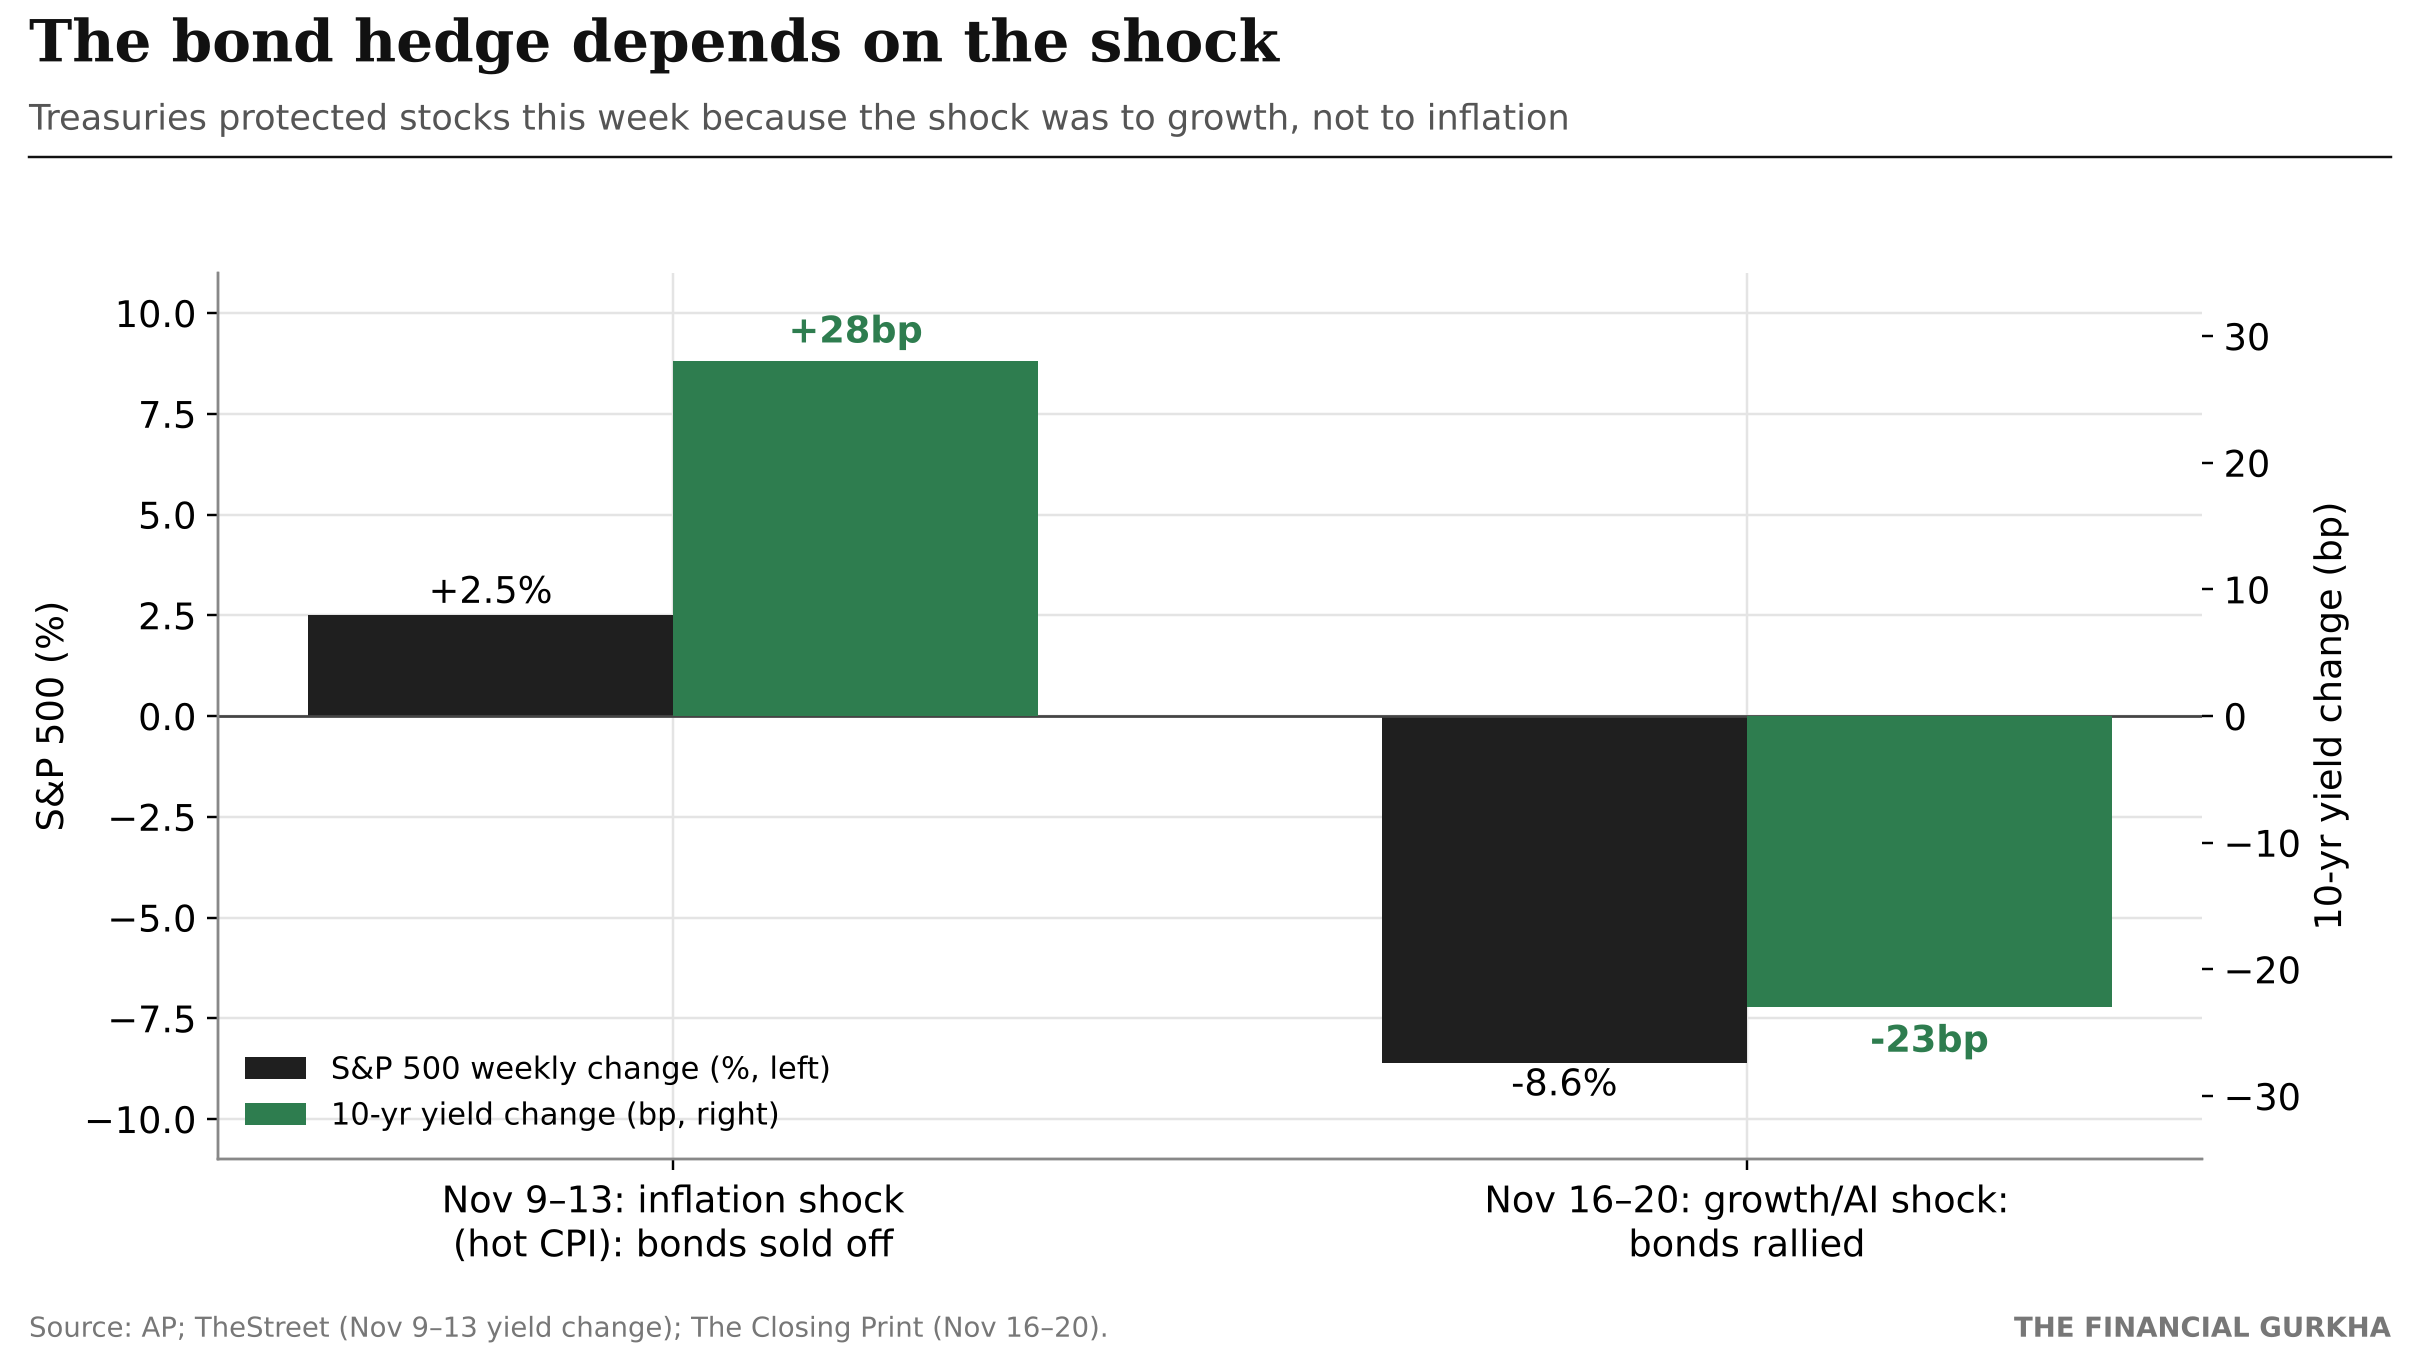
| Week | Type of shock | S&P 500 | 10-year yield | Did bonds hedge? |
|---|---|---|---|---|
| Nov 9–13 | Inflation (hot CPI) | +2.5% | +28bp (prices fell) | No |
| Nov 16–20 | Growth / AI | −8.6% | −23bp (prices rose) | Yes |
Treasuries were the week's only working hedge. But look at the week before. When the shock was inflation, with hotter-than-expected consumer prices, yields rose 28 basis points and bond prices fell. If stocks had dropped that week, bonds would not have protected them.
The stock–bond hedge depends on the kind of shock:
- Growth or risk shock (like this week): investors buy safety, yields fall, bonds protect stocks.
- Inflation shock (like the week before): yields rise, bond prices fall, and both lose together, as in 2022.
With the Fed still leaning toward a hike and producer prices up 6.5% year over year, the next shock could be either kind. A portfolio that relies on Treasuries as its only hedge is making a bet on which kind arrives.
5. The diversification math#↑ Contents
This is where the week becomes a lesson for every portfolio, not just a market story.
5.1 What different portfolios lost this week#
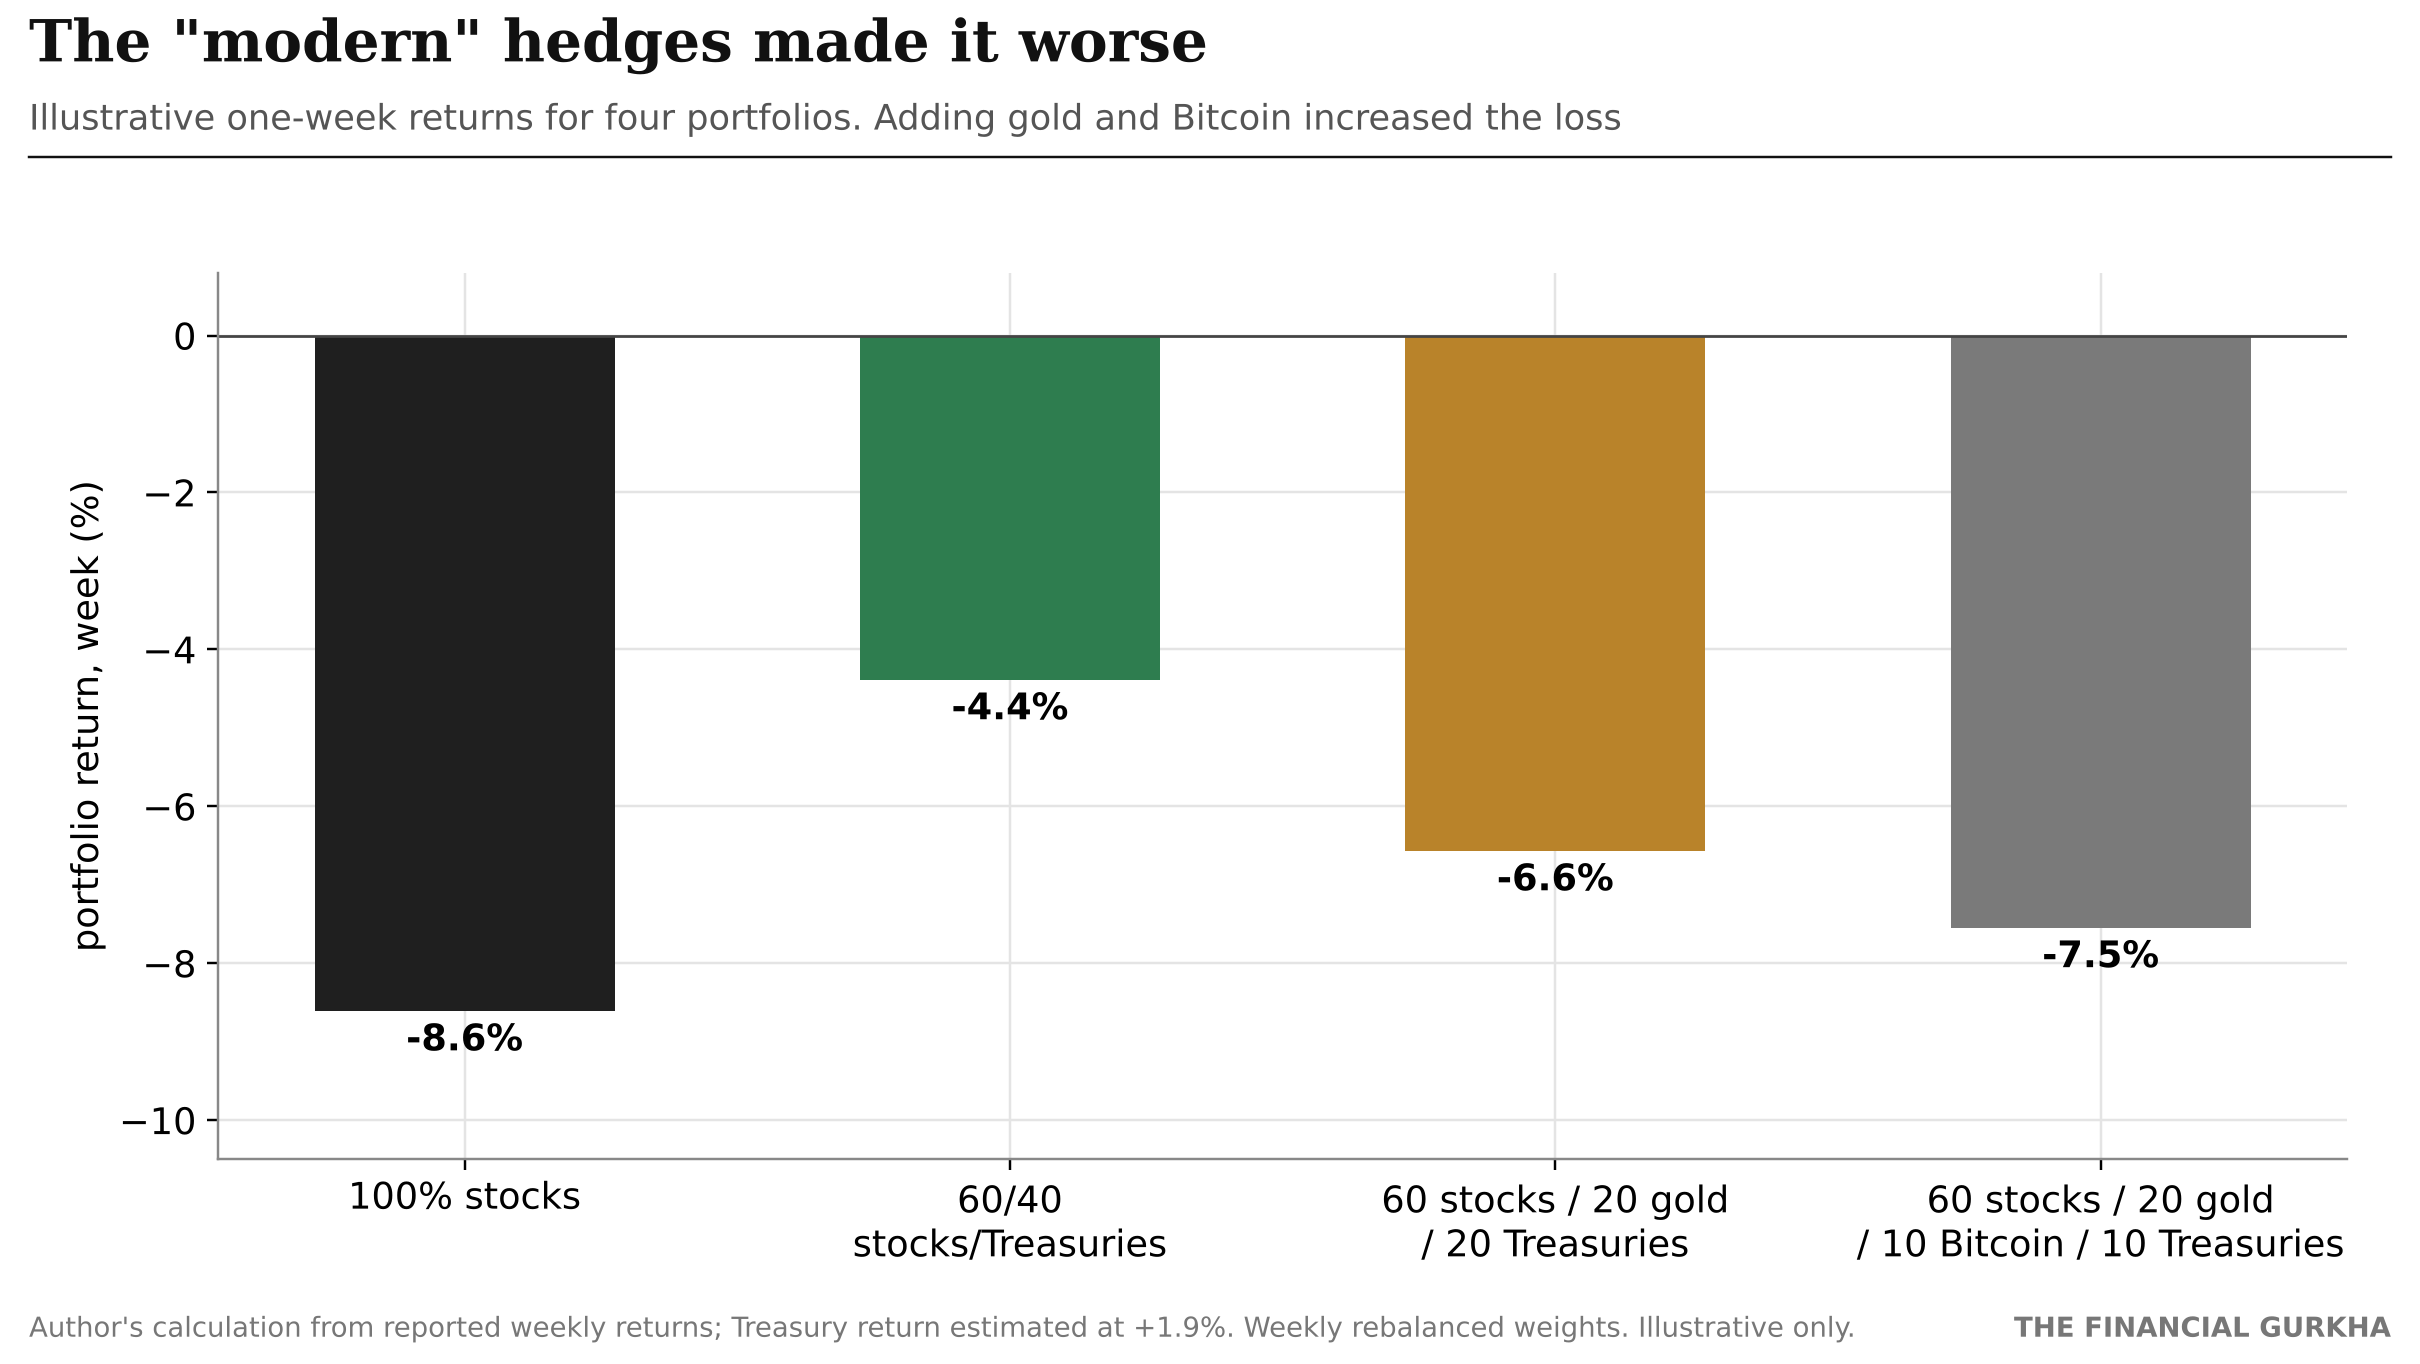
| Portfolio | Weekly return |
|---|---|
| 100% stocks (S&P 500) | −8.6% |
| 60% stocks / 40% Treasuries | ≈ −4.4% |
| 60% stocks / 20% gold / 20% Treasuries | ≈ −6.6% |
| 60% stocks / 20% gold / 10% Bitcoin / 10% Treasuries | ≈ −7.5% |
Author's illustrative calculation from reported weekly returns; Treasury return estimated at +1.9%. Not investment advice.
The traditional 60/40 portfolio cut the loss roughly in half. Replacing part of the bond allocation with gold and Bitcoin, the "modern" diversifiers, made the loss worse, not better. The portfolio with the most "alternative" exposure lost almost as much as stocks alone.
5.2 Ten assets, one bet#
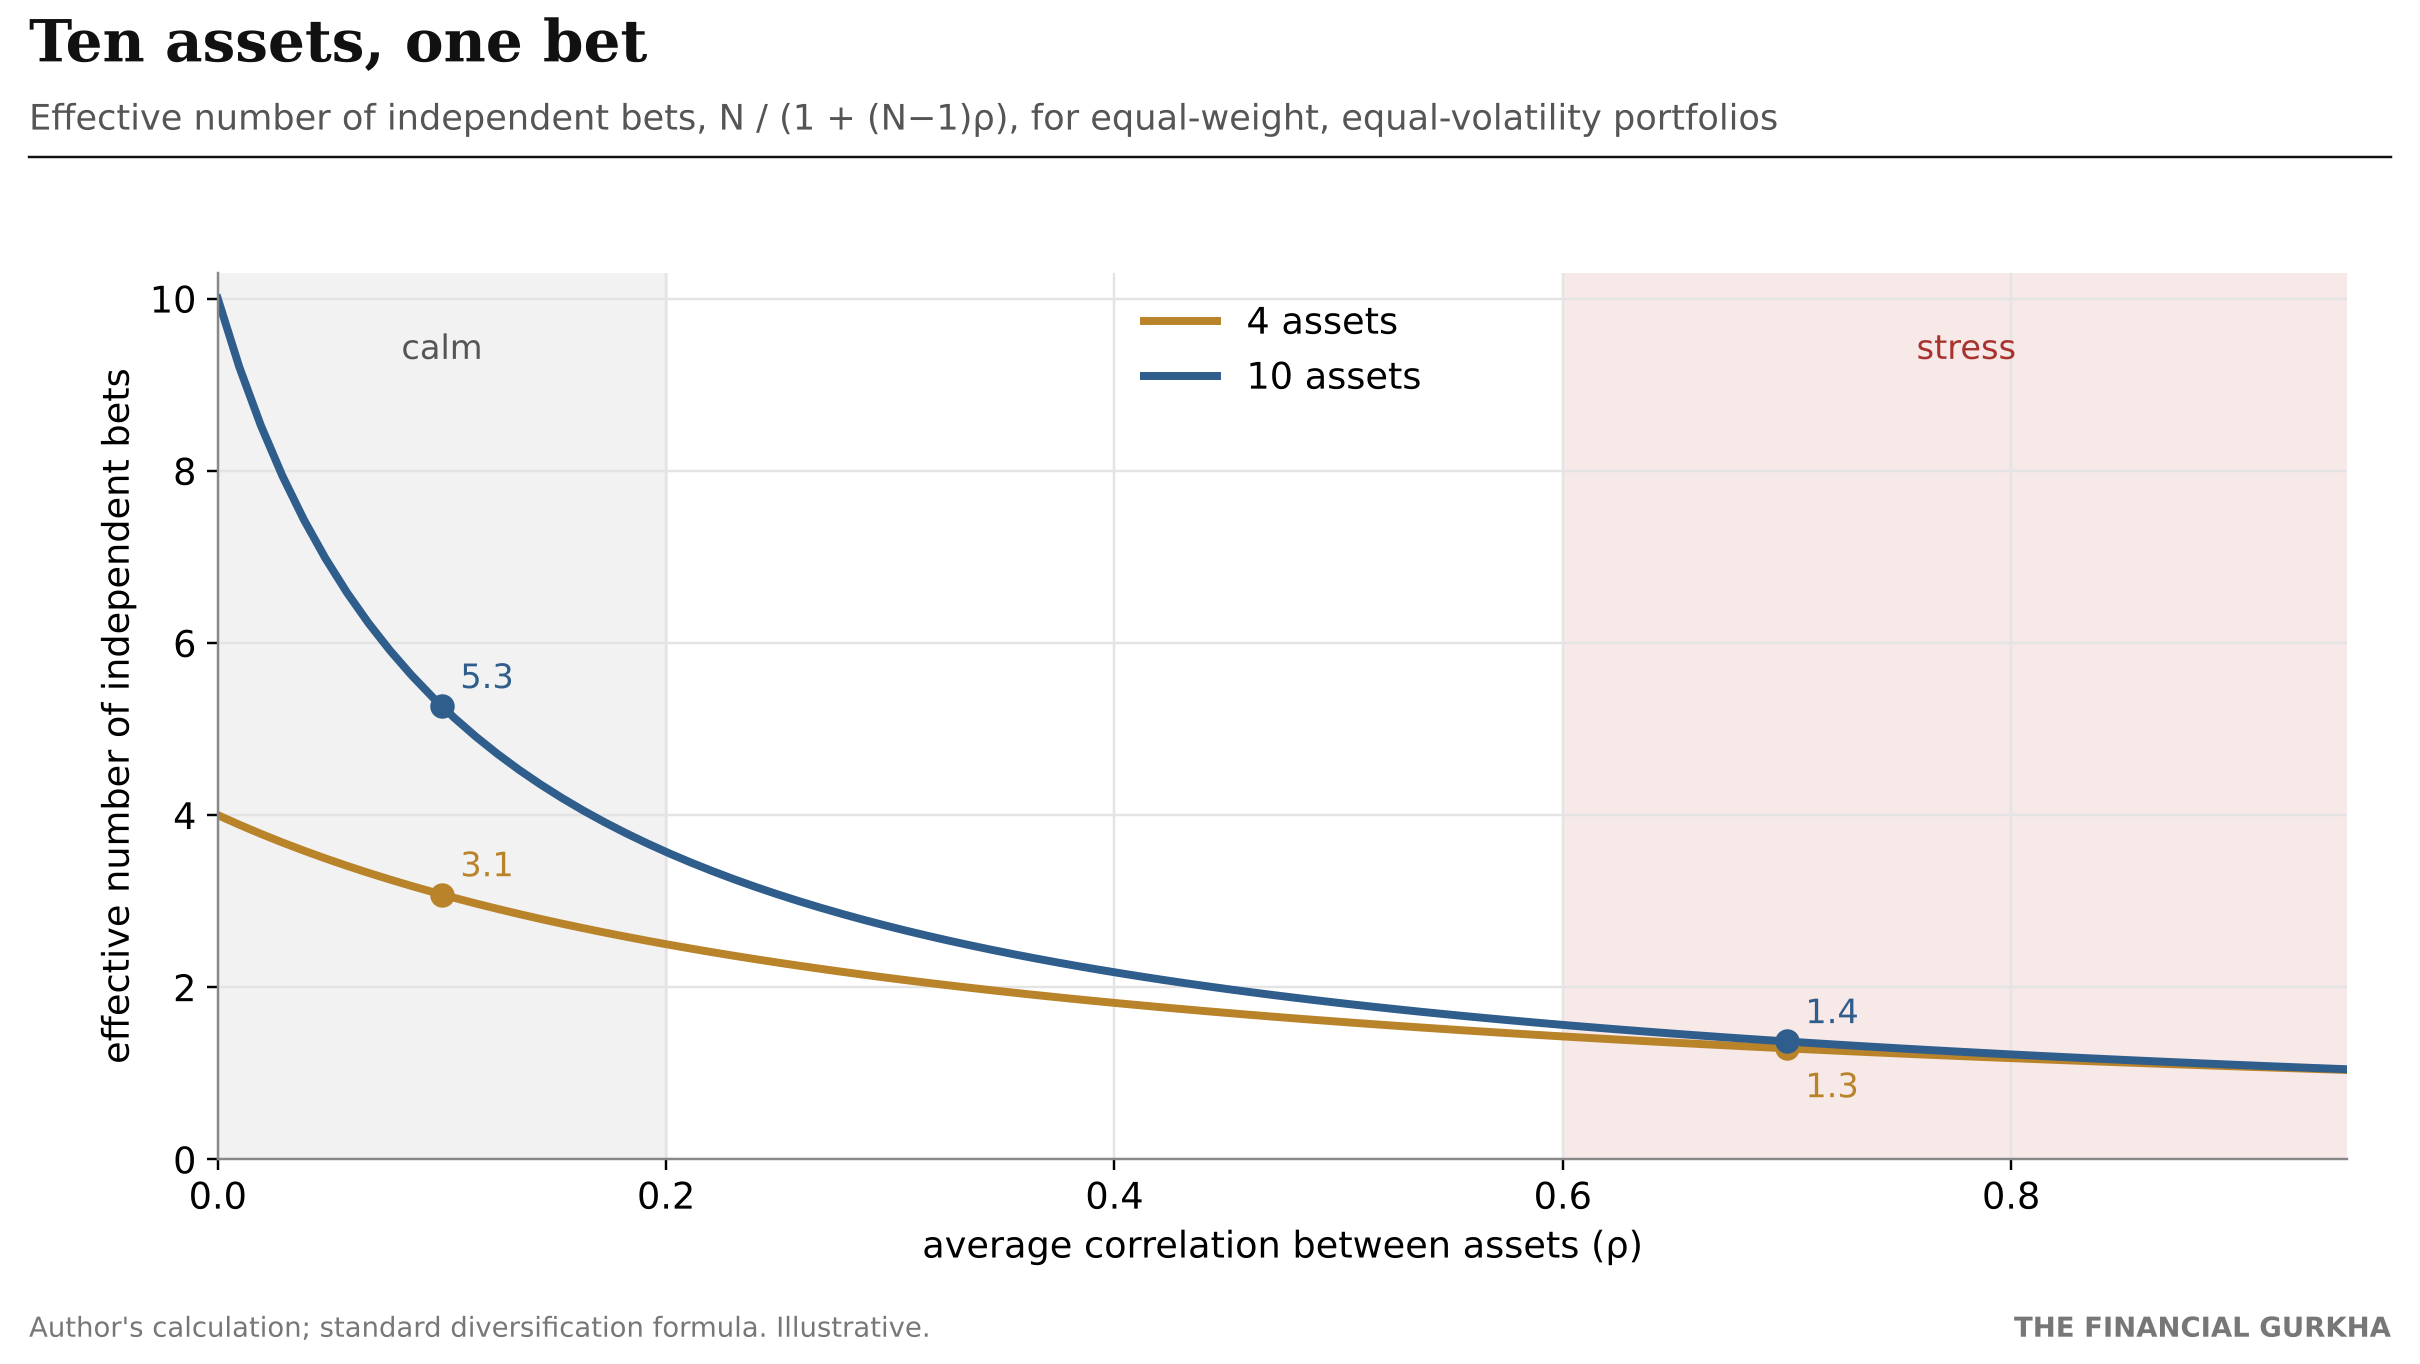
The reason is a simple formula. For a portfolio of N assets with equal weights and equal volatility, the effective number of independent bets is:
N_eff = N ÷ (1 + (N − 1) × ρ), where ρ is the average correlation between the assets.
| Average correlation (ρ) | 4 assets | 10 assets |
|---|---|---|
| 0.0 | 4.0 | 10.0 |
| 0.1 (calm) | 3.1 | 5.3 |
| 0.3 | 2.1 | 2.7 |
| 0.5 | 1.6 | 1.8 |
| 0.7 (stress) | 1.3 | 1.4 |
| 0.9 | 1.1 | 1.1 |
In a calm market with low correlations, a 10-asset portfolio behaves like five independent bets. In a stressed market where correlations rise to 0.7, the same 10 assets behave like 1.4 bets. Adding more assets barely helps, because they are all being driven by the same thing: the need for cash.
5.3 Same assets, same volatility, 54% more risk#
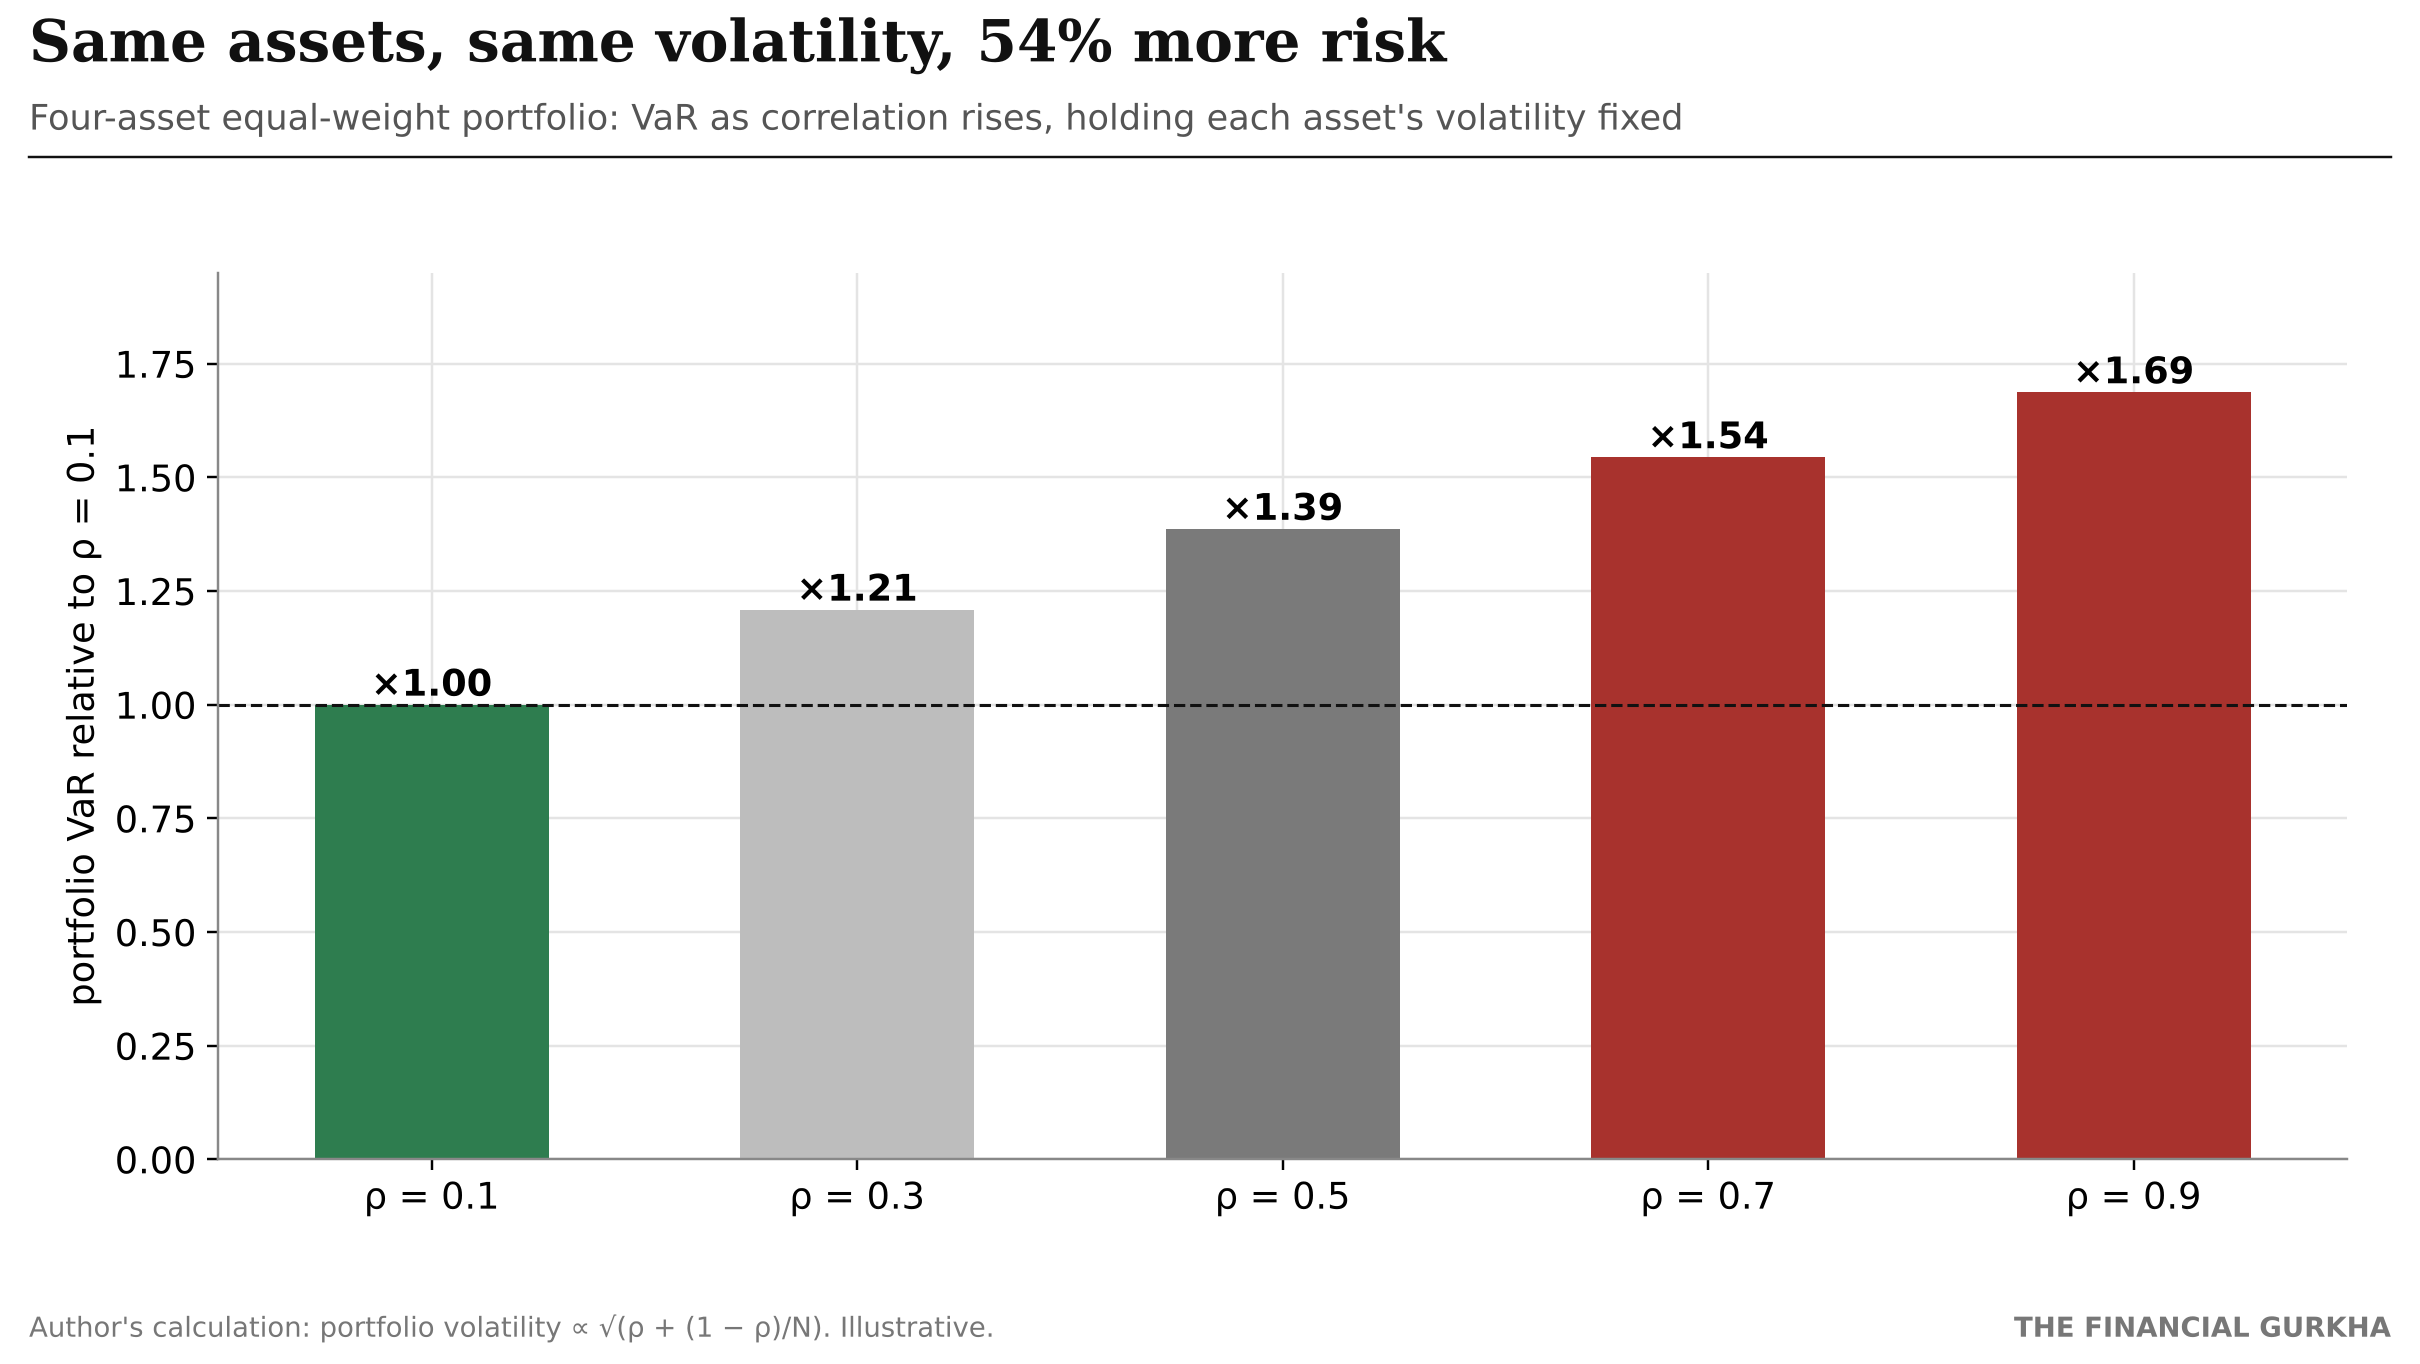
Portfolio volatility, and therefore Value-at-Risk, rises with correlation even if no individual asset becomes more volatile:
σ_portfolio = σ × √(ρ + (1 − ρ) ÷ N)
| Four-asset portfolio | VaR relative to ρ = 0.1 |
|---|---|
| ρ = 0.1 | ×1.00 |
| ρ = 0.3 | ×1.21 |
| ρ = 0.5 | ×1.39 |
| ρ = 0.7 | ×1.54 |
| ρ = 0.9 | ×1.69 |
Author's calculation, illustrative.
A risk system that measures correlations over a calm window will report the ρ = 0.1 number. The portfolio actually carries the ρ = 0.7 risk. The gap is 54%, and it appears exactly in the week the portfolio is being tested. In practice it is worse, because individual volatilities also rise in stress.
6. What the research shows#↑ Contents
This week is a textbook example of what my research has been measuring for the past year: tail risk that is synchronized across markets, and models that understate it in stress.
6.1 Synchronized crashes are worse than they look: STER#
My paper Systemic Tail Episode Risk (STER) studies extreme-loss episodes that hit several markets at once. It measures three things a standard risk report does not:
- Breadth: how many markets are in a tail event at the same time.
- Persistence: how long the episode lasts.
- Cumulative severity: the total damage over the whole episode, not just the worst day.
The key finding: when assets become more likely to crash together, the cumulative severity of synchronized stress episodes rises by about 45% in simulation, while standard portfolio VaR barely moves. In other words, the risk measure most institutions report is least sensitive to the risk that hurt them most this week.
Applying the STER lens to the past three weeks (a qualitative reading; I have not computed realized values):
| STER dimension | Evidence | Reading |
|---|---|---|
| Breadth | U.S. equities, gold, Bitcoin, oil and Taiwan all fell 5%–17% in one week | High |
| Persistence | Three AI shocks in three weeks (Nov 5 crash, Nov 12 CEO exit, Nov 20 correction); Bitcoin down seven weeks running | Building |
| Safe-haven channel | Treasuries rallied; the stock–bond hedge held | Intact |
| Overall | Systemic in breadth, not yet in the bond market |
That last line is the one to watch. If Treasuries start falling with stocks, as they did in 2022, the episode becomes fully systemic, and the last working hedge disappears.
6.2 Every asset's tail is understated in stress, including the "hedges"#
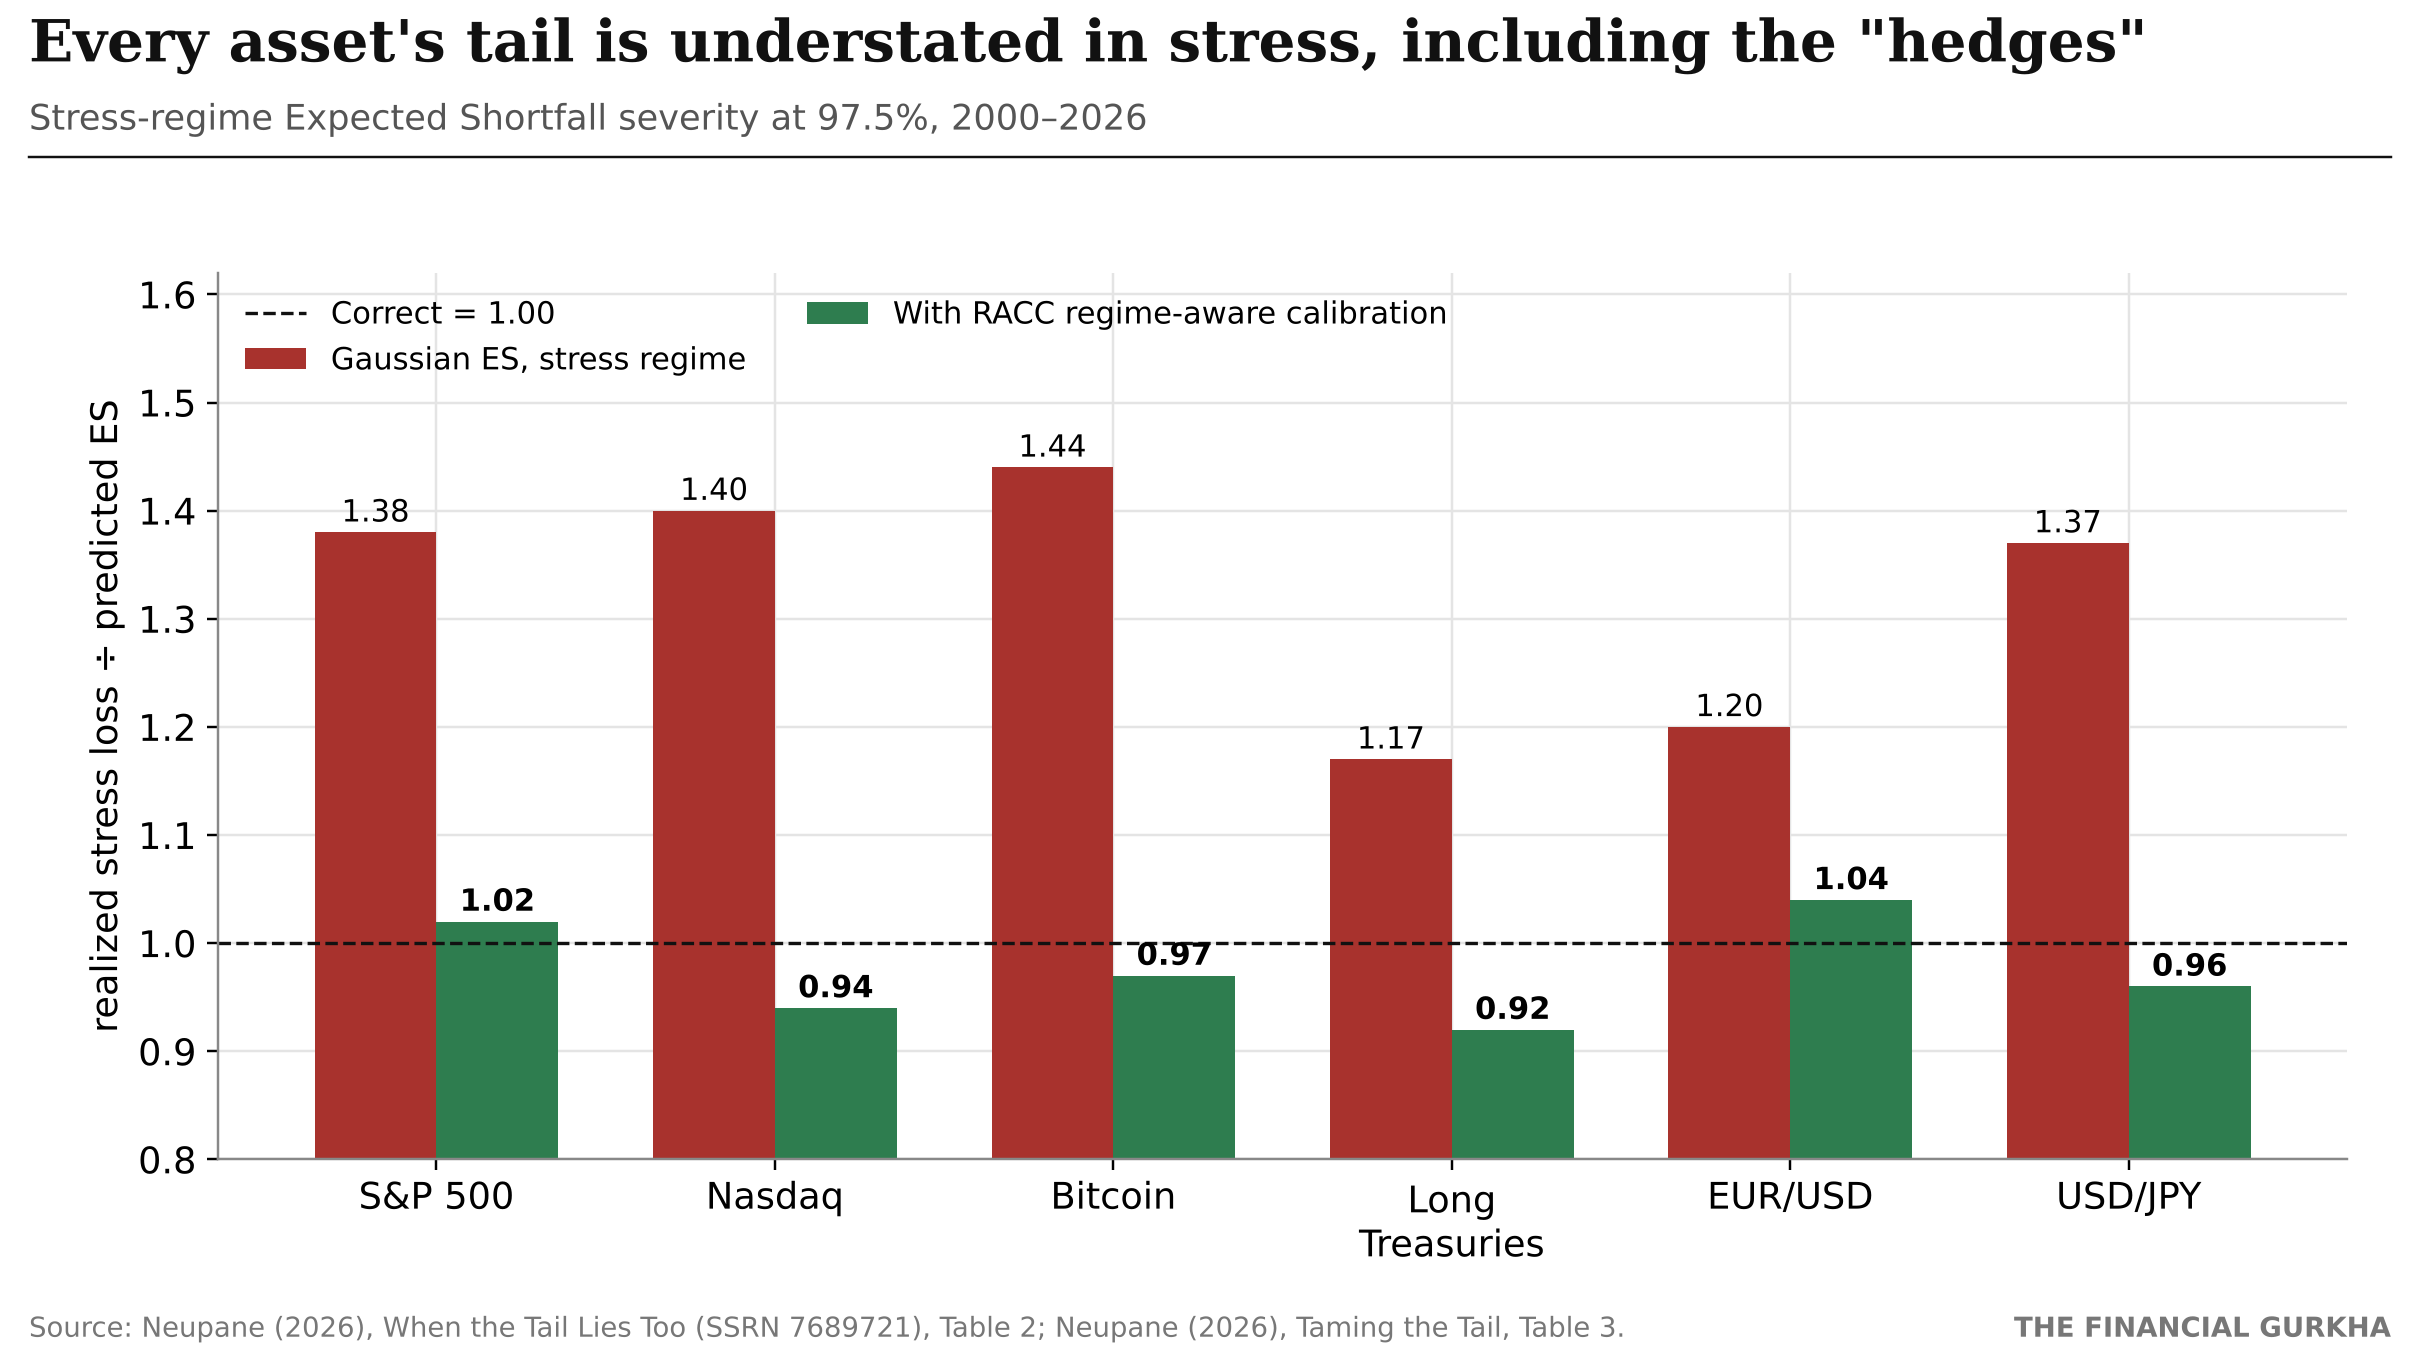
My paper When the Tail Lies Too tests Expected Shortfall, the average loss on the worst days and the measure Basel's FRTB uses to set market-risk capital, across six assets from 2000 to 2026. In stress regimes, a Gaussian ES model understates realized tail losses on every one:
| Stress-regime ES severity, 97.5% | Gaussian ES | With RACC calibration |
|---|---|---|
| S&P 500 | 1.38 | 1.02 |
| Nasdaq | 1.40 | 0.94 |
| Bitcoin | 1.44 | 0.97 |
| Long Treasuries | 1.17 | 0.92 |
| EUR/USD | 1.20 | 1.04 |
| USD/JPY | 1.37 | 0.96 |
A ratio of 1.00 is correct; 1.44 means realized stress losses were 44% larger than predicted. Sources: Neupane (2026), When the Tail Lies Too, Table 2; Neupane (2026), Taming the Tail, Table 3.
Two rows stand out this week:
- Bitcoin has the largest understatement of any asset: 44%. The asset some investors hold as a diversifier is the one whose tail risk models miss by the most.
- Long Treasuries, the only hedge that worked this week, still have their stress tail understated by 17%. Even the safe asset is riskier in stress than calm-period models suggest.
6.3 The fix: calibrate by regime#
My newest working paper, Taming the Tail: Regime-Adaptive Conformal Calibration of VaR and ES (replication code), shows the gap can be closed. Regime-Adaptive Conformal Calibration (RACC) keeps separate calibration for calm and stressed markets and adapts online as conditions change. With RACC, stress-regime ES severity returns to about 1.0 on every asset, including Bitcoin (0.97) and long Treasuries (0.92).
One result from that paper speaks directly to this week. The single asset where RACC fell just short of a full pass under the volatility-based regime was long Treasuries, and the paper attributes it to the flight-to-quality asymmetry of the bond tail: Treasuries behave differently depending on whether a crisis is about growth or inflation. That is exactly the pattern this week and last week displayed. Using a VIX-based regime, which captures risk appetite directly, RACC passed on Treasuries too.
7. What investors and risk managers should take from this#↑ Contents
| Lesson | What it means in practice |
|---|---|
| Measure correlation in stress, not on average | Calm-period correlations overstate diversification. Stress-test portfolios with correlations of 0.7 or higher. |
| Ask who owns the hedge | An asset held by the same leveraged investors as your equities will be sold with your equities. |
| Liquidity is a risk factor | In a margin call, the most liquid asset gets sold first, regardless of its role in the portfolio. |
| Know which shock your hedge covers | Treasuries hedge growth shocks, not inflation shocks. Gold hedges currency and geopolitical risk, not forced liquidation. |
| Measure the whole episode | A single bad day is not the risk. Three weeks of clustered losses, as STER measures, is. |
| Calibrate models by regime | A risk model calibrated on calm data will understate both the frequency and the severity of stress losses. |
8. The case against my reading#↑ Contents
"Gold's long-term case is intact." Possibly. Central-bank buying, debt concerns and geopolitical risk did not change this week. Seymour, quoted above, argued that this is "the time to buy gold, not sell it". Forced selling is temporary, and assets sold for liquidity rather than on fundamentals can recover quickly once the selling ends.
"Diversification worked: 60/40 halved the loss." True, and that is an important point. The classic stock–bond mix did its job this week. My argument is narrower: the newer diversifiers did not, and even the bond hedge depends on the type of shock.
"One week is not a regime." Fair. But this was the third AI-driven shock in three weeks, Bitcoin has fallen for seven straight weeks, and gold has fallen in two consecutive weeks of opposite stock-market direction. That is a pattern, not a single data point.
My assessment: the protection most investors think they own is weaker than they believe, because it was measured in calm markets. Treasuries remain the most reliable hedge against a growth shock, but no single asset protects against every kind of crisis. The only robust defense is to measure risk the way it behaves in stress, not the way it looks on average.
9. What to watch#↑ Contents
| Signal | Why it matters |
|---|---|
| Treasuries vs. stocks | If bonds start falling with stocks, the last working hedge is gone |
| Gold near $3,500 | A clean break would suggest forced selling is not finished; a quick rebound would suggest it is |
| Bitcoin ETF flows | An end to outflows would be the first sign that the deleveraging in crypto is slowing |
| The VIX above 30 | Sustained stress readings keep correlations high and force further risk reduction |
| December Fed meeting | A hike into a correction raises the risk of an inflation-type shock, where bonds and stocks fall together |
| Thanksgiving-week liquidity | Thin holiday trading can amplify moves in either direction |
The bottom line#↑ Contents
Gold fell 8.9%. Bitcoin fell 7.9%. Stocks fell 8.6%. In the week the market most needed protection, two of the three most popular hedges moved with the portfolio instead of against it.
That is not a failure of gold or Bitcoin as assets. It is a failure of how diversification is measured. Correlations estimated in calm markets describe a different world from the one a portfolio meets in a crisis. When forced selling arrives, everything liquid is sold together, ten assets behave like one bet, and the same portfolio carries about 50% more risk than its report says.
A hedge is not an asset. It is a relationship between assets, and relationships change under stress.
Your take#
Did your portfolio's hedges work this week? Are gold and Bitcoin still diversifiers, or have they become part of the same trade? Share your view in the comments.
Read the research
Systemic Tail Episode Risk: Persistence and Cumulative Severity of Synchronized Extreme-Loss Episodes Across Markets > papers.ssrn.com/sol3/papers.cfm?abstract_id=7534899
When the Tail Lies Too: Governance-Grade Backtesting of Expected Shortfall under Regime Shifts > papers.ssrn.com/sol3/papers.cfm?abstract_id=7689721
NEW: Taming the Tail: Regime-Adaptive Conformal Calibration of Value-at-Risk and Expected Shortfall (working paper, November 2026) Replication code and data: github.com/nirajneupane17/racc
When Backtests Lie: A Governance-Grade Validation Framework for Machine-Learning Value-at-Risk Models under Regime Shifts > papers.ssrn.com/sol3/papers.cfm?abstract_id=7652318
Conditional Tail Episode Risk: A Path-Dependent Framework for Extreme-Loss Episodes Beyond Value-at-Risk and Expected Shortfall > papers.ssrn.com/sol3/papers.cfm?abstract_id=7502499
ML-LiqVaR · SSRN 7222958 > Backtesting VaR Models Under SR 11-7 · SSRN 7170418
All papers: SSRN author page
About the author#
Niraj Neupane, CA (ICAI), is a Quantitative Researcher at Korvane, a Financial Economist at Calderyn Institute, and the founder of Wall Street Feed. His research covers Value-at-Risk, Expected Shortfall, systemic tail risk and the validation of AI risk models, and is published on SSRN.
Views expressed are the author's own and are not investment advice.
Sources#
Markets
- The Closing Print, Post-market and weekly summary (Nov 20, 2026): https://www.theclosingprint.net/2026/11/post-market-and-weekly-summary-2026-11-20/
- STL.News, U.S. stock market weekly update, week ending Nov 20, 2026 (Taiwan, Reuters): https://www.stl.news/u-s-stock-market-weekly-update-ending-nov-20-2026/
- NPR / AP, S&P 500 sinks and the Nasdaq composite goes negative for the year: https://www.npr.org/2026/11/20/g-s1-154797/nasdaq-sp500-stock-market-ai-sink-negative
- AP via La Nación, Nov 13 closes: https://www.lanacion.com.ar/usa/how-major-us-stock-indexes-fared-friday-11132026-nid13112026/
- TheStreet, Chips slide again, but the S&P 500 still ends the week up 2.5% (yields, Nov 9–13): https://pro.thestreet.com/market-commentary/chips-slide-again-but-the-sp-500-still-ends-the-week-up-2-5
Gold
- The National, Why is gold price going down? (Nov 20, 2026): https://www.thenationalnews.com/business/money/2026/11/20/why-is-gold-price-going-down/
- Nacionale, Why are stocks, gold and bitcoin all falling at once?: https://www.nacionale.com/en/articles/why-are-stocks-gold-bitcoin-all-falling-at-once-rate-hike-forced-selling-november-20
- 24/7 Wall St., Tim Seymour says this is the time to buy gold: https://247wallst.com/investing/2026/11/21/tim-seymour-says-this-is-the-time-to-buy-gold-not-sell-it/
- ANC Stock Investments, Gold price this week (Kyle Rodda quote): https://ancstockinvestments.com/blog/2026/11/20/gold-price-this-week-worst-drop-since-march/
- CBS News, Highest gold price in history: https://www.cbsnews.com/news/highest-gold-price-in-history-how-its-changed-from-2025-to-2026
- bne IntelliNews, Gold surges past $5,000 (2025 performance): https://www.intellinews.com/gold-surges-past-5-000-to-fresh-record-on-geopolitical-tensions-422277/
Bitcoin
- Yahoo Finance, Nasdaq 100 ends worst week since 2020 (Bitcoin weekly streak): https://finance.yahoo.com/markets/stocks/articles/nasdaq-100-ends-worst-week-013025833.html
- AlphaMaven / crypto.news, Bitcoin ETF outflows (Farside data): https://alpha-maven.com/story/crypto/bitcoin-price-falls-for-six-straight-weeks-as-bulls-defend-62000-crypto-news
- Analytics Insight, Bitcoin below its 200-week average: https://www.analyticsinsight.net/news/bitcoin-drops-12-below-its-200-week-average-as-spot-etf-assets-hit-a-three-month-low
Macro
- Newsquawk, Treasury wrap and FOMC minutes: https://www.newsquawk.com/headlines/treasury-wrap-t-note-futures-z6-settle-5-ticks-higher-at-105-25
Research
- Neupane, N. (2026). Systemic Tail Episode Risk. SSRN 7534899.
- Neupane, N. (2026). When the Tail Lies Too: Governance-Grade Backtesting of Expected Shortfall under Regime Shifts. SSRN 7689721.
- Neupane, N. (2026). Taming the Tail: Regime-Adaptive Conformal Calibration of Value-at-Risk and Expected Shortfall. Working paper, November 21, 2026.
- Choueifaty, Y., and Coignard, Y. (2008). Toward maximum diversification. Journal of Portfolio Management.
- Longin, F., and Solnik, B. (2001). Extreme correlation of international equity markets. Journal of Finance.