Global spending on compute infrastructure and cloud processing has reached roughly $3.0 billion to $3.7 billion per day in 2026—putting it on pace to overtake daily crude oil spending by 2030–2031. We examine the primary-source numbers behind the compute boom, model Nvidia’s margin compression and $227.3 billion buyback engine over the next 15 years, run a 10,000-trial Monte Carlo discounted cash flow valuation at a 5% discount rate, and stress-test how Nvidia, U.S. wages, global GDP, and the U.S. national debt diverge across three 15-year macro regimes.
By Kanchan Sharma · Founder & Analyst, Financial Gurkha · 11/21/2026
Financial Gurkha | New York City | November 21, 2026
Disclaimer: This article is for educational purposes only and is not investment advice. Trading and investing are subject to volatility and market risk, including partial or entire loss of capital. Please consult your financial advisor before making investment decisions. Financial Gurkha and its writers are not liable for your losses, nor do we take credit for your gains.
AI disclosure. This analysis was researched and drafted with the help of AI tools for reading filings, running Monte Carlo simulations, checking arithmetic, and structuring drafts. Every primary-source figure is verified against official filings and statistical releases, and the framing, model assumptions, and conclusions are Financial Gurkha's.
Author disclosure. The author of this article may hold equity or option positions in mentioned tickers, including NVDA, MSFT, GOOGL, AMZN, AVGO, and AMD. All 15-year financial, valuation, and macroeconomic projections below are educational scenario exercises supported by explicit arithmetic—not price targets or predictions.
The 60-Second Version#↑ Contents
| Metric / Benchmark | Primary-Source Figure or Model Output | Source / Basis |
|---|---|---|
| Global Daily Compute Spend (2026) | $3.21B/day ($1.17T/yr Data Center + IaaS); up to $3.73B/day ($1.36T/yr AI infra) | Gartner IT & AI Spending Forecasts (2026) |
| Global Daily Crude Oil Spend (2026) | $9.98B/day (~102.4M bbl/d × $97.44/bbl Brent avg) | IEA Oil Market Report & EIA STEO (2026) |
| Projected Compute-vs.-Oil Crossover | 2030–2031 (~$9.89B/day compute vs. ~$9.02B/day crude oil) | Financial Gurkha Baseline Trajectory |
| Nvidia Daily Capture (Late 2026) | ~$1.18B/day ($107.6B Q3 FY27 data center revenue ÷ 91 days) | NVIDIA Q3 FY27 Form 10-Q / Release |
| Nvidia Margins (Q3 FY27) | 74.8% GAAP gross margin; 56.4% net profit margin ($65.3B quarterly net income) | NVIDIA Q3 FY27 CFO Commentary |
| Nvidia Balance Sheet & Buybacks | $53.51B cash & debt securities; $227.3B remaining buyback authorization | NVIDIA Q3 FY27 Supplemental Info |
| 15-Yr Monte Carlo DCF (5% Rate) | $12.00T median EV ($5.80T P10 to $19.91T P90) vs. ~$3.04T Nov 20, 2026 market cap | Financial Gurkha 10,000-Trial Simulation |
| Hypothetical 2041 NVDA Share Price | $532/share Baseline ($239 Bear / $25–$35 Perfect Storm / $2,300 Golden Age) | Financial Gurkha EPS + Buyback Model |
| 2041 U.S. Public Debt-to-GDP | 139.0% Baseline ($80.34T) vs. 85.4% Golden Age vs. 254.3% Perfect Storm | U.S. Treasury & CBO Baseline Modeling |
The six things that matter:#
- Compute is becoming an oil-scale commodity. Over the past decade (2017–2026), daily global spending on compute infrastructure and cloud processing surged more than 5.5× from ~$0.58 billion/day to $3.21 billion/day, cutting the oil-to-compute spending ratio from 11-to-1 down to 3-to-1.
- Nvidia’s market share will shrink even as its daily revenue doubles. Custom inference chips (ASICs) from Broadcom, Google, Amazon, and Meta will compress Nvidia’s share of global compute dollars from ~33% today toward ~14% by 2041, yet total market expansion still lifts Nvidia’s baseline daily take from ~$1.06B–$1.18B/day to ~$2.57 billion/day by 2041.
- Margin compression does not mean profit collapse. No hardware monopoly holds 75% gross margins for 15 years. Even if Nvidia’s net margin compresses by 17 percentage points (from 56.4% toward ~39.0% by 2041), higher volume generates ~$6.28 trillion in cumulative net profit over 15 years.
- Wall Street is discounting Nvidia at 12%–14%, not 5%. Discounting 15-year cash flows at a 5.0% risk-free-style rate produces a median Monte Carlo Enterprise Value of $12.00 trillion. Nvidia’s ~$3.04 trillion market cap ($125.53/share on November 20, 2026)—following co-founder Jensen Huang’s November 11 resignation and an SEC governance inquiry—reflects a steep risk premium.
- Buybacks turn slower growth into per-share compounding. Executing Nvidia’s $227.3 billion buyback authorization at depressed multiples and retiring ~40% of its share count over 15 years triples baseline EPS from $9.31 to $29.58 by 2041.
- Macro regimes govern everything. Under a 6-shock "Perfect Storm" (AI scaling wall, CapEx freeze, Taiwan blockade, heavy regulation, persistent inflation, and 20% yields), Nvidia falls to $25–$35/share and U.S. public debt spirals to 254.3% of GDP. Under a 6-tailwind "Golden Age" (≤2% inflation, clean governance sheet, hands-off government, public AI adoption, continued scaling, and Taiwan peace), U.S. real GDP expands +63% and public debt-to-GDP falls to 85.4%.
What's in this report#
- The 60-Second Version
- 1. Global Daily Spend: Compute vs. Crude Oil (2017–2036)
- 2. Who Captures the Daily Compute Dollar—and How Nvidia’s Slice Evolves
- 3. Margin Compression: From 74.8% Gross Margin to Mature Utility
- 4. Balance Sheet, Cash Flow, and the $227.3 Billion Buyback Engine
- 5. 15-Year DCF Valuation (at 5.0%) & 10,000-Trial Monte Carlo Simulation
- 6. Three 15-Year Macro Futures: Baseline vs. "Perfect Storm" vs. "Golden Age"
- Frequently Asked Questions
- Conclusion and Key Takeaways
- Methodology and Primary Sources
1. Global Daily Spend: Compute vs. Crude Oil (2017–2036)#↑ Contents
To compare compute against crude oil on an apples-to-apples daily basis, we divide annual institutional spending figures by 365 days. For compute, we combine global physical Data Center Systems hardware spending with rented public cloud Infrastructure-as-a-Service (IaaS) from Gartner’s IT Spending Forecasts. (Adding end-user computing devices such as PCs and smartphones—another ~$836 billion/year or ~$2.3 billion/day—brings total computing spend to ~$5.5–$6.0 billion/day, though we exclude consumer devices below to isolate data center and cloud compute.) For crude oil, we multiply annual global liquid fuels consumption (million barrels/day) by the annual average EIA Europe Brent Spot Price.
The Past Decade: 2017–2026 Historical Comparison#
| Year | Global Crude Oil Spend / Day | Oil Drivers (Demand × Avg Brent Price) | Global Compute Spend / Day | Compute Drivers (Data Center + Cloud IaaS) | Oil-to-Compute Ratio |
|---|---|---|---|---|---|
| 2017 | $5.33B / day | ~98.2M bbl/d × $54.25/bbl | $0.58B / day | $181B hardware + ~$30B cloud | 9.2× |
| 2018 | $7.08B / day | ~99.6M bbl/d × $71.06/bbl | $0.63B / day | $192B hardware + ~$38B cloud | 11.2× |
| 2019 | $6.47B / day | ~100.5M bbl/d × $64.36/bbl | $0.70B / day | $205B hardware + ~$49B cloud | 9.3× |
| 2020 | $3.81B / day | ~91.2M bbl/d × $41.76/bbl (COVID drop) | $0.70B / day | $191B hardware + ~$64B cloud | 5.5× |
| 2021 | $6.82B / day | ~96.5M bbl/d × $70.68/bbl | $0.83B / day | $212B hardware + ~$91B cloud | 8.2× |
| 2022 | $10.04B / day | ~99.6M bbl/d × $100.78/bbl (Ukraine shock) | $0.95B / day | $226B hardware + $120B cloud | 10.6× |
| 2023 | $8.40B / day | ~101.8M bbl/d × $82.47/bbl | $1.04B / day | $236B hardware + $144B cloud | 8.1× |
| 2024 | $8.31B / day | ~103.1M bbl/d × $80.56/bbl | $1.27B / day | $293B hardware + $172B cloud | 6.5× |
| 2025 | $7.21B / day | ~104.4M bbl/d × $69.04/bbl | $1.99B / day | $506B hardware + $222B cloud | 3.6× |
| 2026 | $9.98B / day | ~102.4M bbl/d × $97.44/bbl (Middle East spike) | $3.21B / day | $879B hardware + $292B cloud | 3.1× |
(Note: Measuring strictly by AI-specific infrastructure across servers, networking, and storage, Gartner’s AI Spending Analysis places 2026 spending even higher at $1.36 trillion/year, or $3.73 billion/day.)
The Forward 10-Year Baseline Projection (2026–2036)#
For 2027, we anchor to published forecasts from Gartner (+48% Data Center & IaaS growth to $1,733B) and the EIA Short-Term Energy Outlook ($86.00/bbl Brent). From 2028 to 2036, our Baseline models compute growth decelerating gradually from 28% down to 6% as AI buildouts mature, while physical oil demand plateaus near ~105.5M bbl/d per IEA medium-term projections.
| Year | Projected Crude Oil Spend / Day | Oil Assumptions (Demand × Brent) | Projected Compute Spend / Day | Compute Assumptions (Data Center + IaaS) | Compute-to-Oil Ratio |
|---|---|---|---|---|---|
| 2026 | $9.98B / day | 102.4M bbl/d × $97.44/bbl | $3.21B / day | $1,171B/yr (Baseline) | 0.32× |
| 2027 | $8.98B / day | 104.4M bbl/d × $86.00/bbl | $4.75B / day | $1,733B/yr (+48% YoY) | 0.53× |
| 2028 | $8.49B / day | 104.8M bbl/d × $81.00/bbl | $6.08B / day | $2,218B/yr (+28% YoY) | 0.72× |
| 2029 | $8.62B / day | 105.1M bbl/d × $82.00/bbl | $7.41B / day | $2,706B/yr (+22% YoY) | 0.86× |
| 2030 | $8.85B / day | 105.4M bbl/d × $84.00/bbl | $8.67B / day | $3,166B/yr (+17% YoY) | 0.98× |
| 2031 | $9.02B / day | 105.5M bbl/d × $85.50/bbl | $9.89B / day | $3,610B/yr (+14% YoY) | 1.10× (Crossover) |
| 2032 | $9.18B / day | 105.5M bbl/d × $87.00/bbl | $10.98B / day | $4,007B/yr (+11% YoY) | 1.20× |
| 2033 | $9.33B / day | 105.4M bbl/d × $88.50/bbl | $11.97B / day | $4,367B/yr (+9% YoY) | 1.28× |
| 2034 | $9.48B / day | 105.3M bbl/d × $90.00/bbl | $12.92B / day | $4,717B/yr (+8% YoY) | 1.36× |
| 2035 | $9.63B / day | 105.2M bbl/d × $91.50/bbl | $13.83B / day | $5,047B/yr (+7% YoY) | 1.44× |
| 2036 | $9.77B / day | 105.0M bbl/d × $93.00/bbl | $14.66B / day | $5,350B/yr (+6% YoY) | 1.50× |
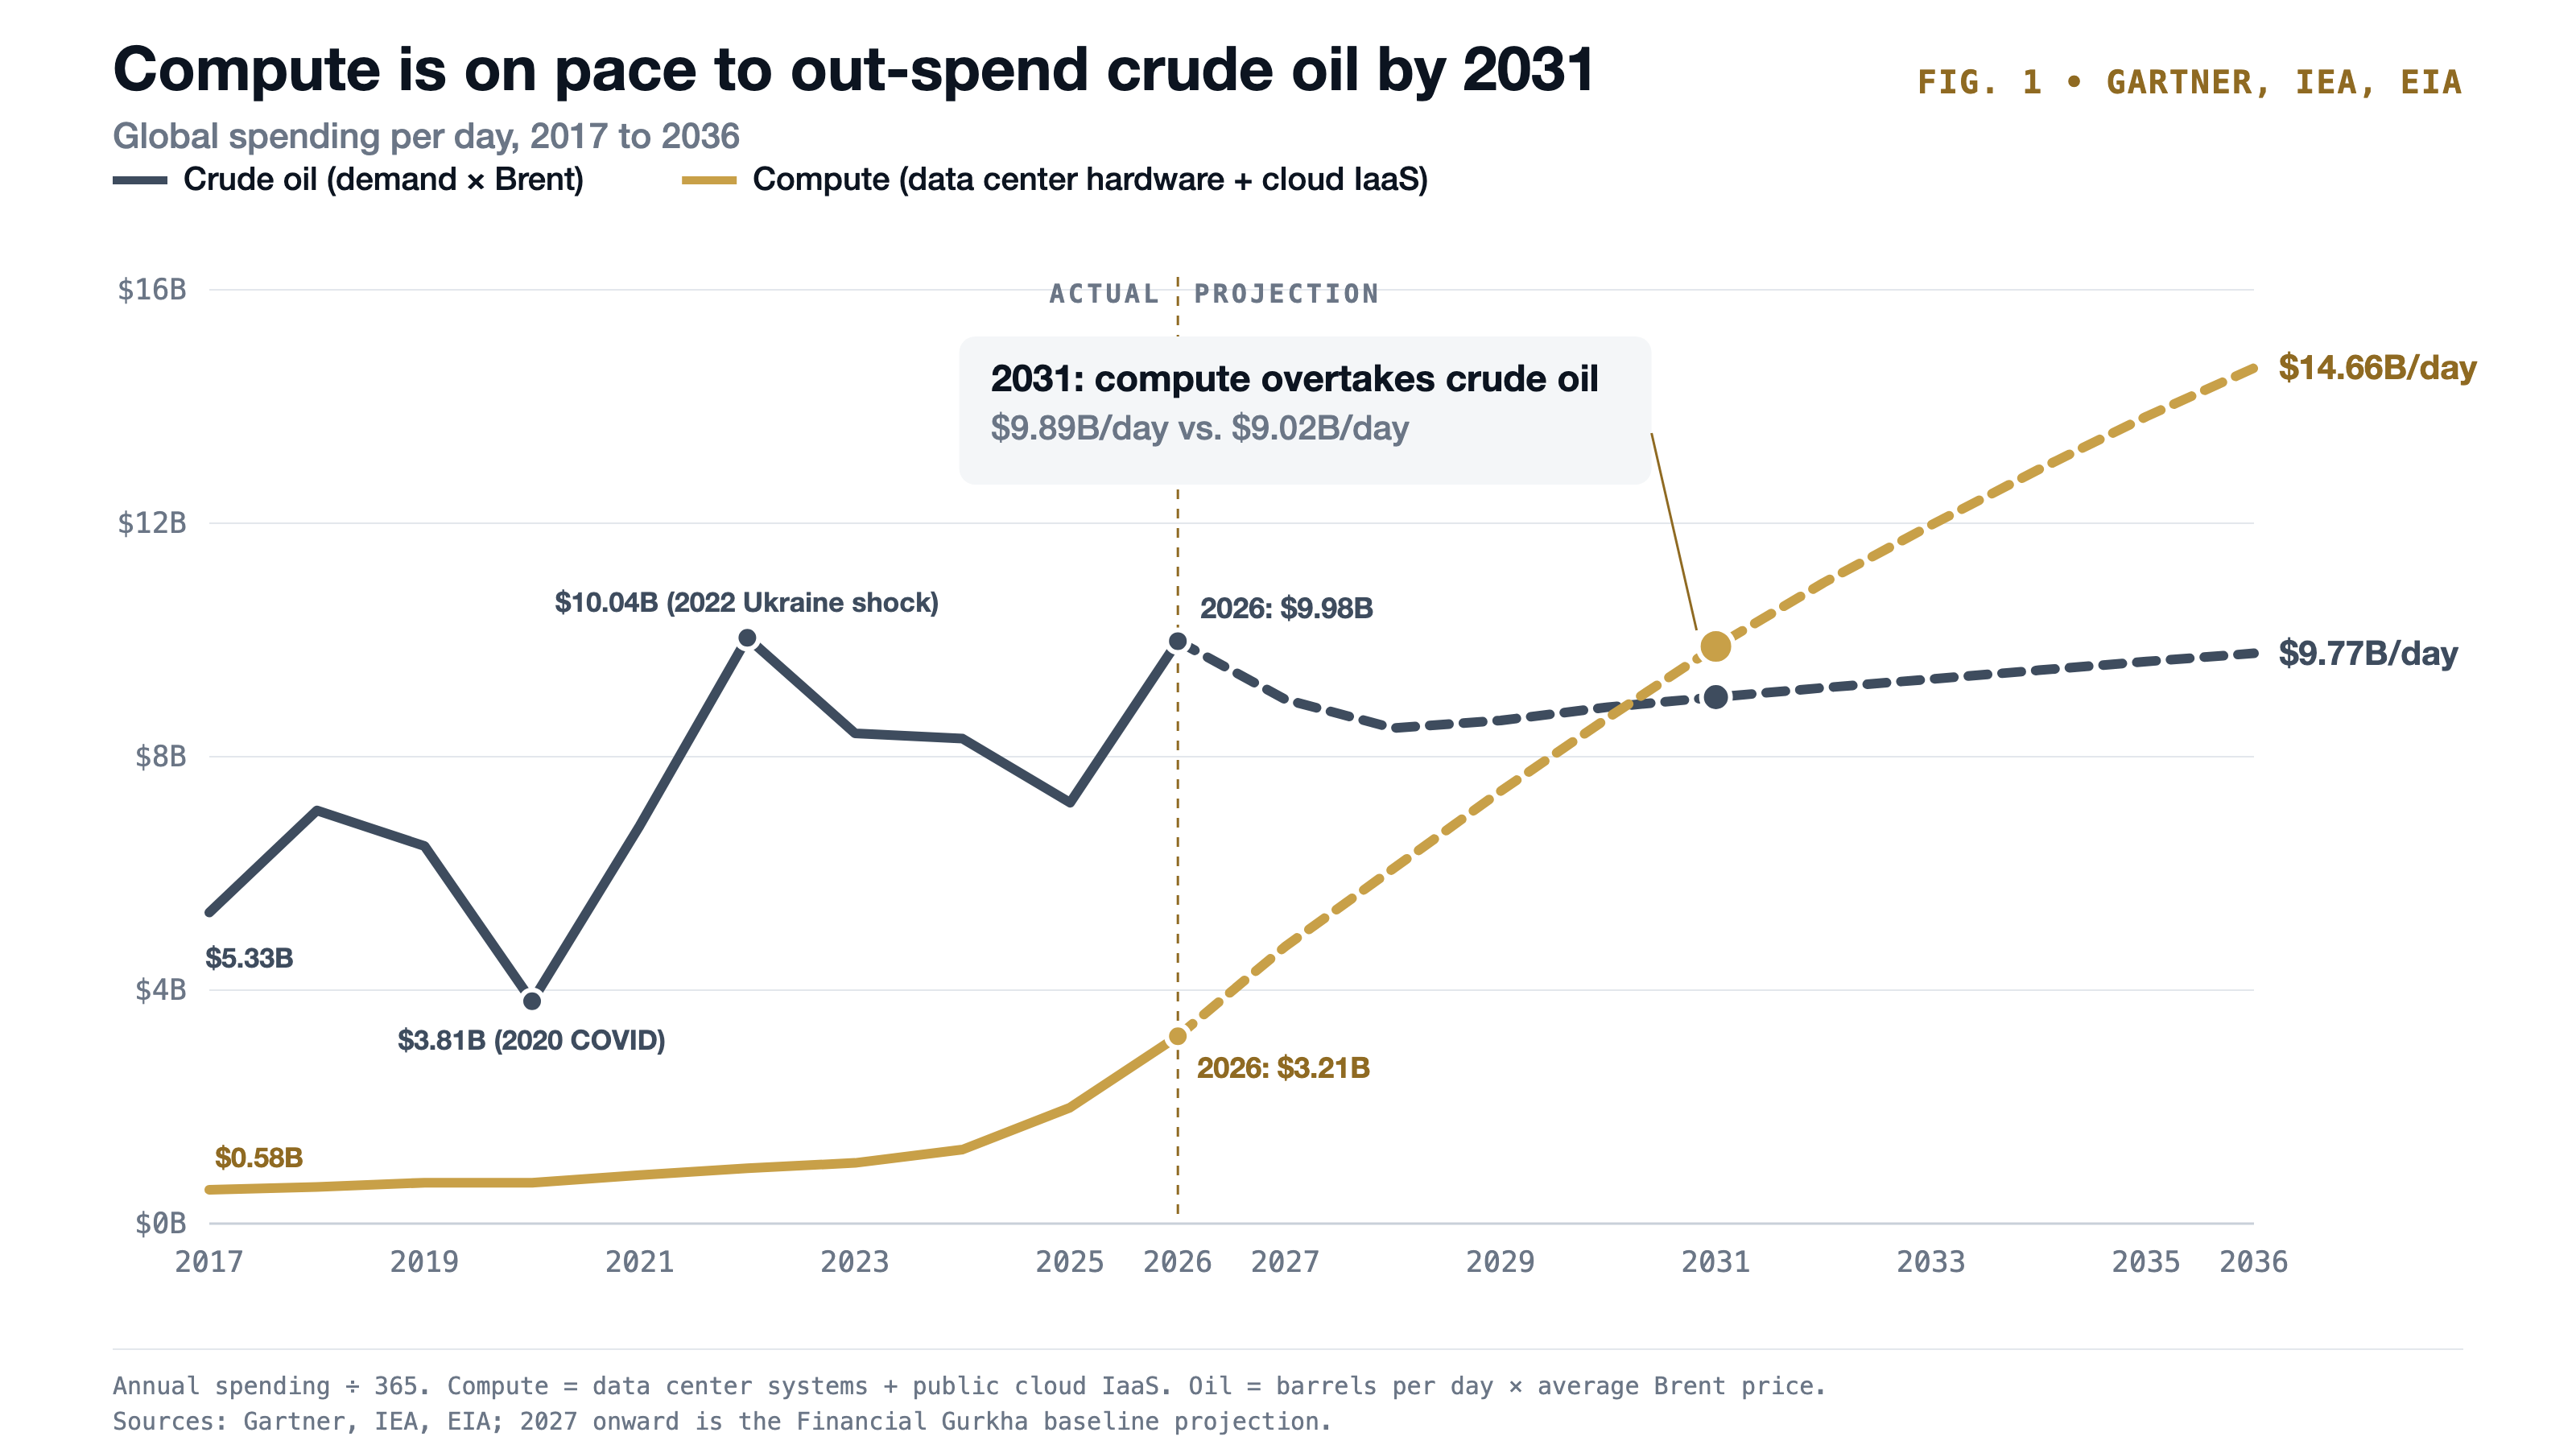
FIG. 1 · Gartner, IEA, EIA. Daily global spending on crude oil (demand × Brent) and compute (data center hardware plus cloud IaaS). Compute crosses oil in 2031 on the baseline projection ($9.89B vs. $9.02B per day).
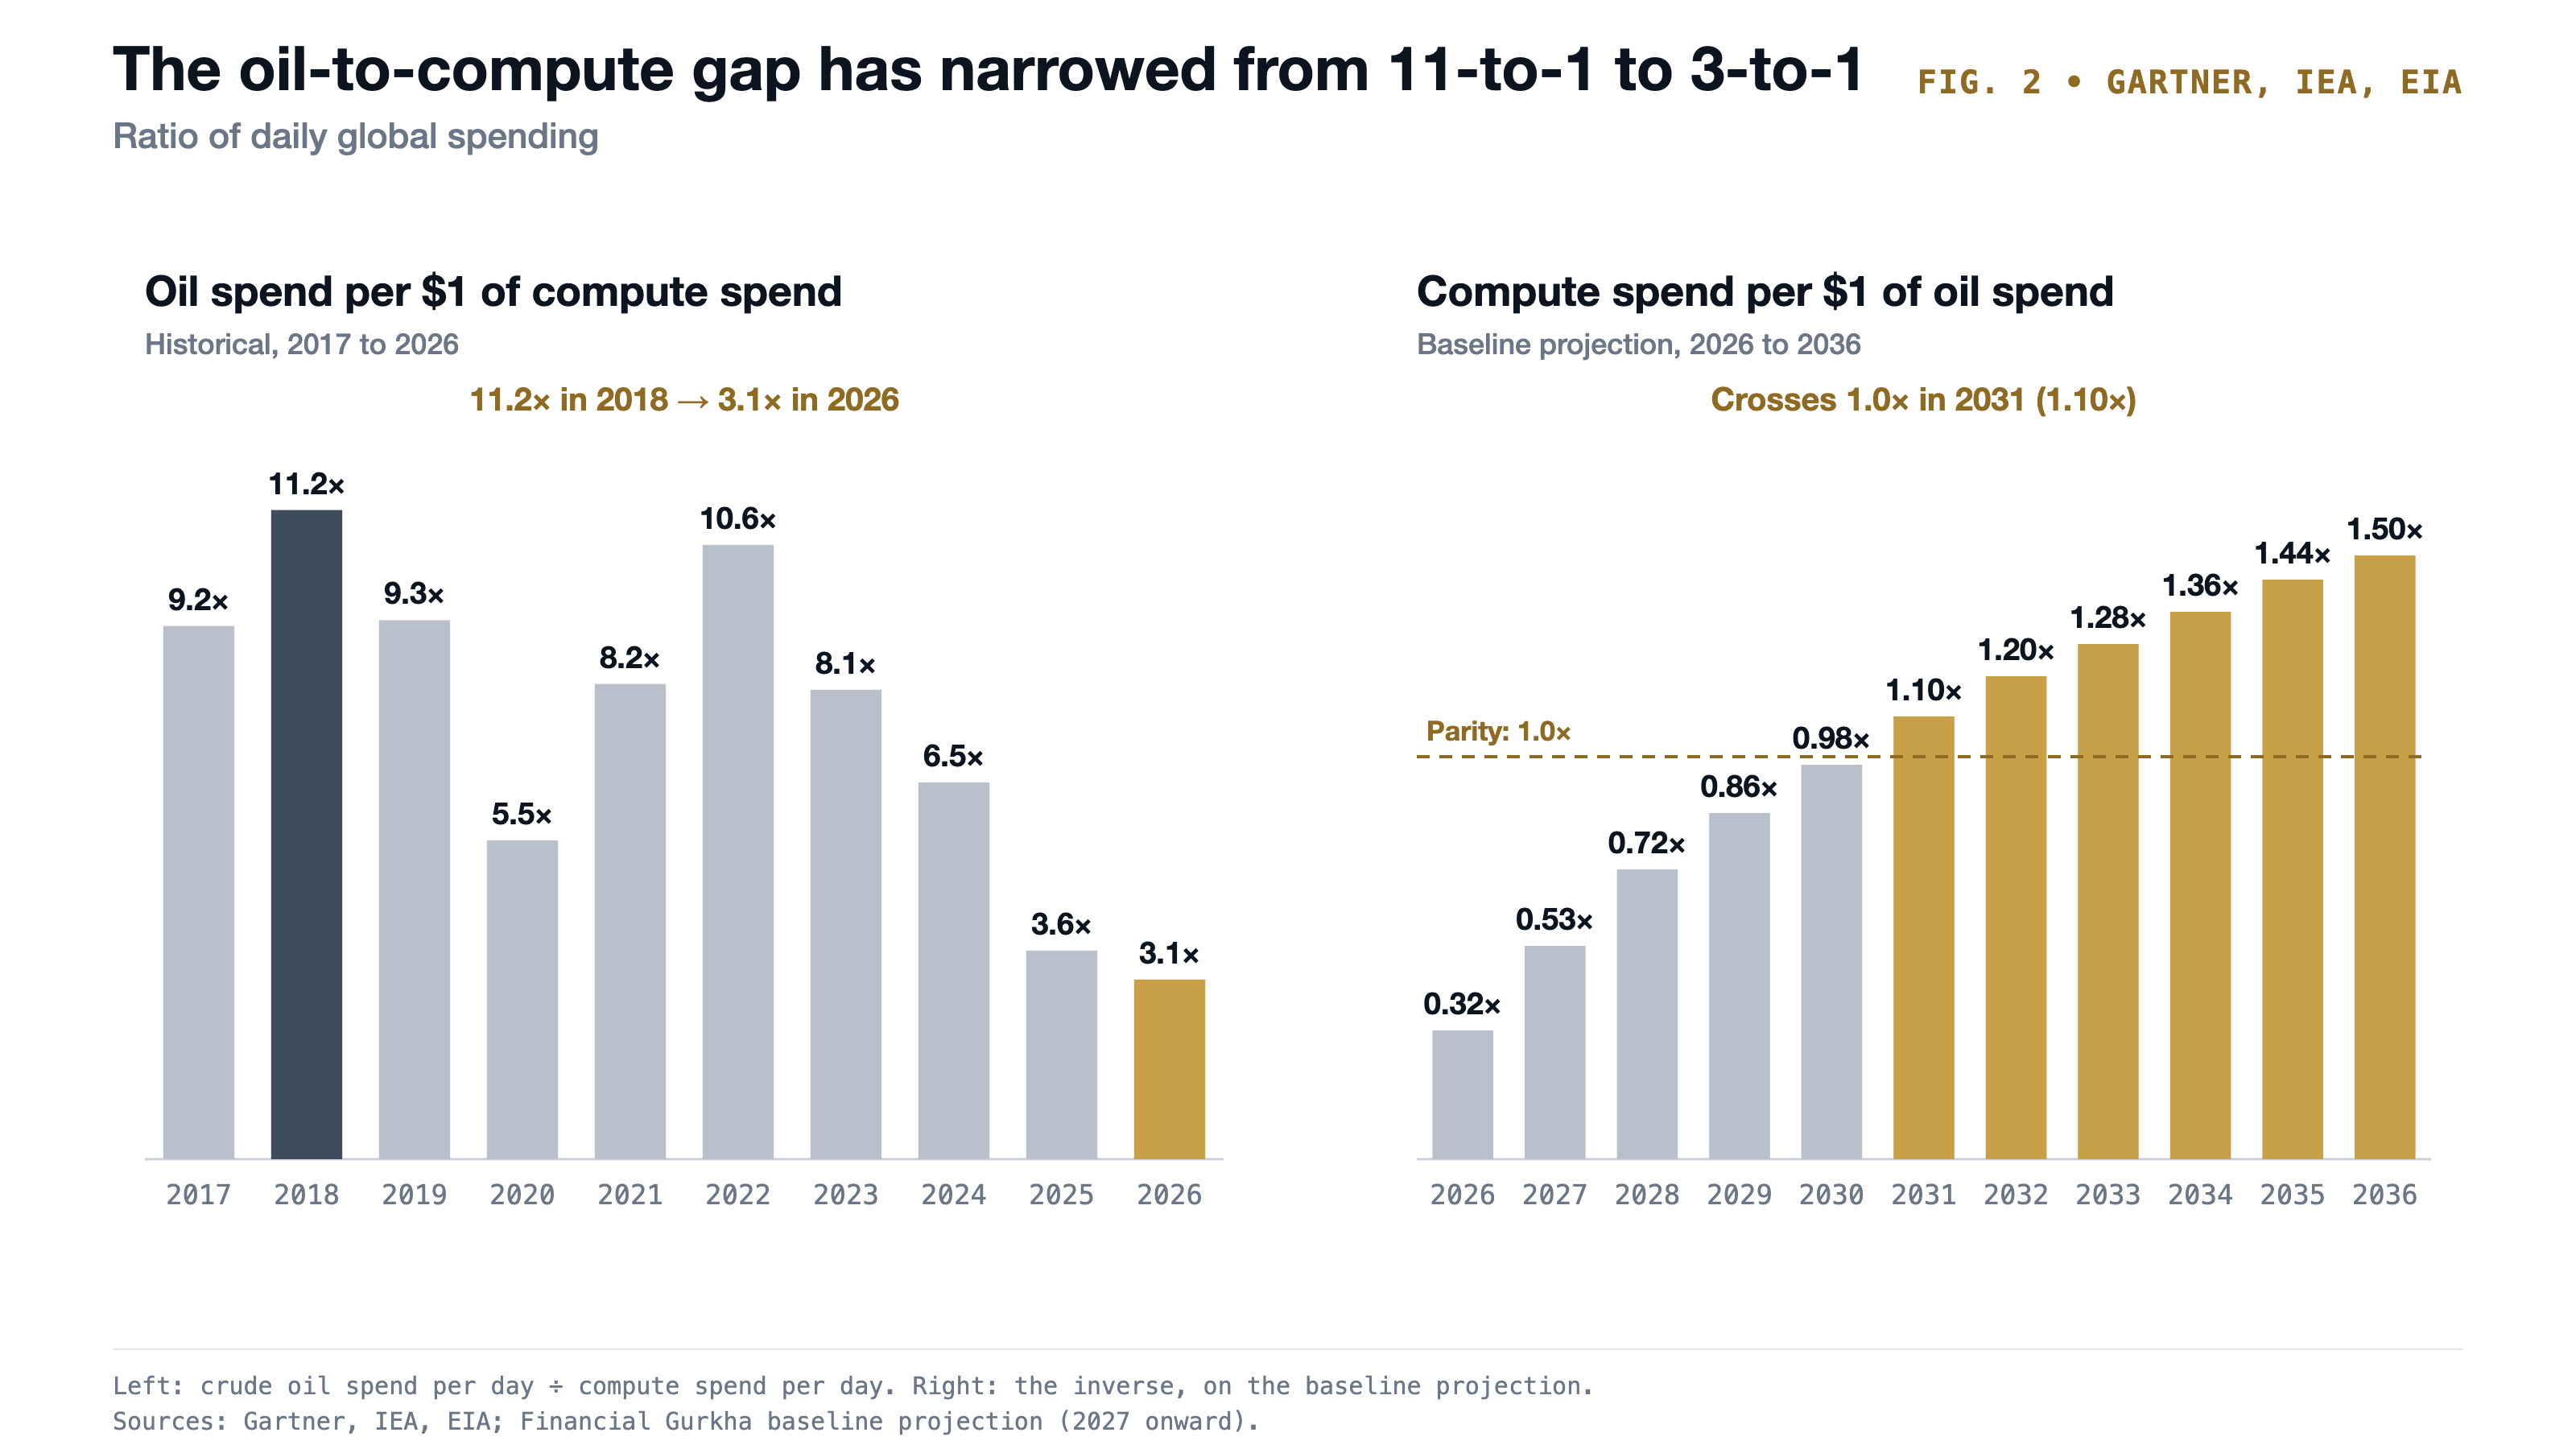
FIG. 2 · Gartner, IEA, EIA. The oil-to-compute ratio fell from 11.2× in 2018 to 3.1× in 2026. On the baseline projection the inverse ratio passes parity (1.0×) in 2031.
2. Who Captures the Daily Compute Dollar—and How Nvidia’s Slice Evolves#↑ Contents
In late 2026, compute spending flows across four tiers:
- AI Chips & Memory: Nvidia leads with $107.6 billion in Q3 FY27 data center revenue alone—roughly $1.18 billion per day—followed by Broadcom (custom ASICs for Google, Meta, and ByteDance), AMD, and High Bandwidth Memory (HBM) suppliers SK Hynix, Micron, and Samsung.
- Cloud Hyperscalers (approximate figures): Amazon Web Services ($46.0B Q3 2026 revenue, $504M/day), Microsoft Azure ($33.2B, $364M/day), and Google Cloud ($30.7B, $336M/day) capture roughly 61% of global cloud infrastructure rental.
- Foundries & Lithography: TSMC holds a near-monopoly on leading-edge 3nm/5nm fabrication and CoWoS packaging, supplied by ASML, Applied Materials, and Lam Research.
- Power, Cooling & Real Estate: Vertiv, Eaton, Schneider Electric, Equinix, and Digital Realty capture the physical grid and liquid-cooling bottlenecks.
Over the next 15 years (2026–2041), workloads will pivot from frontier model training toward high-volume inference, where hyperscalers deploy custom ASICs to lower per-token costs (Bloomberg Intelligence projects custom ASICs will grow at nearly double the pace of GPUs through 2033). Meanwhile, recurring cloud software and electricity bills will absorb a larger share of every compute dollar.
Nvidia’s Projected Daily Capture Over 15 Years (2026–2041)#
| Milestone Year | Total Global Compute Spend / Day | Nvidia Share of Total Compute | Baseline Daily Capture (Annualized) | Bull Case (Physical AI & CUDA Lock-In) | Bear Case (Custom ASIC & Post-Silicon Shift) |
|---|---|---|---|---|---|
| 2026 (Current) | $3.21B / day | ~33% | ~$1.06B / day ($387B/yr) | $1.06B / day | $1.06B / day |
| 2030 (4 Years) | $8.67B / day | ~23% | ~$1.99B / day ($726B/yr) | $2.34B / day | $1.47B / day |
| 2036 (10 Years) | $14.66B / day | ~17% | ~$2.49B / day ($909B/yr) | $3.23B / day | $1.39B / day |
| 2041 (15 Years) | $18.39B / day | ~14% | ~$2.57B / day ($938B/yr) | $3.68B / day | $1.47B / day |
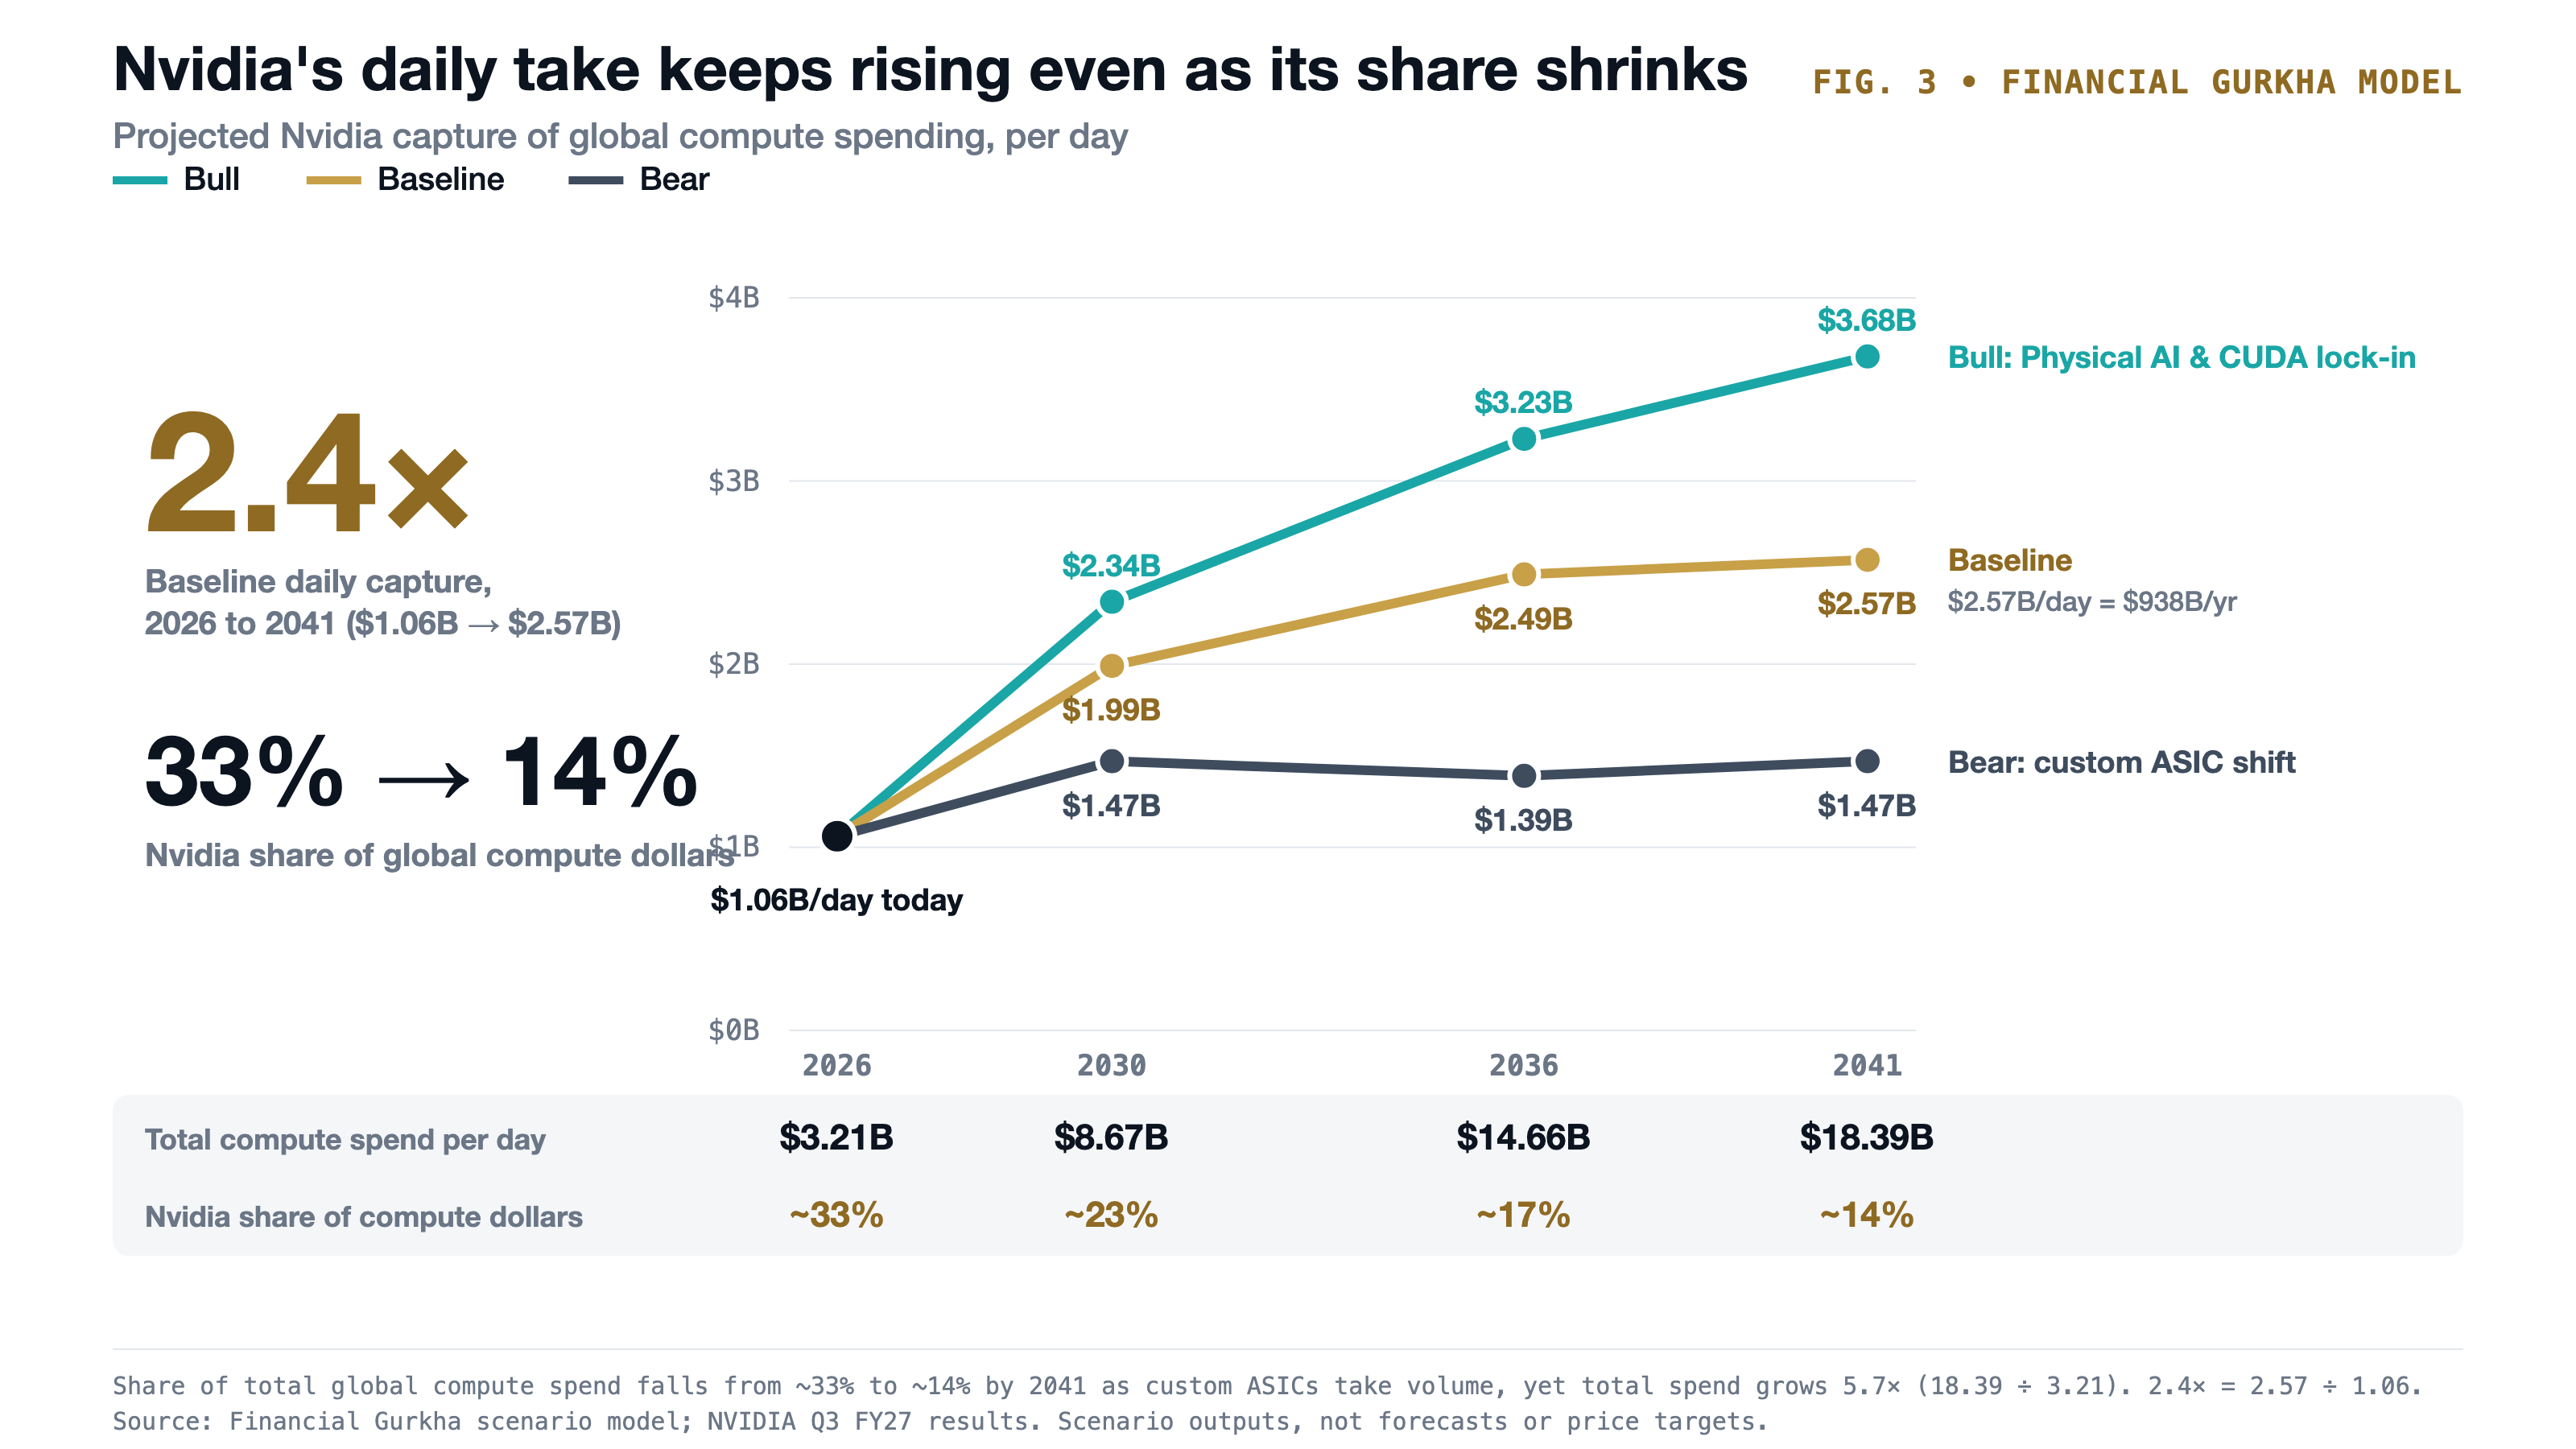
FIG. 3 · Financial Gurkha model. Nvidia's daily take rises in the baseline and bull cases even as its share of global compute dollars falls from ~33% to ~14%.
3. Margin Compression: From 74.8% Gross Margin to Mature Utility#↑ Contents
In Q3 FY2027 (ended October 25, 2026), Nvidia posted 74.8% GAAP gross margin, 66.9% operating margin, and 56.4% net profit margin ($65.3 billion in quarterly net income on $115.8 billion in revenue). By comparison, Broadcom operates near ~66.5% gross margin, AMD near ~51.2%, and the broader semiconductor industry averages ~45.8%.
Four structural forces will compress Nvidia’s margins over the next 15 years:
- Custom ASIC pricing ceilings: Internal TPUs and Trainium chips give hyperscalers a low-cost inference alternative, capping Nvidia’s generational price increases.
- Full-rack system mix: Selling complete Vera Rubin NVL72 liquid-cooled racks includes reselling third-party HBM memory, optics, and chassis hardware, which adds revenue dollars while mechanically lowering percentage gross margins. (Management already guided Q4 FY27 gross margin to 71.0%–72.0% before targeting 72%–73% in FY28.)
- Foundry & memory supplier pricing power: TSMC and HBM suppliers steadily capture a larger share of the bill of materials.
- R&D and software intensity: Sustaining an annual architecture cadence (Blackwell → Rubin → Feynman → post-2030 generations) requires tens of billions in yearly R&D.
Nvidia’s 15-Year Baseline Revenue & Profit Trajectory (2027–2041)#
| Period / Year | Annual Revenue | Gross Margin | Net Profit Margin | Annual Net Profit | Strategic Phase |
|---|---|---|---|---|---|
| 2027 (FY27) | ~$417B | ~73.5% | ~55.0% | ~$229B | Vera Rubin ramp; peak pricing power |
| 2028 (FY28) | ~$730B | ~72.5% | ~54.0% | ~$394B | Hyper-growth (+75% YoY management target) |
| 2031 (Year 5) | ~$955B | ~65.5% | ~47.0% | ~$449B | Peak annual net profit as volume offsets margin dip |
| 2036 (Year 10) | ~$1,040B | ~60.0% | ~41.5% | ~$432B | Mature utility phase; ASICs cap price hikes |
| 2041 (Year 15) | ~$1,090B | ~58.0% | ~39.0% | ~$425B | Steady-state replacement & Physical AI cycle |
| 15-Year Total | ~$14.28 Trillion | ~62.5% avg | ~44.0% avg | ~$6.28 Trillion | Cumulative 2027–2041 haul |
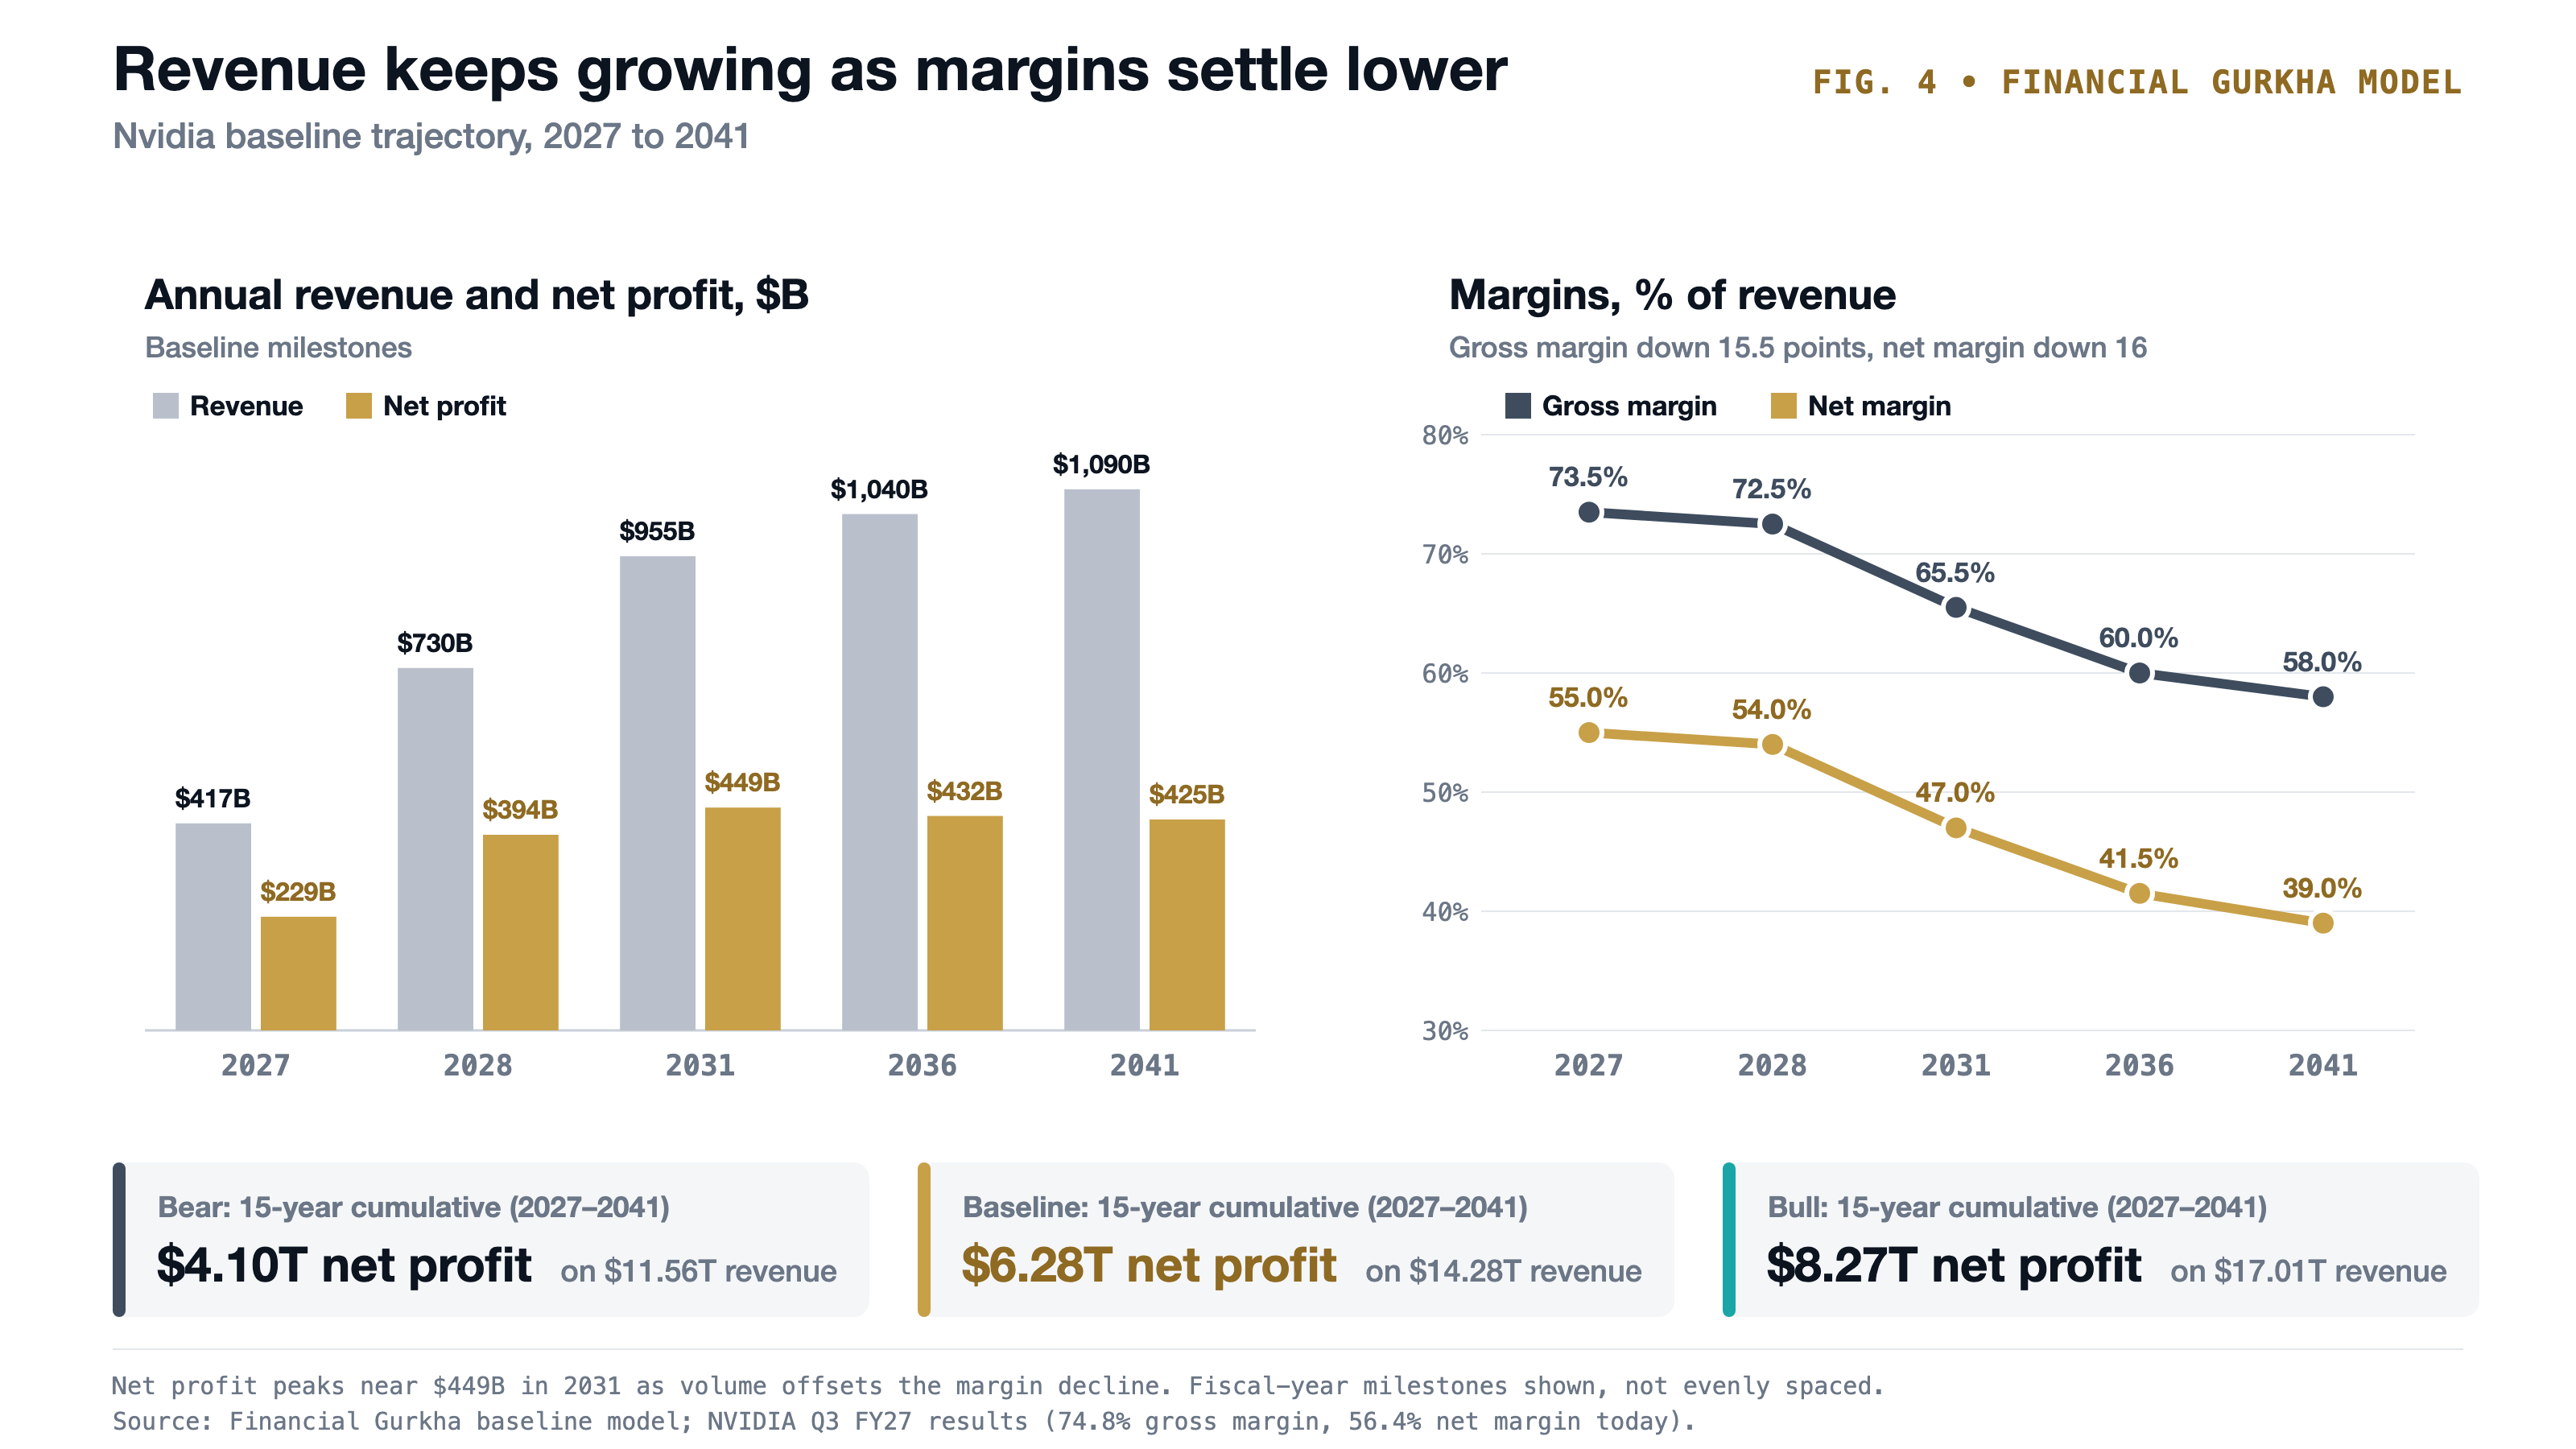
FIG. 4 · Financial Gurkha model. Baseline revenue and net profit at five milestones, the margin path, and 15-year cumulative net profit in the bear ($4.10T), baseline ($6.28T) and bull ($8.27T) cases.
Across all three scenarios, Nvidia’s 15-year cumulative haul ranges from $4.10 trillion in net profit on $11.56T revenue (Bear: 48% gross / 28% net margin by 2041) to $6.28 trillion (Baseline) and $8.27 trillion on $17.01T revenue (Bull: 65% gross / 46% net margin).
4. Balance Sheet, Cash Flow, and the $227.3 Billion Buyback Engine#↑ Contents
According to Nvidia’s Q3 FY2027 Supplemental Financial Information, the company enters late November 2026 with immense cash generation alongside rising working-capital commitments:
| Balance Sheet / Cash Metric | Q3 FY27 (Oct 25, 2026) | Change vs. Jan 2026 | Primary-Source Context |
|---|---|---|---|
| Cash & Marketable Debt Securities | $53.51 billion | +$3.84B (+7.7%) | $29.09B cash + $24.42B marketable debt |
| Marketable & Non-Marketable Equity | $109.75 billion | +$74.61B (+212%) | $44.22B public stocks + $65.53B private AI stakes |
| Total Debt (All Long-Term) | $32.37 billion | +$23.90B (+282%) | $0 short-term debt; +$21.14B net liquid cash |
| Quarterly Operating / Free Cash Flow | $48.25B / $43.8B | +103% YoY (OCF) | Run-rate FCF is ~$175B/year |
| Accounts Receivable & Inventory | $81.03B / $39.72B | +111% / +86% | Working capital tied up in Vera Rubin rack ramps |
| Purchase Commitments & Guarantees | $390B / $118B | Off-balance-sheet | Multi-year supply commitments + $118B neocloud/OpenAI guarantees |
The Buyback Machine#
After repurchasing $40.6B in FY25 and $48.0B in FY26, Nvidia spent $62.1 billion on buybacks in the first nine months of FY27 ($22.1B in Q3 alone, plus $6.0B in dividends). Following a $150 billion board authorization in September 2026, Nvidia held $227.3 billion in remaining buyback authority as of October 25, 2026, which interim CEO and CFO Colette Kress stated the company intends to complete by the end of FY2028 (January 2028).
At the November 20, 2026 closing price of $125.53/share (~13.5× trailing earnings, down ~48% from its $243.37 peak following Jensen Huang’s November 11 resignation and an SEC investigation), $227.3 billion is sufficient to retire ~1.81 billion shares (~7.5% of the company) in just five quarters.
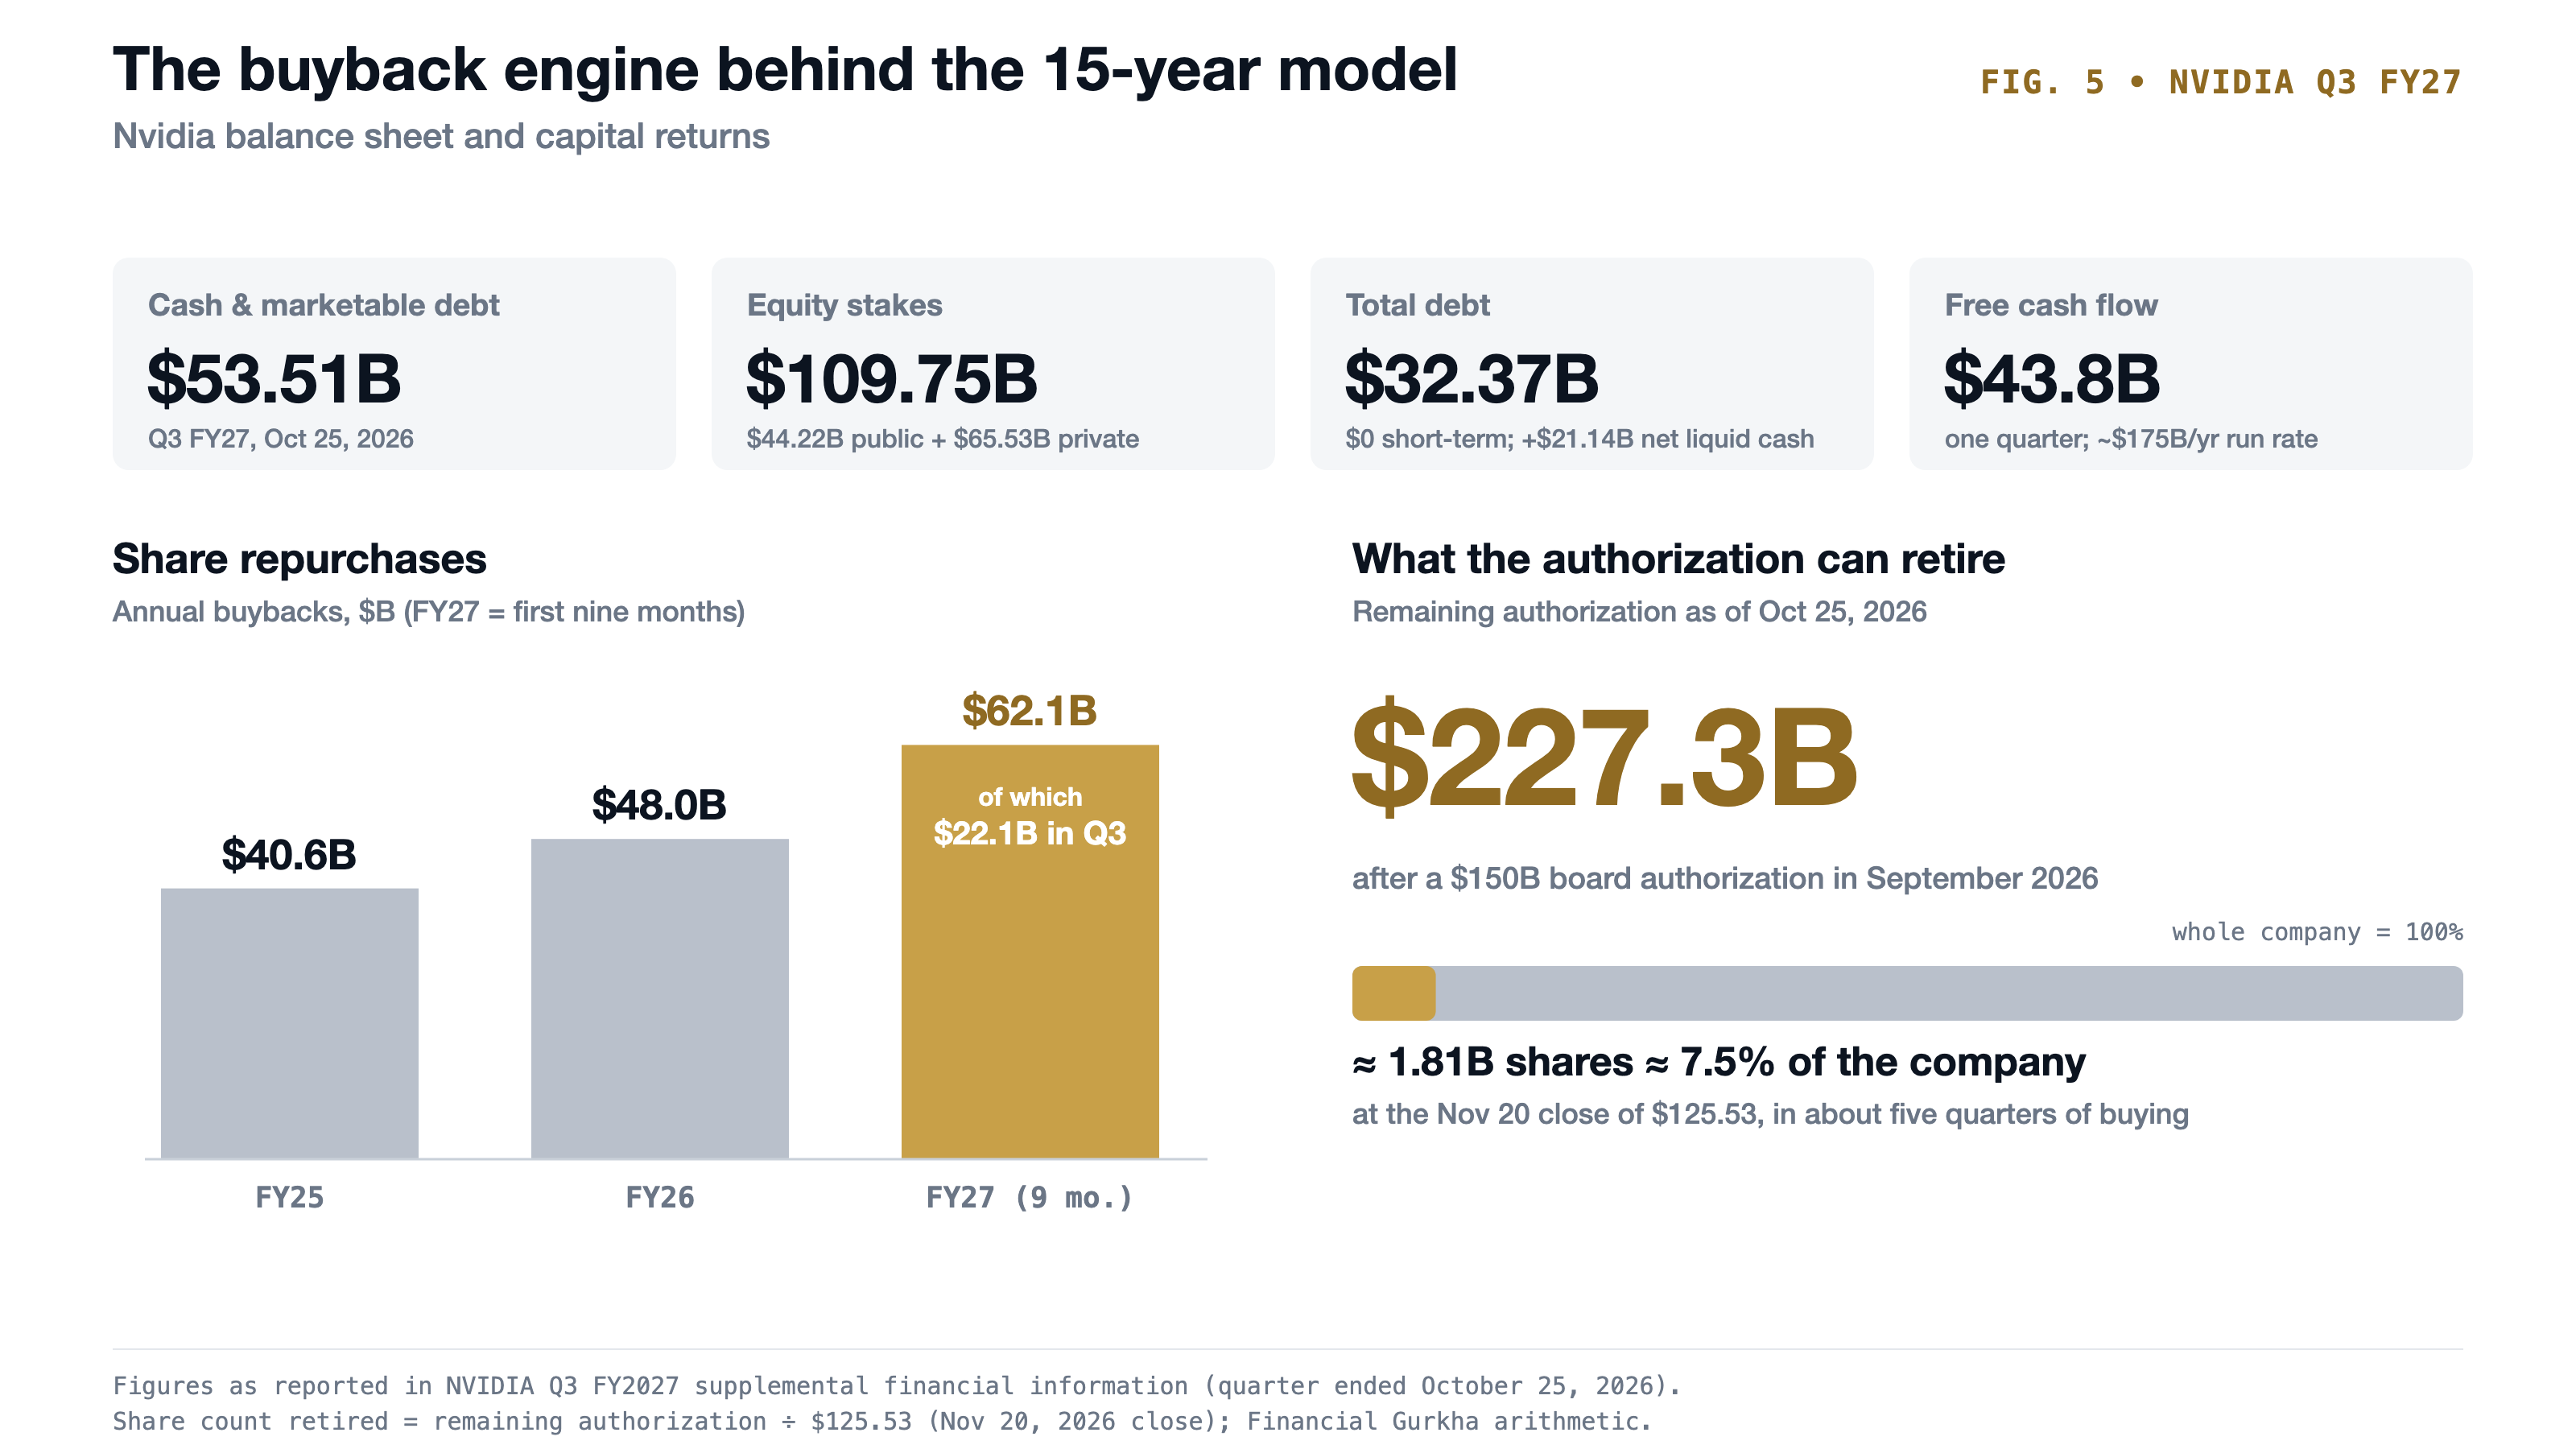
FIG. 5 · NVIDIA Q3 FY27. Balance sheet highlights, annual buybacks, and what the $227.3 billion remaining authorization could retire at the November 20 close.
5. 15-Year DCF Valuation (at 5.0%) & 10,000-Trial Monte Carlo Simulation#↑ Contents
To test intrinsic value over the 2027–2041 window, we discount projected Free Cash Flow (92%–97% FCF-to-net-income conversion) at a 5.0% interest rate—representing a near-risk-free sovereign benchmark rather than a standard 9%–11% equity WACC—plus a perpetuity terminal value after Year 15.
| Valuation Component | Bear Case (Commoditization) | Baseline Case (Margin Compression) | Bull Case (Platform Lock-In) |
|---|---|---|---|
| PV of 15-Year Cash Flows (2027–2041) | $2.60 Trillion | $4.07 Trillion | $5.48 Trillion |
| Terminal Growth Rate (g) | 1.5% | 2.5% | 3.0% |
| PV of Terminal Value (Year 15+) | $3.55 Trillion | $7.99 Trillion | $13.50 Trillion |
| Implied Enterprise Value (EV) | $6.15 Trillion | $12.07 Trillion | $18.98 Trillion |
| Implied Equity Value / Share (vs. $125.53) | ~$255 / share | ~$500 / share | ~$786 / share |
Running 10,000 Monte Carlo trials weighted across all three regimes (25% Bear, 50% Base, 25% Bull) with randomized annual revenue drift volatility (±2%), net margin shocks (±200 bps), FCF conversion (88%–99%), and terminal growth (0.5%–3.5%) yields:
- 10th Percentile (P10): $5.80 Trillion EV (~$241/share)
- 25th Percentile (P25): $7.97 Trillion EV (~$331/share)
- 50th Percentile (Median): $12.00 Trillion EV (~$497/share)
- Probability-Weighted Mean: $12.43 Trillion EV (~$515/share)
- 90th Percentile (P90): $19.91 Trillion EV (~$824/share)
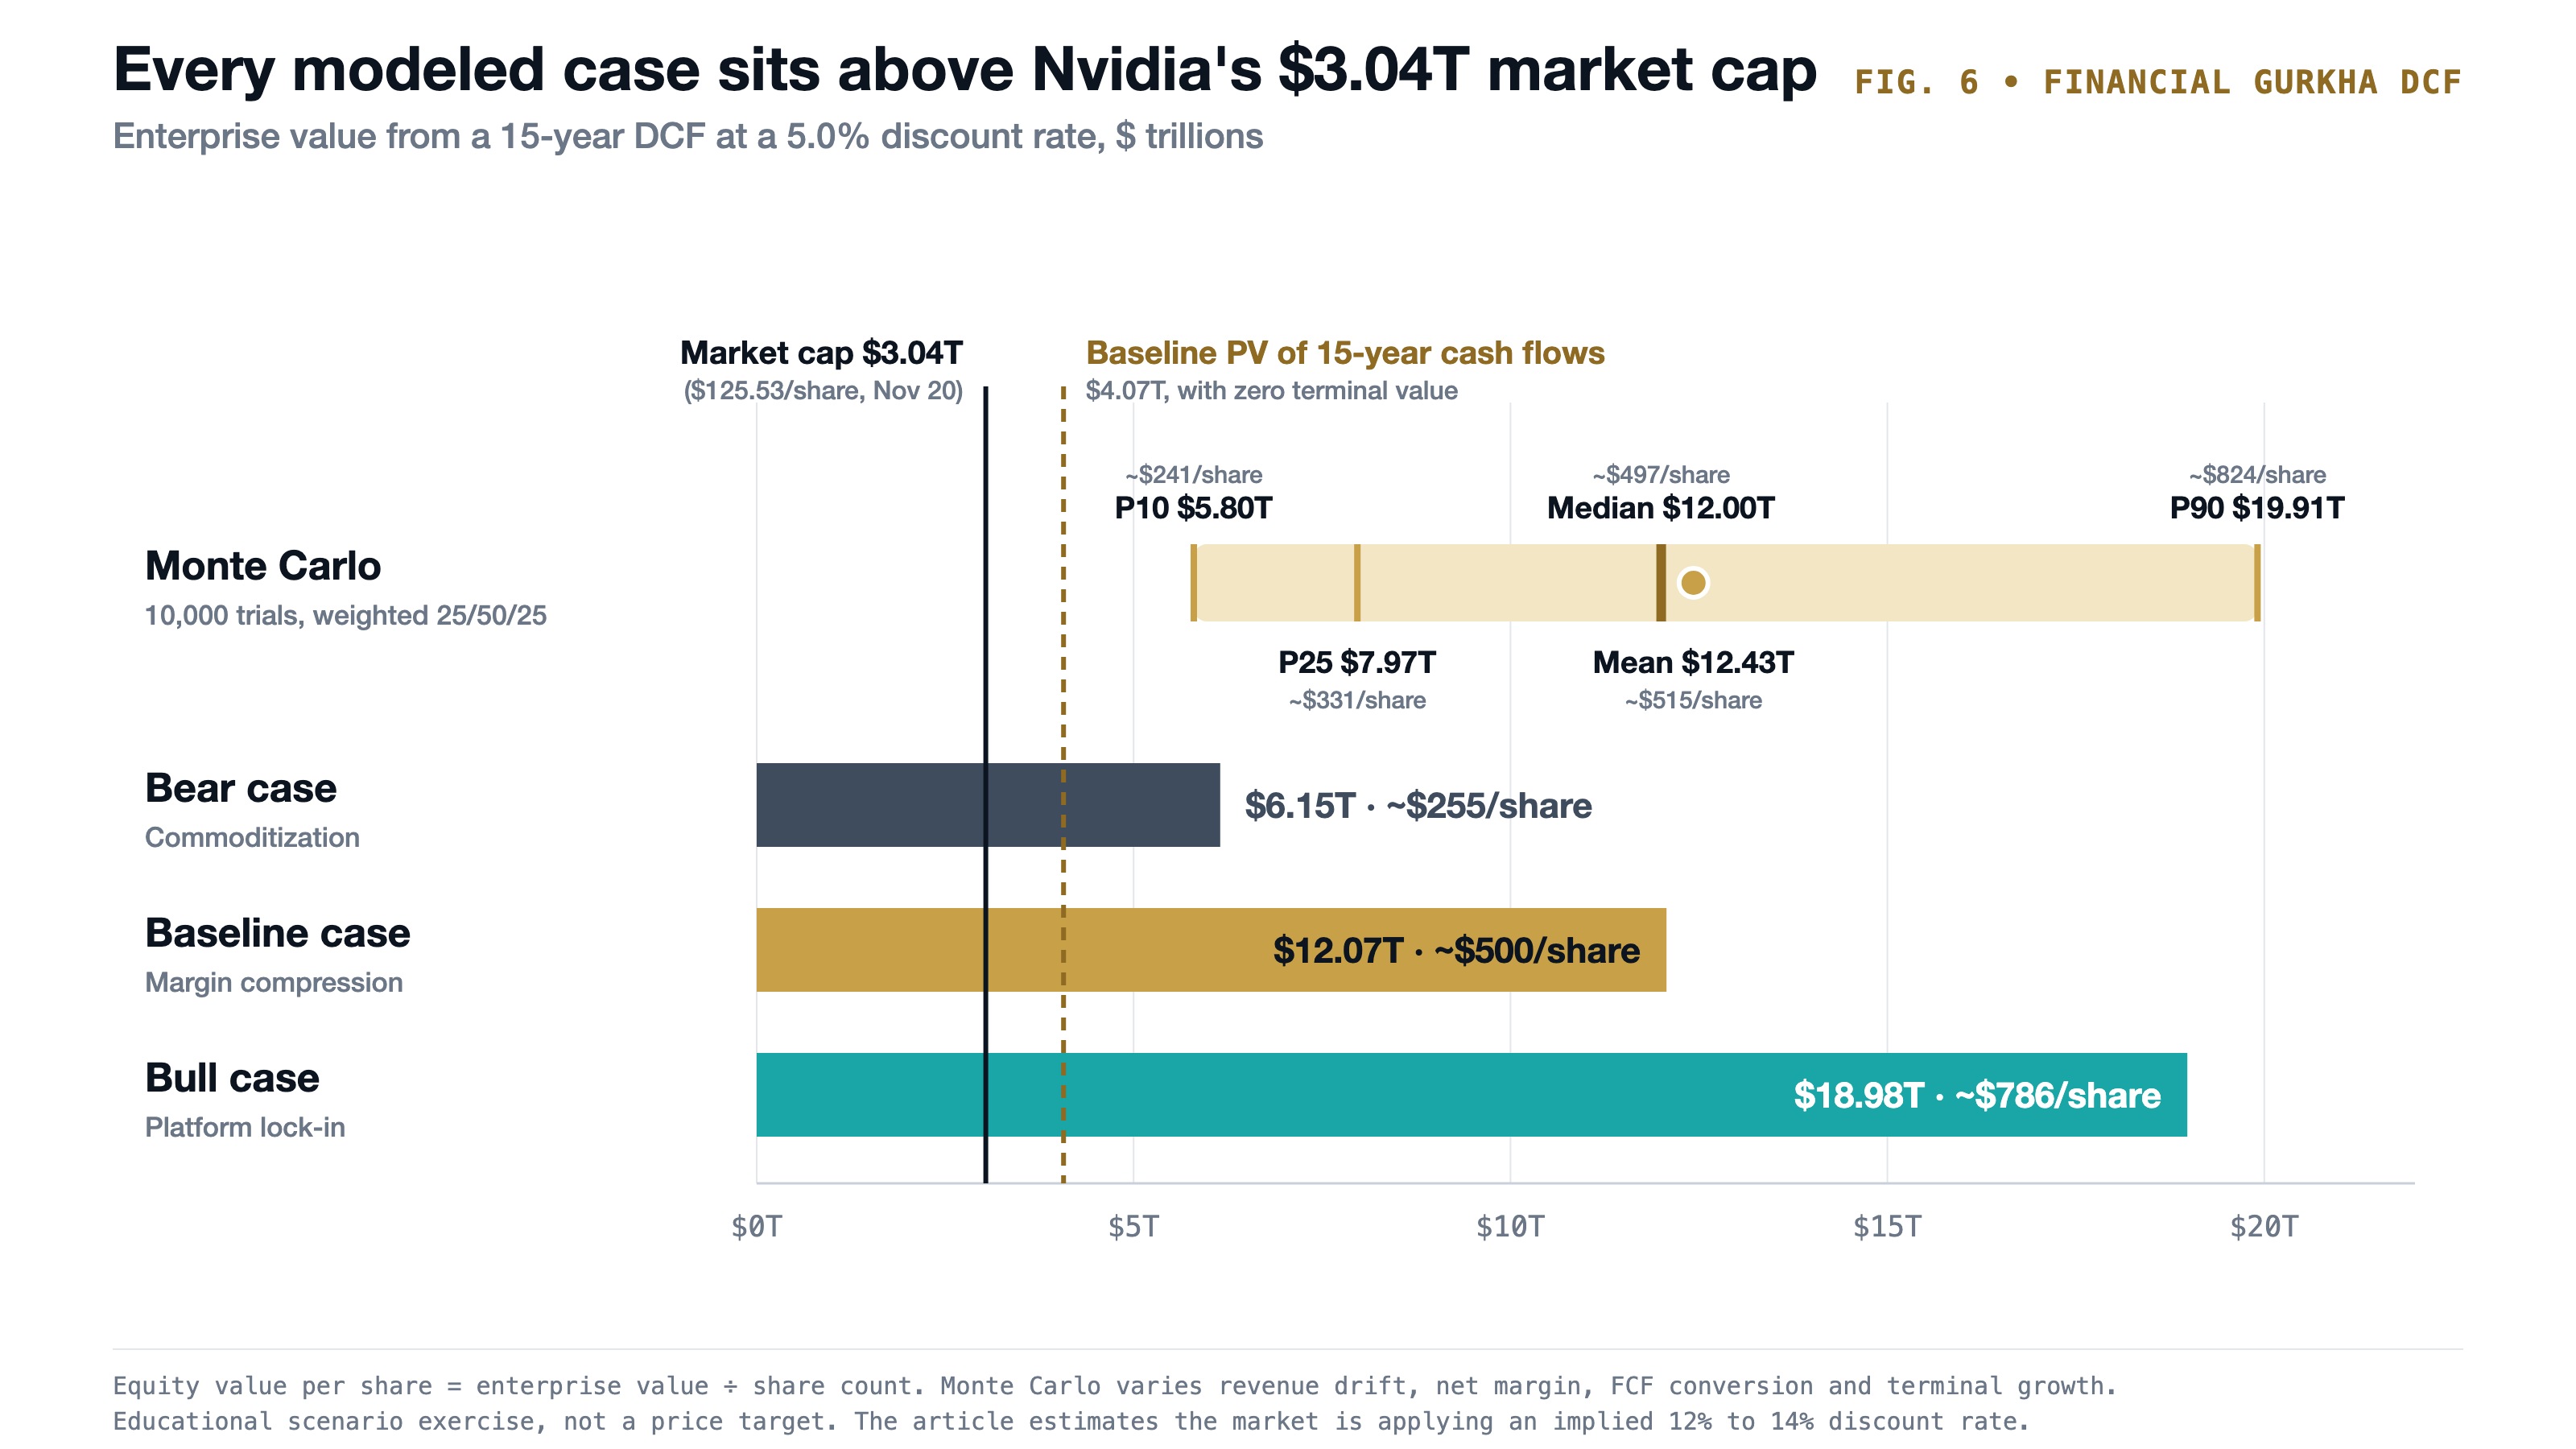
FIG. 6 · Financial Gurkha DCF. Enterprise value by case and across the 10,000-trial Monte Carlo (P10 to P90), against the $3.04T market cap and the $4.07T present value of baseline cash flows with no terminal value.
Why the gap vs. $3.04T exists: Even the present value of Nvidia’s 15-year cash flows with zero terminal value ($4.07T in the Baseline case) exceeds its November 20, 2026 market cap. Wall Street is currently applying an implied discount rate of 12%–14% to price in governance/SEC fallout, permanent CEO succession risk, and $508B in off-balance-sheet supply commitments and guarantees.
6. Three 15-Year Macro Futures: Baseline vs. "Perfect Storm" vs. "Golden Age"#↑ Contents
To stress-test how macroeconomics, geopolitics, and AI progress interact over 15 years, we compare our Baseline against two extreme six-factor regimes:
- The 6-Shock "Perfect Storm": (1) AI scaling hits a hard wall today; (2) hyperscaler CapEx dries up; (3) a Taiwan–China military blockade severs TSMC wafer supply; (4) heavy regulation discourages deployment; (5) persistent inflation surges to ~10% average; and (6) 1980s-style long-term yields approach 20% (pushing Nvidia’s equity discount rate to 22% and compressing P/E multiples to 6×).
- The 6-Tailwind "Golden Age": (1) Inflation falls to ≤2% (~3.0% Treasury yields); (2) Nvidia’s CEO/board inquiry resolves with a clean sheet; (3) government stays out of tech; (4) the public embraces AI; (5) AI scaling laws keep advancing; and (6) the China–Taiwan threat subsides peacefully ( status quo secured).
A. Nvidia Hypothetical 2041 Stock Price & Buyback Outcomes#
| Metric (2041 Projection) | 6-Shock "Perfect Storm" | Baseline Model | 6-Tailwind "Golden Age" |
|---|---|---|---|
| Compute vs. Oil Crossover | Never happens (Oil 3×+ larger) | 2030–2031 (~$9.9B/day) | 2028–2029 (Compute >$35B/d by 2041) |
| 2041 NVDA Annual Revenue / Net Margin | ~$340B / ~22.0% | ~$1.09T / ~39.0% | ~$3.42T / ~47.0% |
| 15-Yr Cumulative NVDA Net Profit | ~$1.08 Trillion | ~$6.28 Trillion | ~$15.28 Trillion |
| Cumulative 15-Yr Buybacks (Share Reduction) | ~$0.35T (Halted in crisis) | ~$3.73T (-40% shares → 14.39B) | ~$9.07T (-28% shares → 17.5B) |
| Assumed 2041 P/E Multiple | 6.0× | 18.0× | 25.0× |
| Hypothetical 2041 Stock Price (Pre-Splits) | ~$25 – $35 / share | ~$532 / share (+10.1% CAGR) | ~$2,300 / share (+21.4% CAGR) |
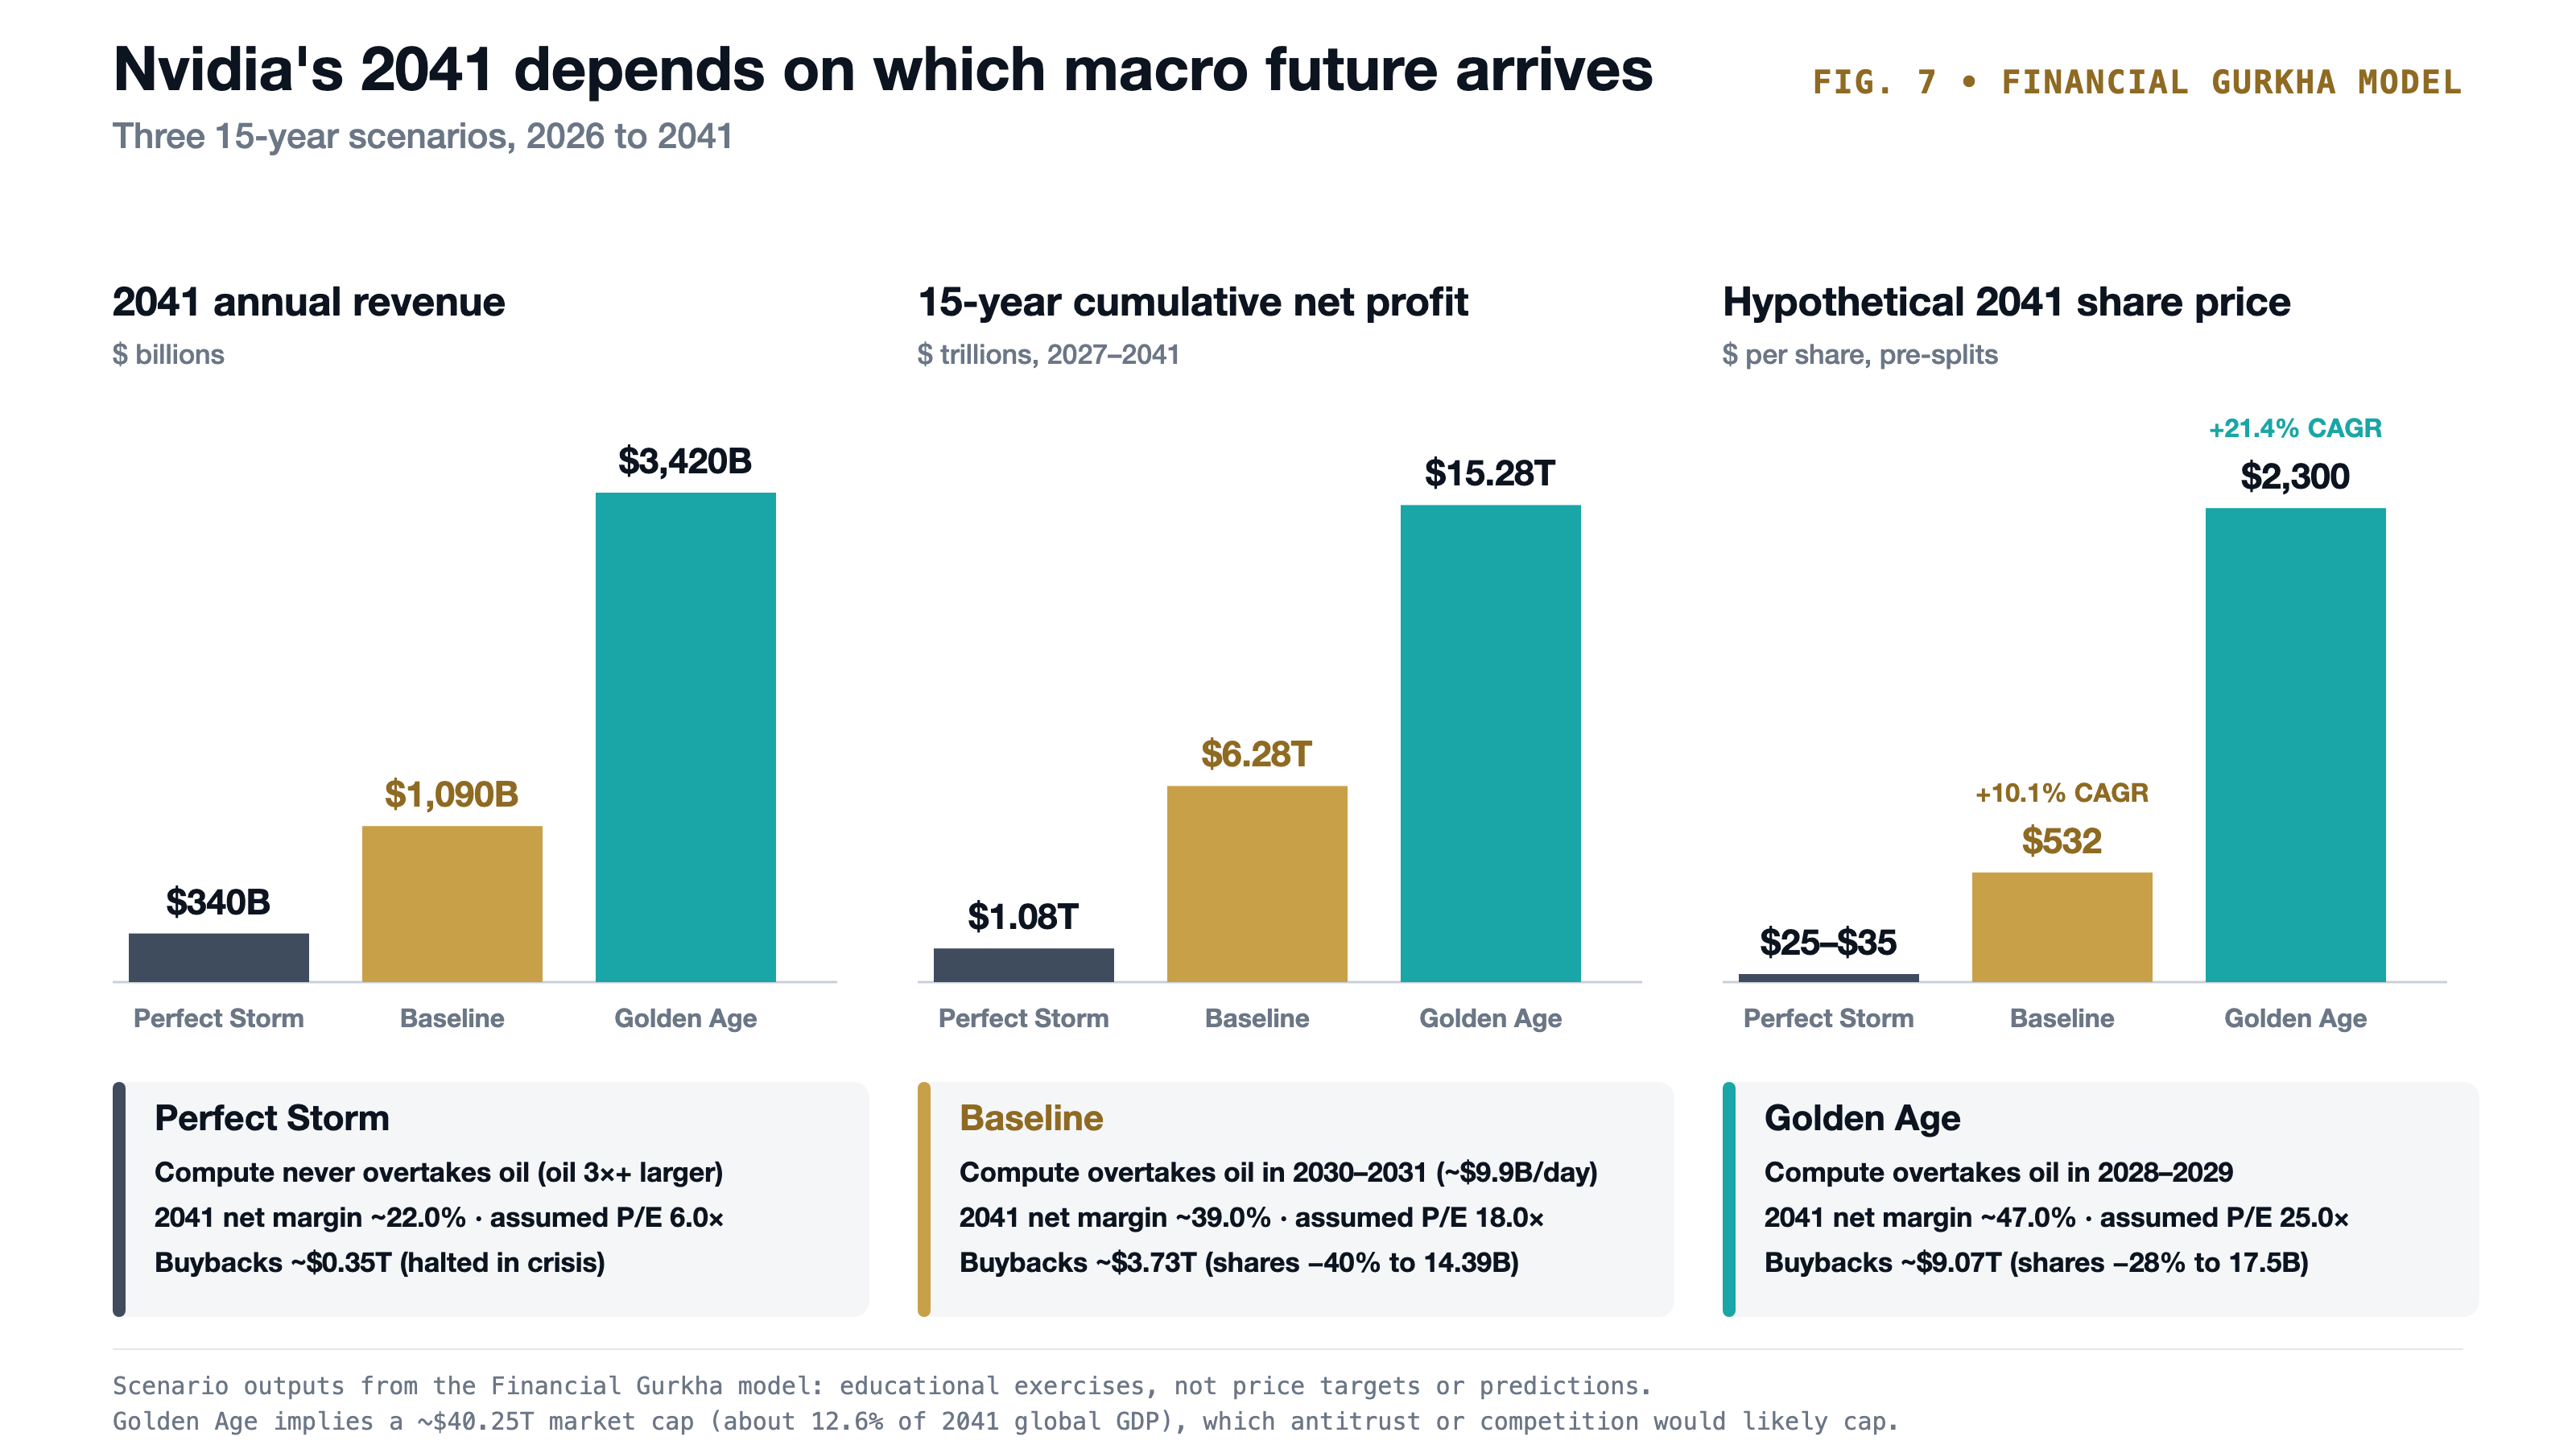
FIG. 7 · Financial Gurkha model. Three macro futures for Nvidia. These are educational scenario outputs, not price targets or predictions.
(Sanity check: A $2,300 share price on 17.5B shares equals a ~$40.25T market cap—nearly 58% of U.S. GDP or 12.6% of global GDP in 2041—illustrating that in a true Golden Age, antitrust pressure or competitor share gains would likely cap a single company before reaching that concentration.)
B. U.S. GDP, Household Income, Wages, Global GDP & U.S. National Debt (2026 → 2041)#
Anchored to 2026 baselines: $32.38T U.S. GDP and $128.00T World GDP (IMF WEO), ~$89,650 U.S. median household income (U.S. Census Bureau), $38.00/hr average private hourly pay (BLS), and $32.85T federal debt held by the public / $40.68T gross debt (U.S. Treasury).
| Macro / Household Indicator (2041) | 2026 Start | 2041 Baseline (CBO Trend) | 2041 "Golden Age" (6 Tailwinds) | 2041 "Perfect Storm" (6 Shocks) |
|---|---|---|---|---|
| U.S. Nominal GDP | $32.38T | $57.79 Trillion | $69.13 Trillion | $144.32 Trillion (Inflation mirage) |
| U.S. Real GDP (Constant 2026 $) | $32.38T | $42.56T (+31.4%) | $52.80T (+63.1%) | $36.26T (+12.0% stagnation) |
| U.S. Median Household Income (Nominal / Real) | ~$89,650 | $142,170 / $105,640 (+17.8%) | $167,210 / $127,950 (+42.7%) | $347,370 / $83,160 (-7.2%) |
| U.S. Median Full-Time Wage (Nominal / Real) | ~$65,050 | $103,160 / $76,650 (+17.8%) | $121,330 / $92,850 (+42.7%) | $252,060 / $60,340 (-7.2%) |
| U.S. Avg Private Hourly Pay (Nominal / Real) | $38.00/hr | $60.26 / $44.78/hr (+17.8%) | $70.88 / $54.24/hr (+42.7%) | $147.24 / $35.25/hr (-7.2%) |
| World Real GDP (Constant 2026 $) | $128.00T | $192.60T (+50.5%) | $231.91T (+81.2%) | $152.36T (+19.0%) |
| China Real GDP (Constant 2026 $) | $21.55T | $36.63T (+70.0%) | $43.54T (+102.0%) | $25.77T (+19.6%) |
| European Union Real GDP (Constant 2026 $) | $22.81T | $27.69T (+21.4%) | $33.52T (+47.0%) | $24.22T (+6.2%) |
| India Real GDP (Constant 2026 $) | $4.06T | $10.01T (+146.5%) | $12.01T (+195.9%) | $7.10T (+75.0%) |
| U.S. Debt Held by Public ($ / % of GDP) | $32.85T (101.5%) | $80.34T (139.0%) | $59.03T (85.4%) | $366.97T (254.3%) (Spiral) |
| U.S. Gross National Debt ($) | $40.68T | $90.13 Trillion | $68.12 Trillion | $379.17 Trillion |
| 2041 Federal Net Interest Cost ($ / % GDP) | ~$1.05T (3.2%) | $3.54T (6.1%) | $1.77T (2.6%) | $64.22T (44.5%) |
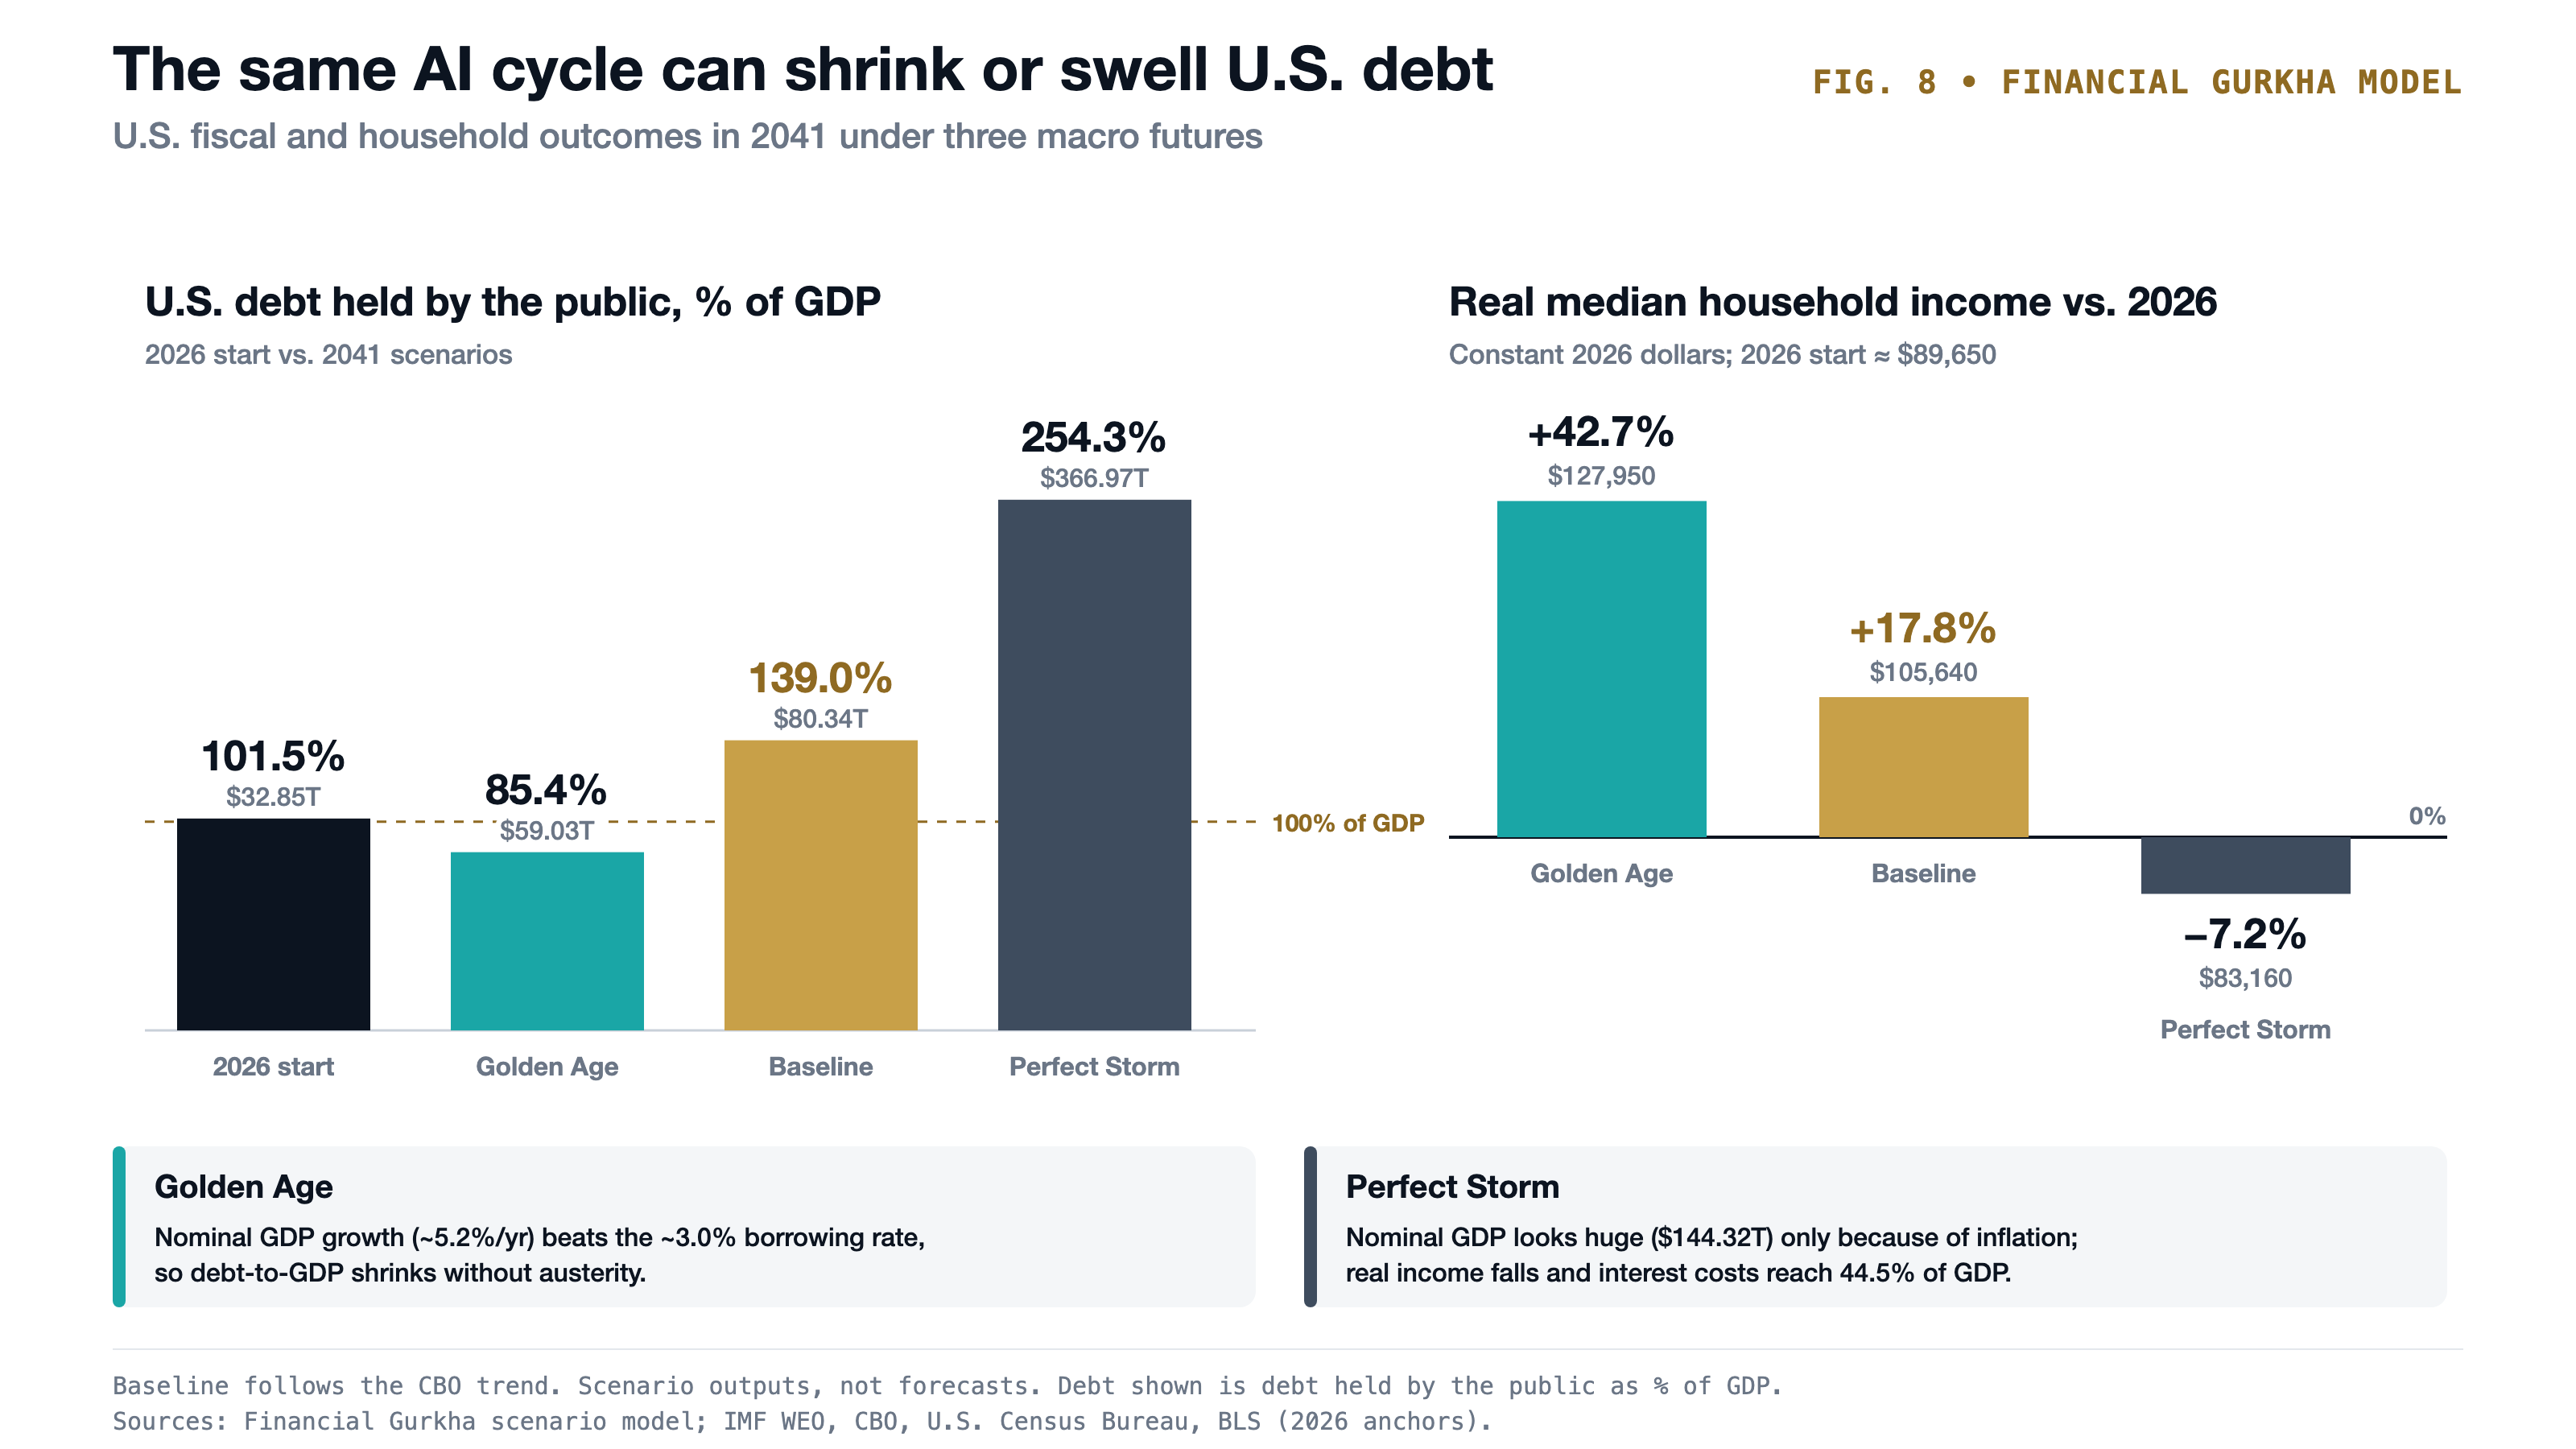
FIG. 8 · Financial Gurkha model. U.S. debt held by the public (% of GDP) and the change in real median household income by 2041 under each scenario.
Why the Fiscal and Household Math Flips#
- In the Golden Age: Nominal GDP growth (~5.2%/year) exceeds the government’s ~3.0% borrowing rate, causing the U.S. debt-to-GDP ratio to shrink naturally from 101.5% down to 85.4% without austerity, while real household purchasing power rises +42.7% (+$38,300 in today's dollars).
- In the Perfect Storm: Because roughly one-third of U.S. marketable Treasuries mature every 12 months (Senate JEC), pushing yields toward 20% triggers a compounding interest-rate doom loop—breaching the Penn Wharton Budget Model’s ~210% sustainability ceiling by 2039 and forcing Federal Reserve yield-curve monetization, while real worker wages fall -7.2%.
Frequently Asked Questions#↑ Contents
When will global compute spending surpass crude oil spending?
In our Baseline model, global spending on data center hardware and cloud infrastructure (IaaS) crosses daily crude oil spending between 2030 and 2031 at roughly $9.9 billion/day. In an accelerated AI "Golden Age," crossover occurs as early as 2028–2029; in a "Perfect Storm" CapEx freeze, it never happens.
Why does a 5% DCF value Nvidia at $12 trillion while the market prices it at $3 trillion?
A 5.0% discount rate approximates a near-risk-free Treasury hurdle rate. Following co-founder Jensen Huang’s November 2026 resignation and an SEC governance inquiry, public equity investors are demanding a 12%–14% discount rate to compensate for leadership uncertainty, Taiwan foundry concentration, and $508B in off-balance-sheet commitments and guarantees.
How can Nvidia’s stock price quadruple by 2041 if its profit margins compress?
Two forces offset margin compression: first, global compute volume expands nearly 6×, lifting Nvidia’s baseline revenue past $1 trillion/year; second, retiring ~40% of its share count through ~$3.73 trillion in cumulative buybacks triples Earnings Per Share even as net profit margins normalize from 56.4% to ~39.0%.
What is the single biggest risk to the 15-year compute thesis?
Interest rates and physical chokepoints. Moving from a 5% discount rate to a 1980s-style 20% rate destroys roughly 75%–85% of long-duration equity present value mathematically, while a Taiwan Strait conflict would physically sever TSMC wafer supply regardless of AI demand.
Conclusion and Key Takeaways#↑ Contents
- Compute is graduating from tech sector to macro utility. By the early 2030s, daily capital and rental outlays for digital intelligence will rival the daily global bill for crude petroleum.
- Nvidia’s second act is capital return, not monopoly margins. Investors should expect gross margins to compress toward ~58% over 15 years—but if governance stabilizes, Nvidia’s asset-light cash generation and $227.3B buyback program make it one of the most powerful per-share compounders in corporate history.
- Macro regime selection matters more than chip architecture. Over a 15-year horizon, whether the world lands in a 2%-inflation AI productivity boom or a 20%-yield stagflationary supply shock determines not only Nvidia’s valuation multiple, but whether U.S. living standards rise by +43% or fall by -7% and whether federal debt stabilizes at 85% of GDP or spirals past 250%.
Methodology and Primary Sources#↑ Contents
Every historical figure is drawn from primary filings and official statistical agencies. Projections from 2027 to 2041 represent Financial Gurkha scenario modeling built on explicit arithmetic (daily spend = annual spend ÷ 365; FCF = net income × conversion rate; real GDP and wages deflated by cumulative scenario CPI/PCE paths; debt dynamics modeled via primary deficit + effective interest rate on rolling maturities).
Primary Sources#
- NVIDIA Corporation: Q3 FY2027 Form 10-Q, Earnings Release, CFO Commentary, and Supplemental Financial Information (Nov 17, 2026). investor.nvidia.com / sec.gov
- Gartner, Inc.: Worldwide IT Spending Forecasts (July & October 2026) and Worldwide AI Spending Forecast (January & November 2026). gartner.com
- U.S. Energy Information Administration (EIA) & International Energy Agency (IEA): Short-Term Energy Outlook (STEO, November 2026), Europe Brent Spot Price History, and IEA Oil Market Report / Energy and AI Reports. eia.gov / iea.org
- International Monetary Fund (IMF) & Congressional Budget Office (CBO): World Economic Outlook Database (October 2026) and CBO Long-Term Budget & Economic Outlook (2026–2036). imf.org / cbo.gov
- U.S. Department of the Treasury, U.S. Census Bureau & Bureau of Labor Statistics (BLS): Debt to the Penny (November 2026), Income in the United States Report, and Employment Situation Table B-3 (October 2026). fiscaldata.treasury.gov / census.gov / bls.gov