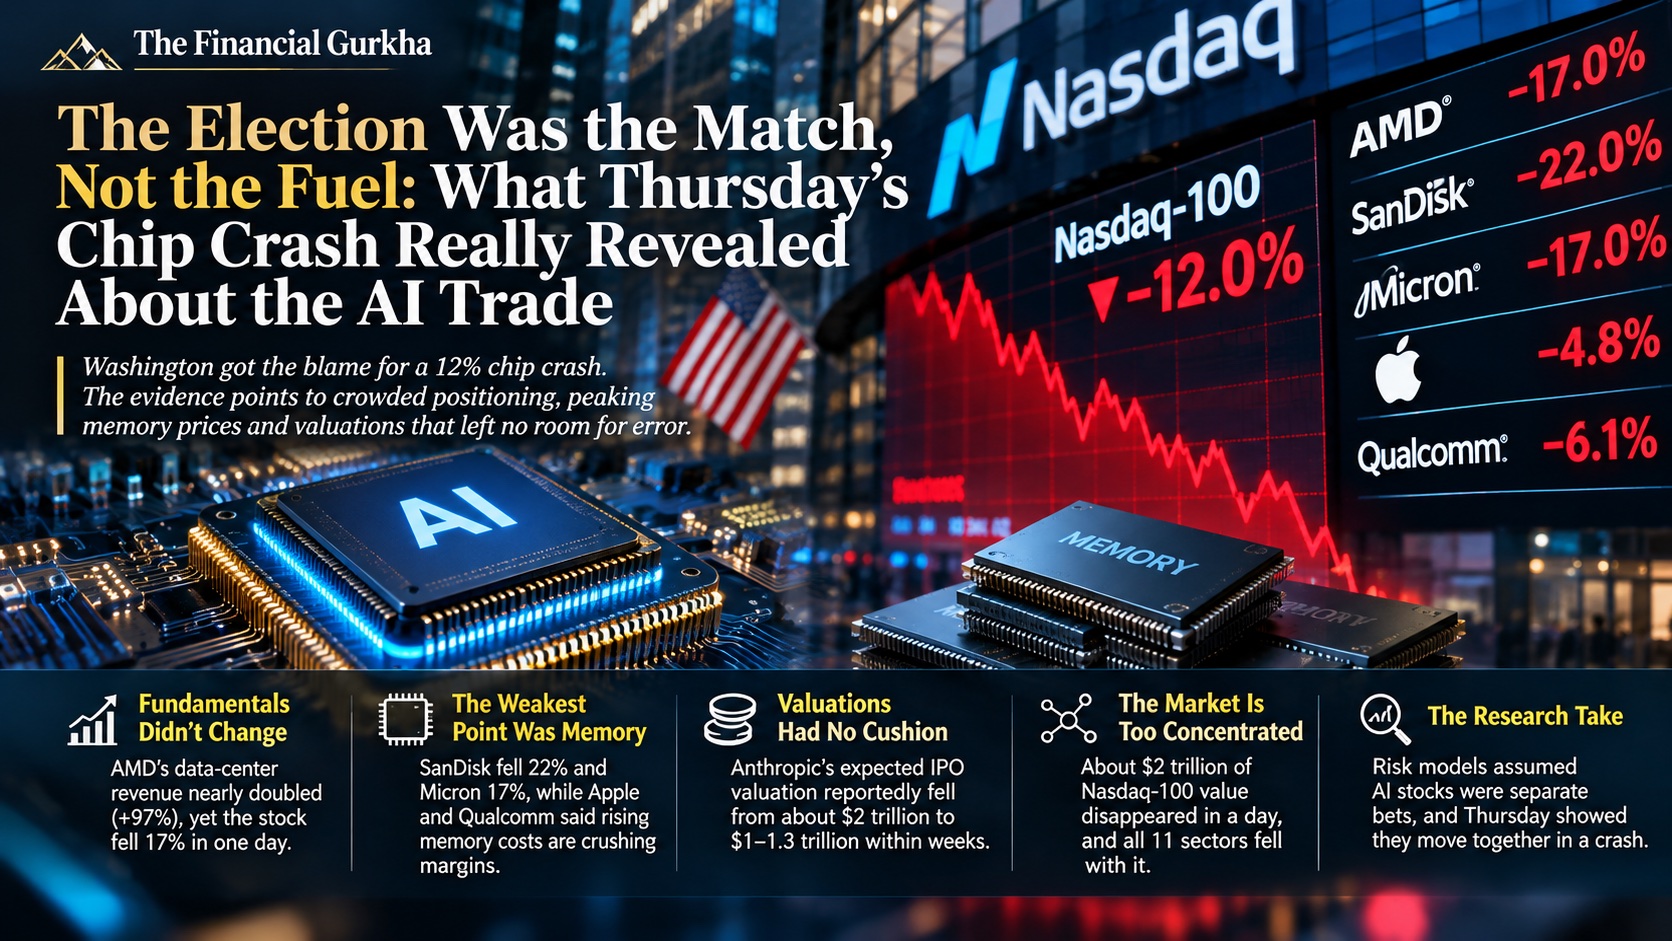
MARKETS · SEMICONDUCTORS · POSITIONING · TAIL RISK
By Niraj Neupane, CA (ICAI) Quantitative Researcher, Korvane · Financial Economist, Calderyn Institute · Founder, Wall Street Feed
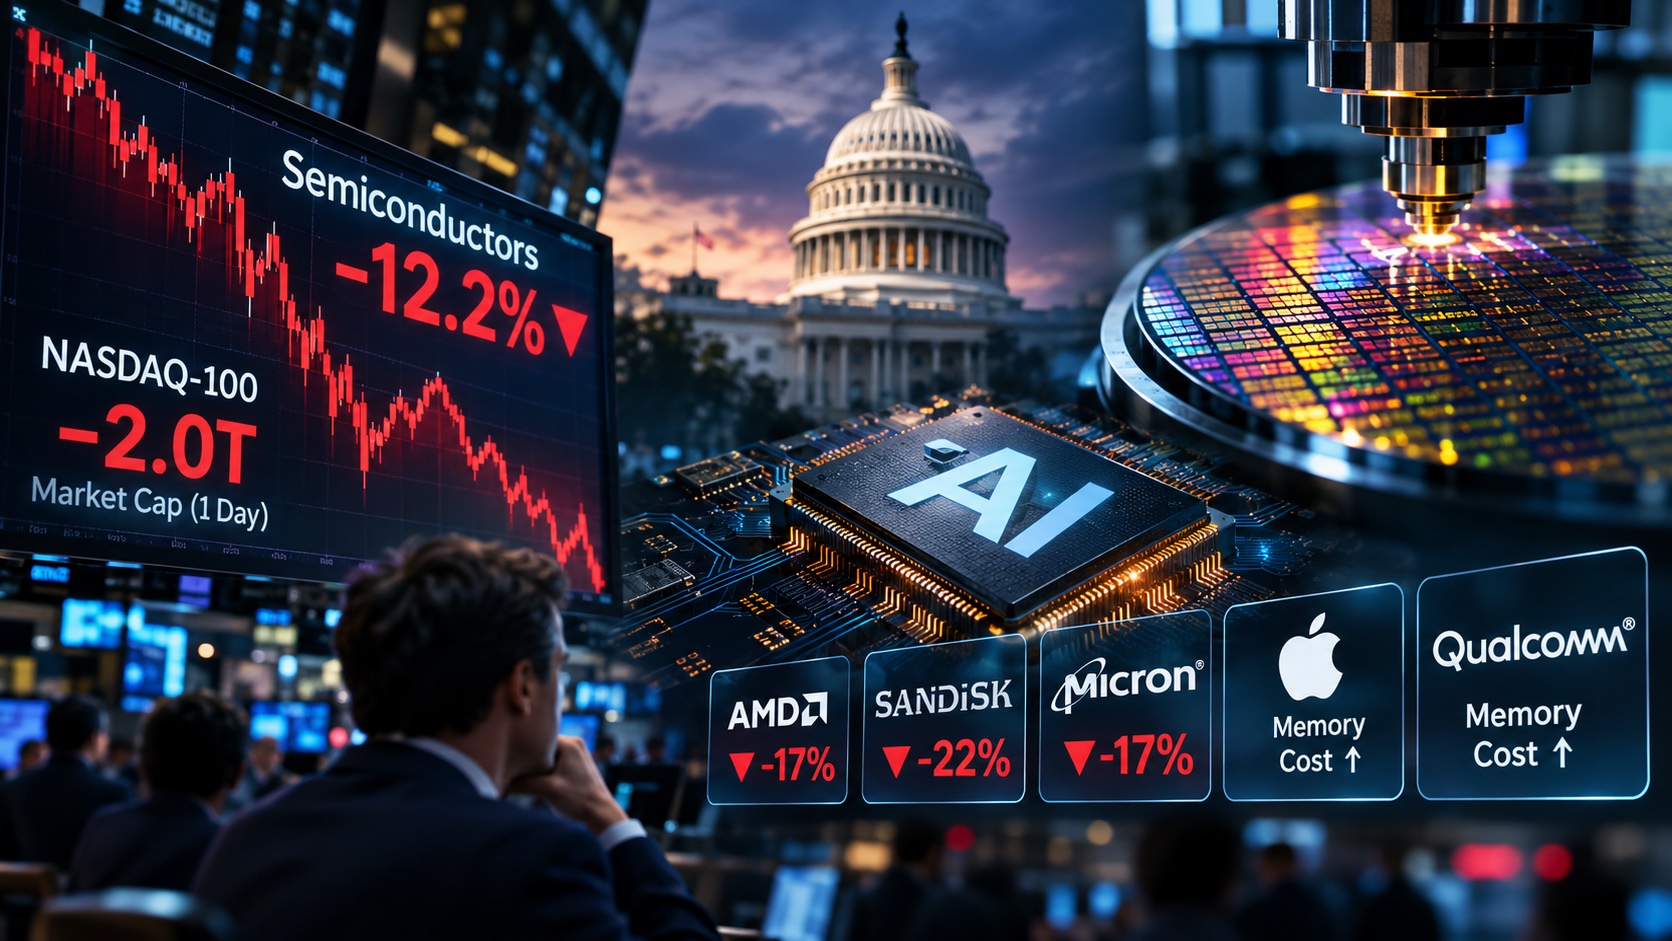
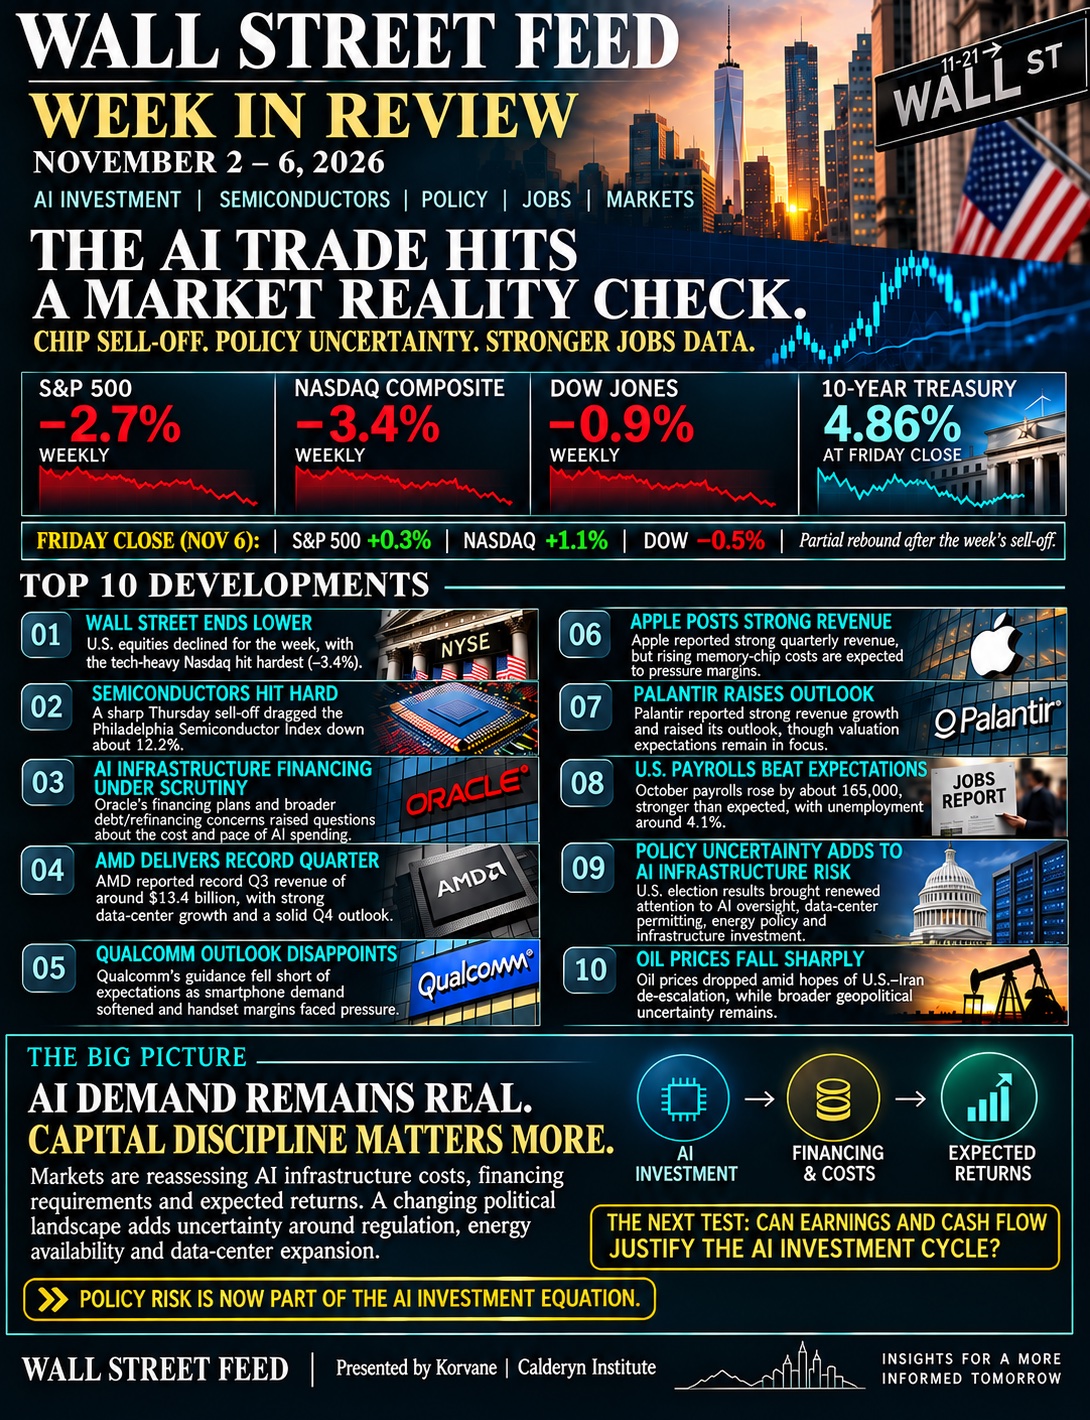
On Wednesday, November 4, the Dow had its best post-midterm session since 1982, up about 3%. On Thursday the Philadelphia Semiconductor Index (SOX) fell 12.25%, the second-worst day in its history. The Nasdaq Composite dropped 5.5% into correction territory, its worst session since April 2025. Roughly $2 trillion came off the Nasdaq-100. Not one of the eleven S&P 500 sectors finished higher.
The explanation most desks reached for by lunchtime was the election: a shift in the policy outlook for AI data centers. That was the catalyst, and I don't dispute it. But a catalyst only tells you when a market moves. It tells you very little about how far it moves, or which stocks take the damage. Those answers come from what was already in the market before anyone voted.
That is the argument of this piece. The policy headline lit the match. The fuel was positioning, valuation and a memory cycle that is now pricing its own customers out of their margins. Each of those can be tested against the data, and I try to do that below, including where the evidence cuts against me.
What's in this report#
- 1. The tape
- 2. Where the damage landed
- 3. The Friday test
- 4. The AMD paradox: when the numbers stop mattering
- 5. The memory squeeze: one company's price is another's cost
- 6. Valuation and rates: a stronger economy is not good news for everyone
- 7. Crowding: why different businesses fell as one
- 8. What the risk models missed
- 9. The steelman: what if the policy story is right?
- 10. Oil: the quieter macro story
- 11. Bull case, bear case
- 12. What I'm watching
- The bottom line
1. The tape#↑ Contents
| Index | Close, Fri Nov 6 | Thursday | Week |
|---|---|---|---|
| Nasdaq Composite | 24,579.42 | −5.52% | −3.4% |
| S&P 500 | 7,376.86 | −4.36% | −2.7% |
| Dow Jones Industrial Average | 51,285.73 | −3.44% (−1,833 pts) | −0.9% |
| Philadelphia Semiconductor Index | n/a | −12.25%, to 9,011.14 | n/a |
| Nasdaq-100 | n/a | −6.3% | n/a |
| VIX | 25.64 | up as much as 65%, to 27.45 | n/a |
| 10-year Treasury yield | ≈ 4.86% | short-end yields −12bp | n/a |
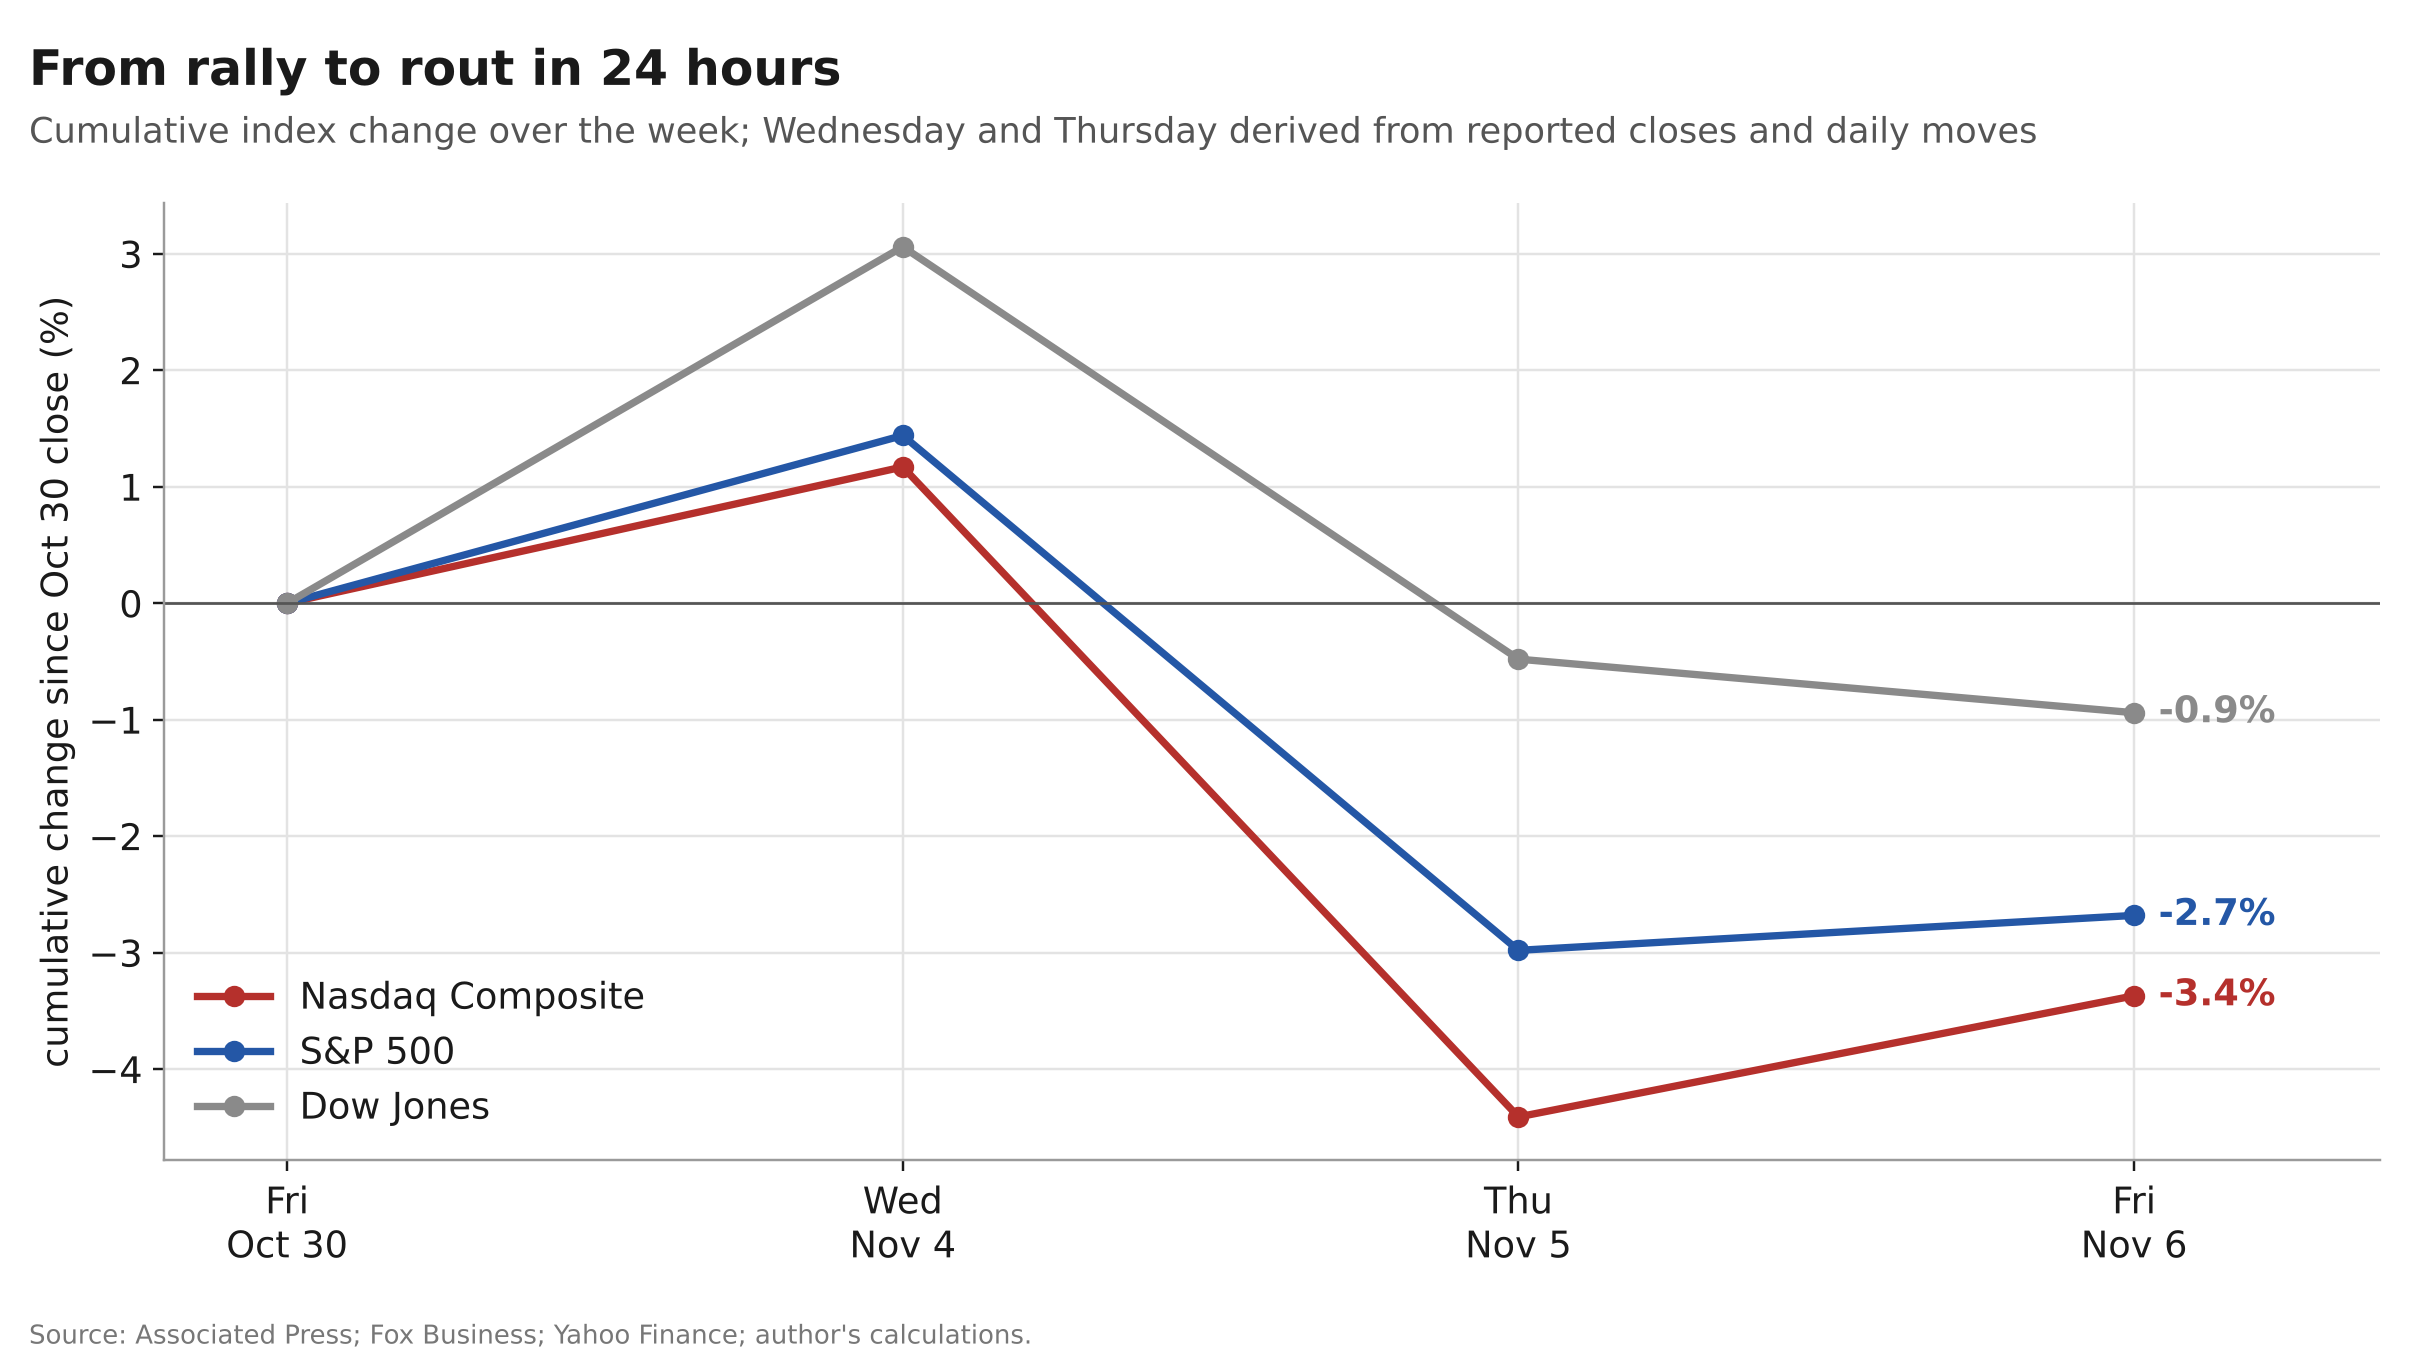
Two details in that table matter more than the headline numbers.
First, the size of the reversal. When a market rallies 3% and then gives back more than that the next day, new information is rarely the whole story. Election outcomes are binary. Positioning ahead of a binary event tends to be one-sided, and one-sided books unwind violently when the second-order reading of the result turns out worse than the first.
Second, the gap between the Dow and the Nasdaq. For the week the Dow lost 0.9% and the Nasdaq lost 3.4%. This was not a macro deleveraging where everything is sold equally. It was concentrated in one theme, and within that theme it was concentrated further. A market-wide shock does not look like that. A crowded factor unwinding does.
2. Where the damage landed#↑ Contents
| Segment | Names | Thursday |
|---|---|---|
| Memory | Sandisk, Micron | −22%, −17% |
| Chip designers | AMD, Marvell, Nvidia | −17%, −17%, −9.3% |
| Data-center operators | IREN, Applied Digital, Nebius | each worse than −14% |
| Power equipment | GE Vernova, Constellation | lower |
| Other high-beta tech | Tesla | −10.8% |
| Crypto | Bitcoin | about −6% |
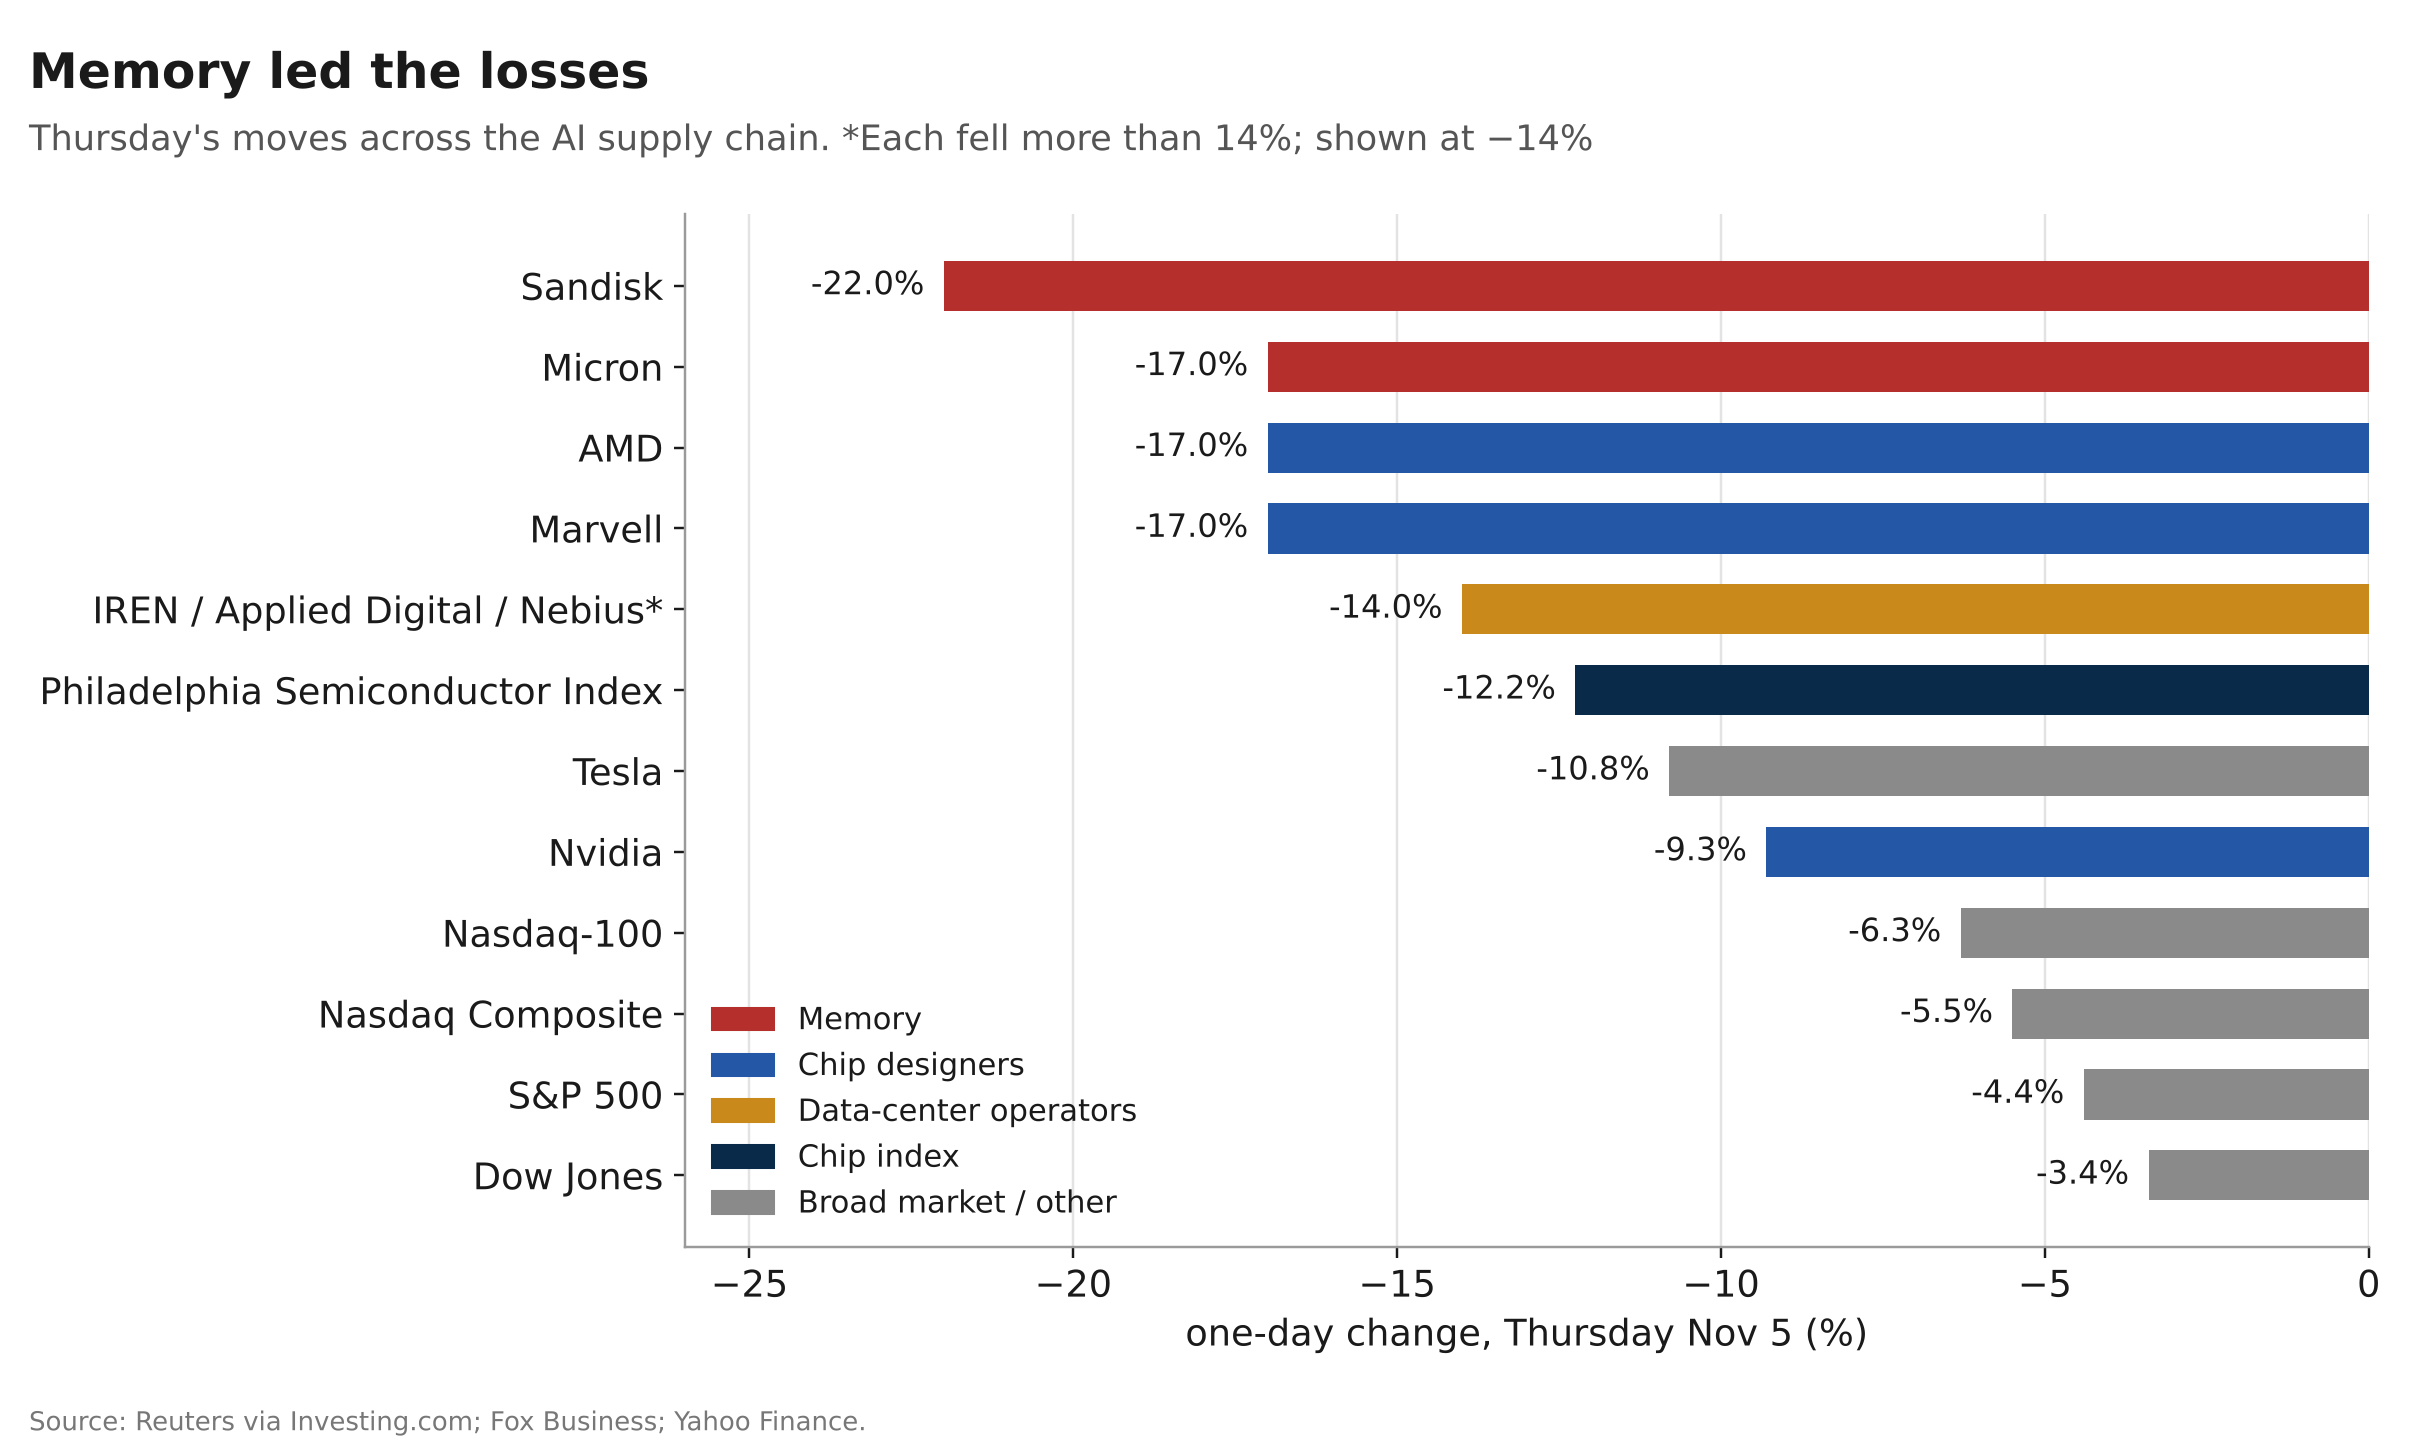
If the policy story were the main driver, the ordering in this table should look different. The companies most directly exposed to a slower data-center build-out are the operators and the power suppliers. They fell hard, but they did not lead. Memory did. Sandisk, which builds NAND flash, fell more than any operator. Nvidia, the most AI-exposed large-cap on the planet, fell less than half as much as Sandisk.
The ranking points to something specific to memory, and to the most leveraged corners of the trade, not just a blanket repricing of "AI."
3. The Friday test#↑ Contents
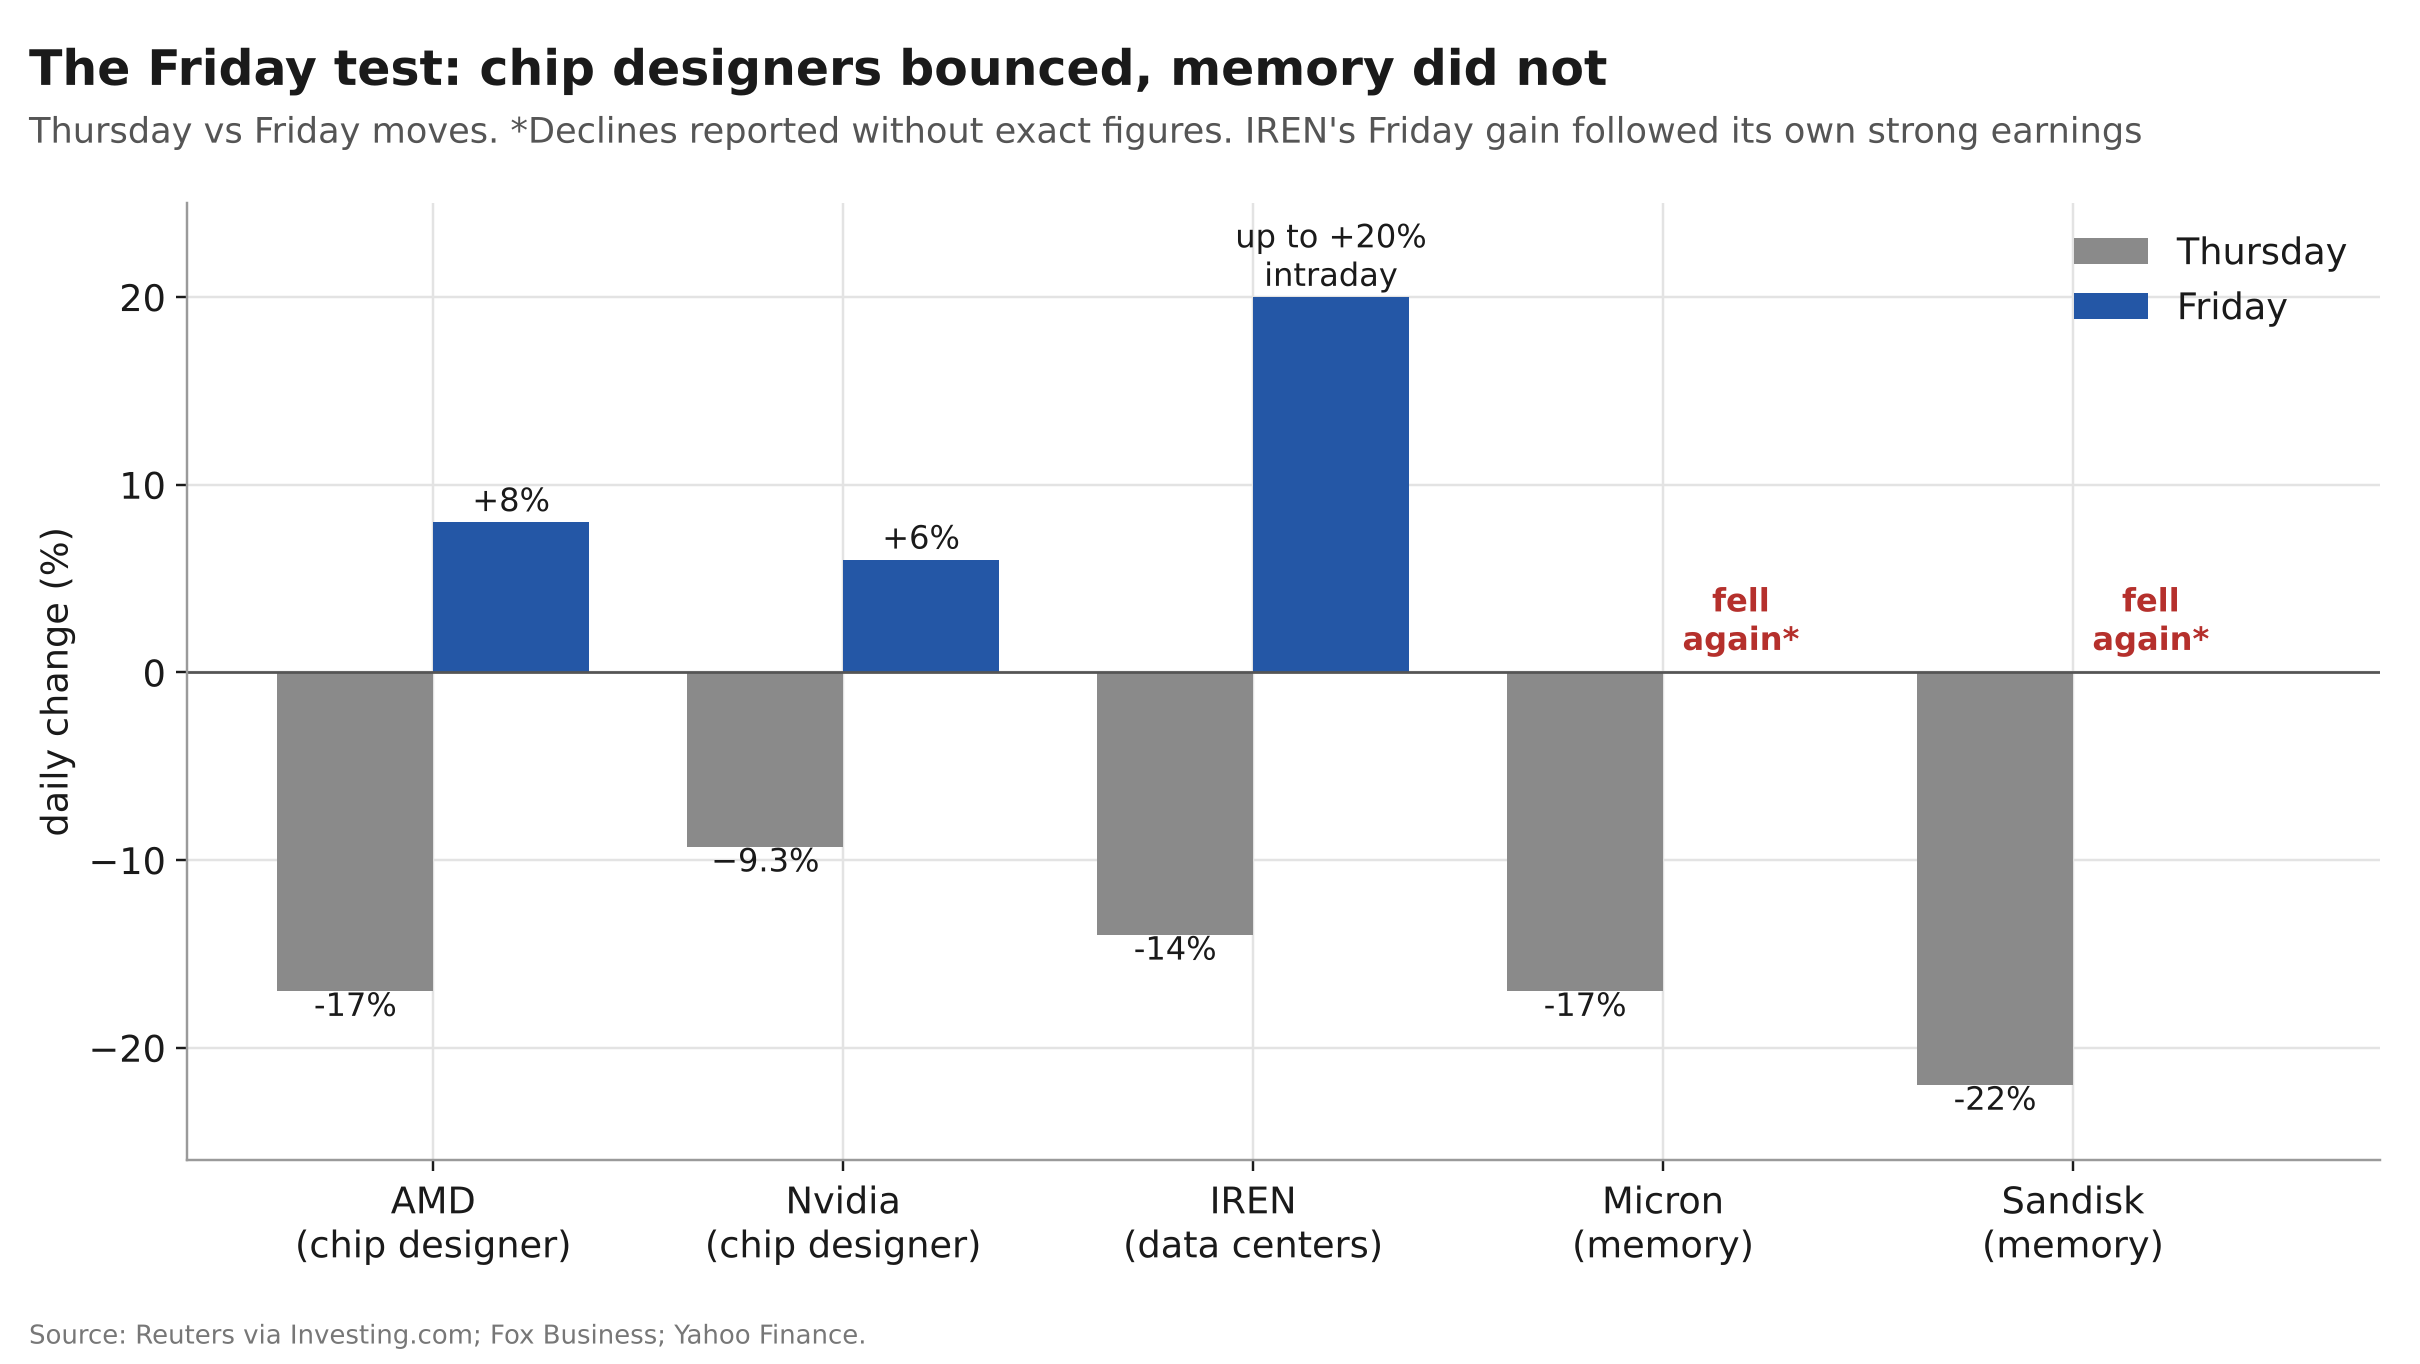
A narrative is only useful if it makes predictions. So here is a simple one. If Thursday was mainly about policy risk to data-center spending:
- Data-center operators, the most policy-exposed names, should have stayed down on Friday.
- Memory makers, one step removed from the policy question, should have bounced with the rest of the chip complex.
| Stock | Thursday | Friday |
|---|---|---|
| AMD | −17% | +8% |
| Nvidia | −9.3% | +6% |
| Intel | n/a | +6% |
| IREN | worse than −14% | up as much as +20% intraday |
| Micron | −17% | fell again |
| Sandisk | −22% | fell again |
| SOX | −12.25% | +4% |
The market did roughly the opposite of what the policy story predicts. Chip designers bounced. Memory kept falling.
I need to be honest about the weak point in this test. IREN's Friday jump came after its own earnings, which showed strong AI cloud revenue. That is a stock-specific catalyst, and it contaminates the comparison. A fair reading is narrower: data-center operators were able to rally hard on good company news the very next day, which is hard to square with a market that had decided the policy outlook had fundamentally broken their business model. The memory side of the test has no such contamination. Micron and Sandisk had no reason to fall again on Friday except the one I discuss in Section 5.
Two trading days is evidence, not proof. But it points away from the consensus explanation.
4. The AMD paradox: when the numbers stop mattering#↑ Contents
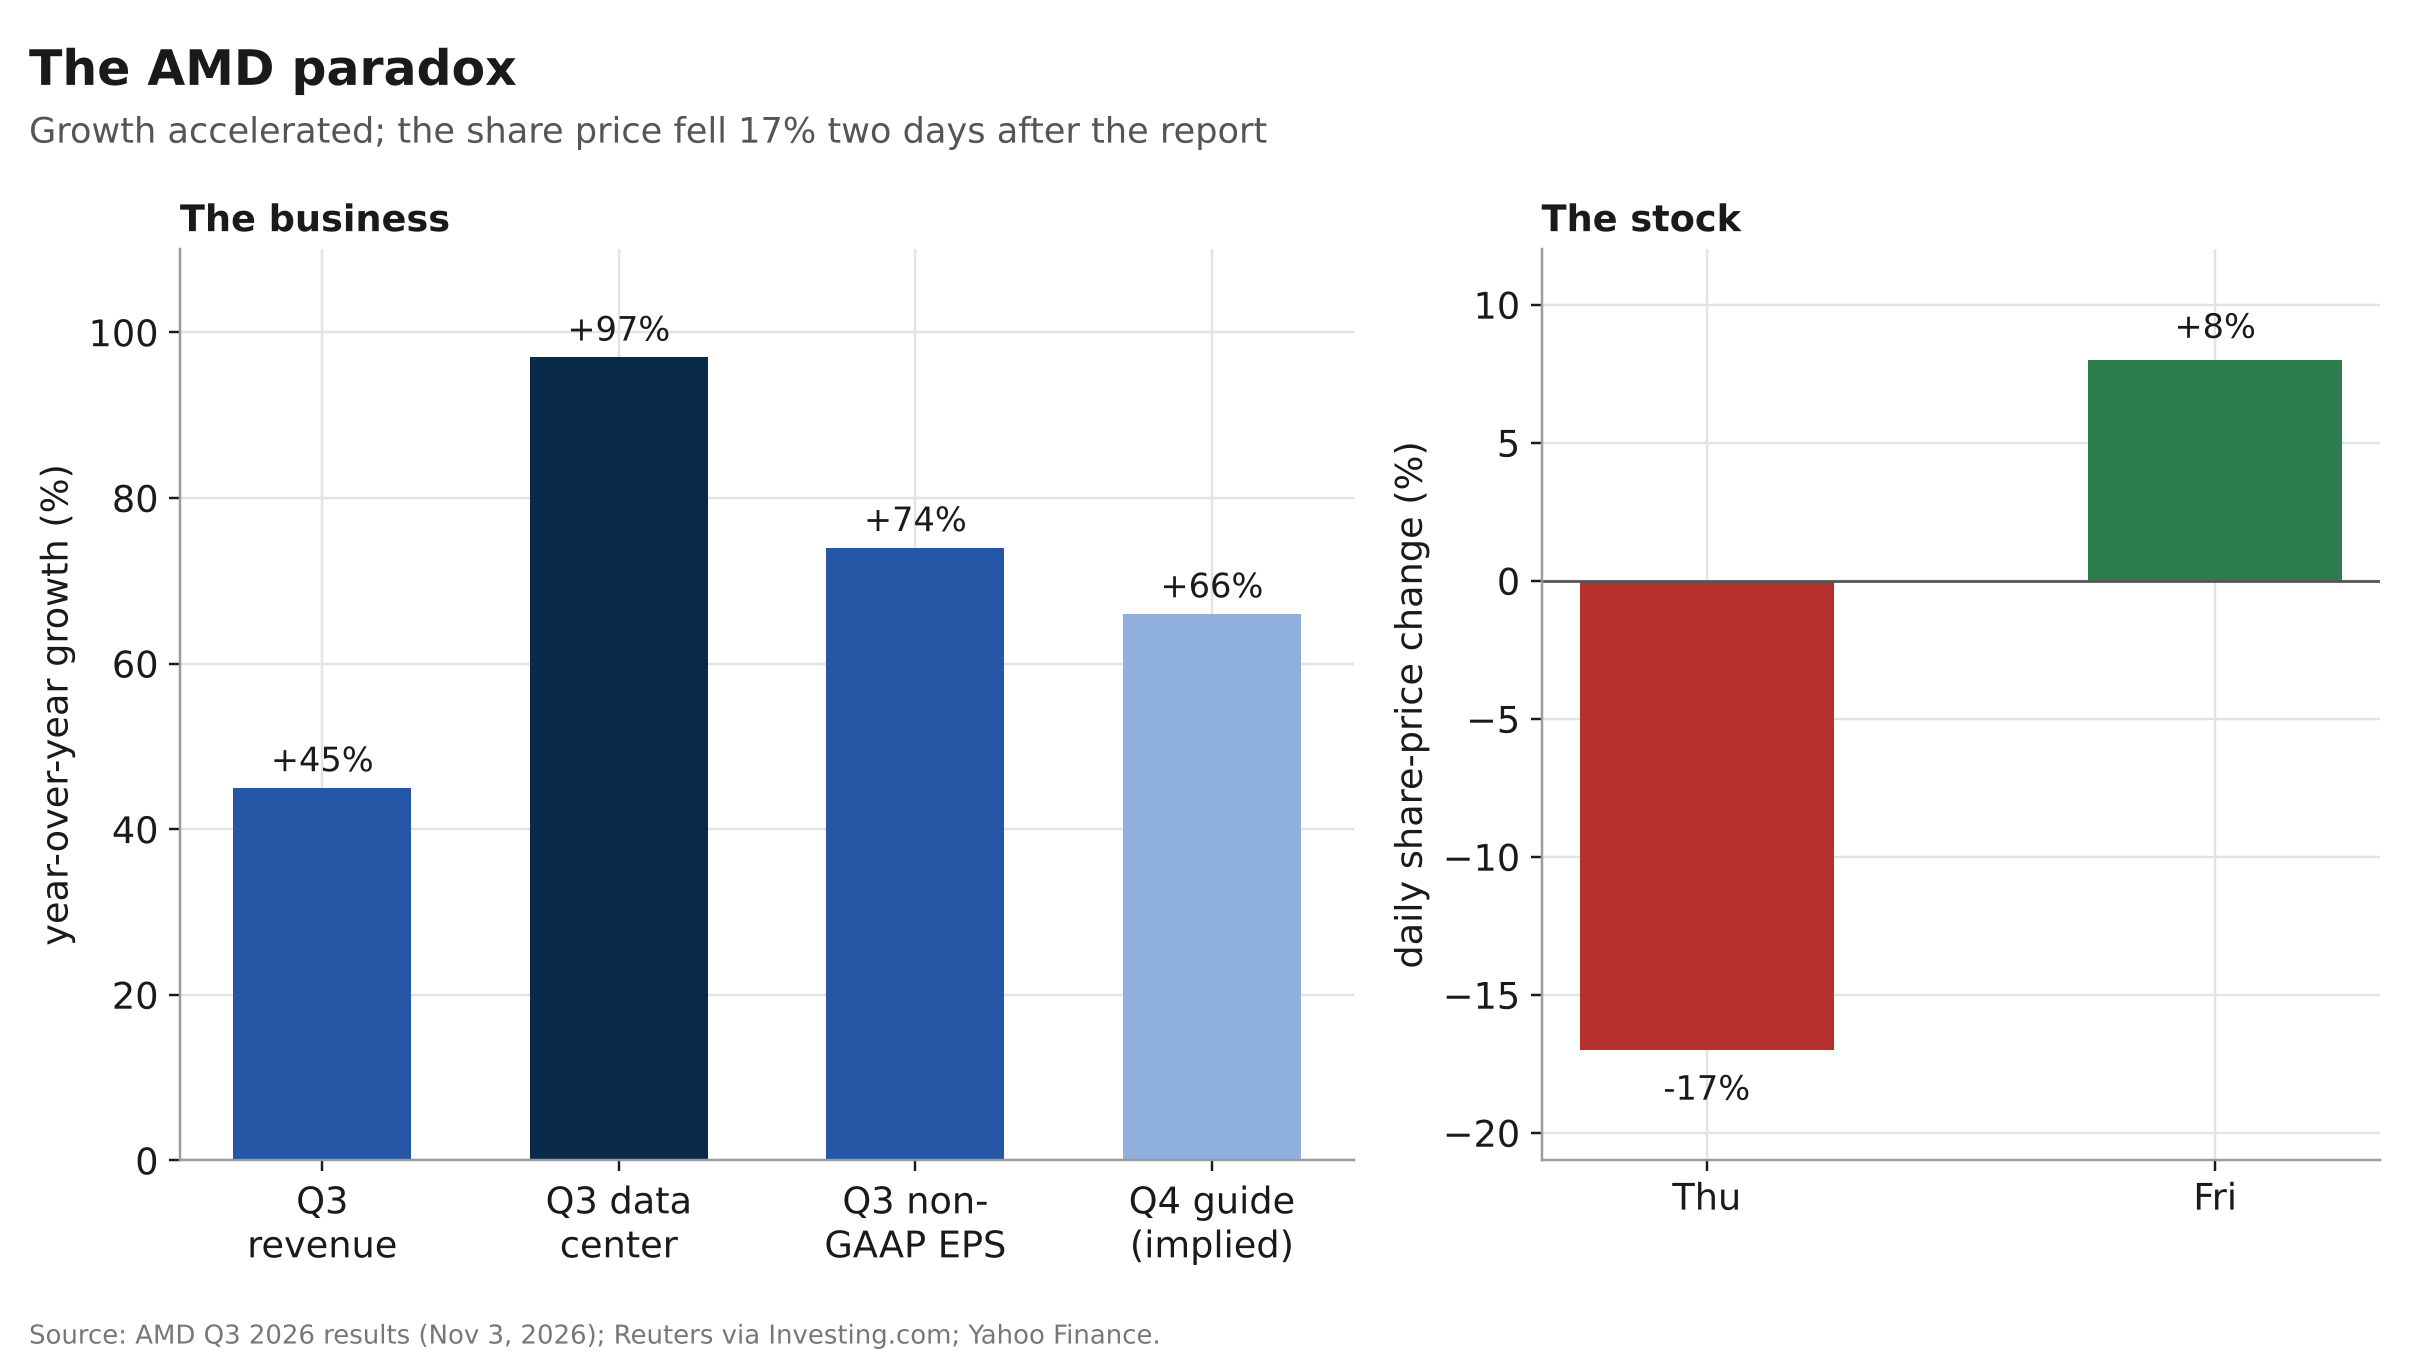
AMD reported on Tuesday evening. By any normal standard, the quarter was excellent.
| AMD, Q3 2026 | Result |
|---|---|
| Revenue | $13.4B, +45% year over year |
| Data-center revenue | $8.5B, +97% |
| Non-GAAP EPS | $2.09, +74% |
| Q4 revenue guide | about $17B (±3%), implying about +66% |
| Stock, Thursday | −17% |
Palantir told a similar story the same week: revenue up 96%, U.S. commercial revenue up 148%, full-year outlook raised.
When a company accelerates and the stock still falls 17% two sessions later, the market is not repricing the business. It is repricing the people who own it. A stock that is held by the same momentum-sensitive funds as every other AI name will trade with those funds, whatever its own income statement says. That is the cleanest evidence we have that Thursday was a positioning event first and a fundamental event second.
There is a harder version of this point. If even a 97% growth print cannot defend a stock, then the market had already priced something better than 97%. That is not a demand problem. It is an expectations problem, and expectations problems are solved by price, not by the next earnings report.
5. The memory squeeze: one company's price is another's cost#↑ Contents
This is the part of the week I think most commentary missed.
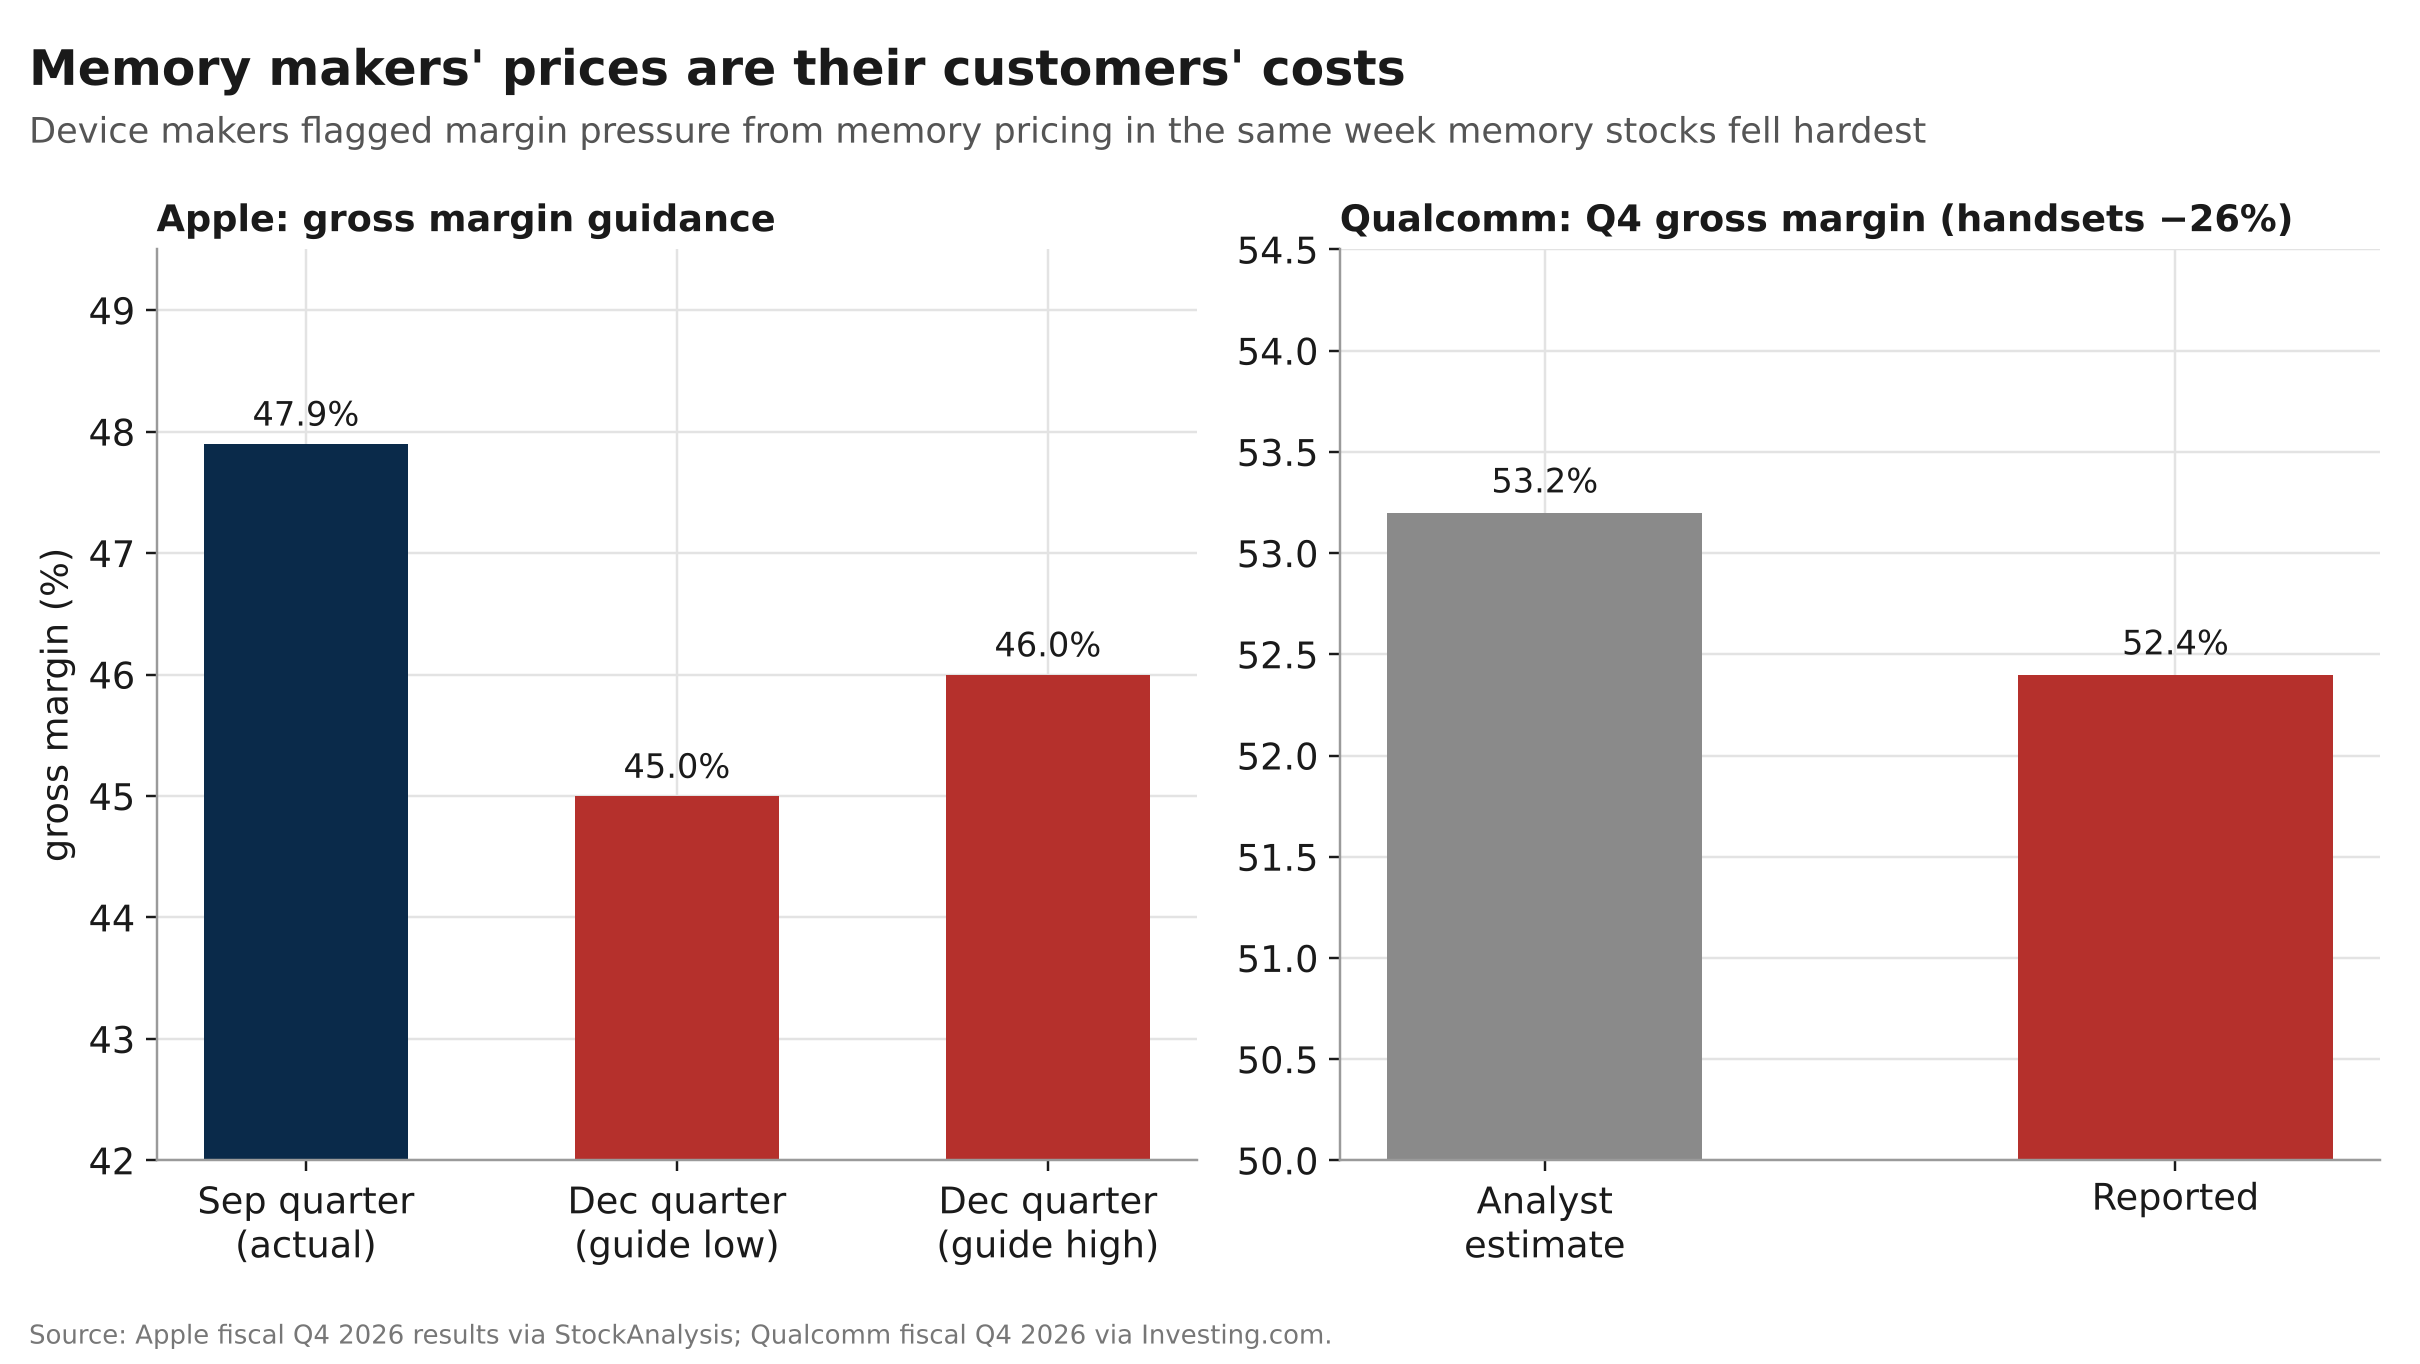
The AI build-out has turned memory, DRAM, high-bandwidth memory and NAND alike, into a scarce input. That has been extraordinarily profitable for Micron and Sandisk. But a memory maker's revenue is its customer's cost of goods, and this week the customers started to say so out loud.
| Customer | What it reported |
|---|---|
| Apple | December-quarter gross margin guided to 45–46%, down from 47.9%. Management called memory pricing "unprecedented," said costs will keep rising after December, and said memory constraints will limit Mac and iPad supply |
| Qualcomm | Handset revenue −26% to $5.14B. Gross margin 52.4% vs a 53.2% estimate, with wafer, packaging and memory costs all cited |
Read those together and you get three distinct signals:
- Margin compression. Apple is absorbing roughly 200bp of gross margin at the midpoint.
- Volume loss. Qualcomm's handset business is shrinking sharply.
- Rationing. Apple is limiting supply of finished products because it cannot source the components on acceptable terms.
The third one is the most important. Memory has historically been the most cyclical sub-industry in semiconductors, and its cycles end in a familiar way. Pricing power rises until customers stop treating the input as a cost to pass through and start treating it as a constraint to design around. Rationing finished products is one step from redesigning them.
I am not calling the top of the memory cycle. Hyperscaler demand for high-bandwidth memory could easily absorb whatever consumer electronics gives back. But the market's job is to price the probability of a turn, and this week the probability went up. Micron and Sandisk falling again on a day the rest of the sector rallied 4% is exactly what you would expect if investors were doing that arithmetic.
6. Valuation and rates: a stronger economy is not good news for everyone#↑ Contents
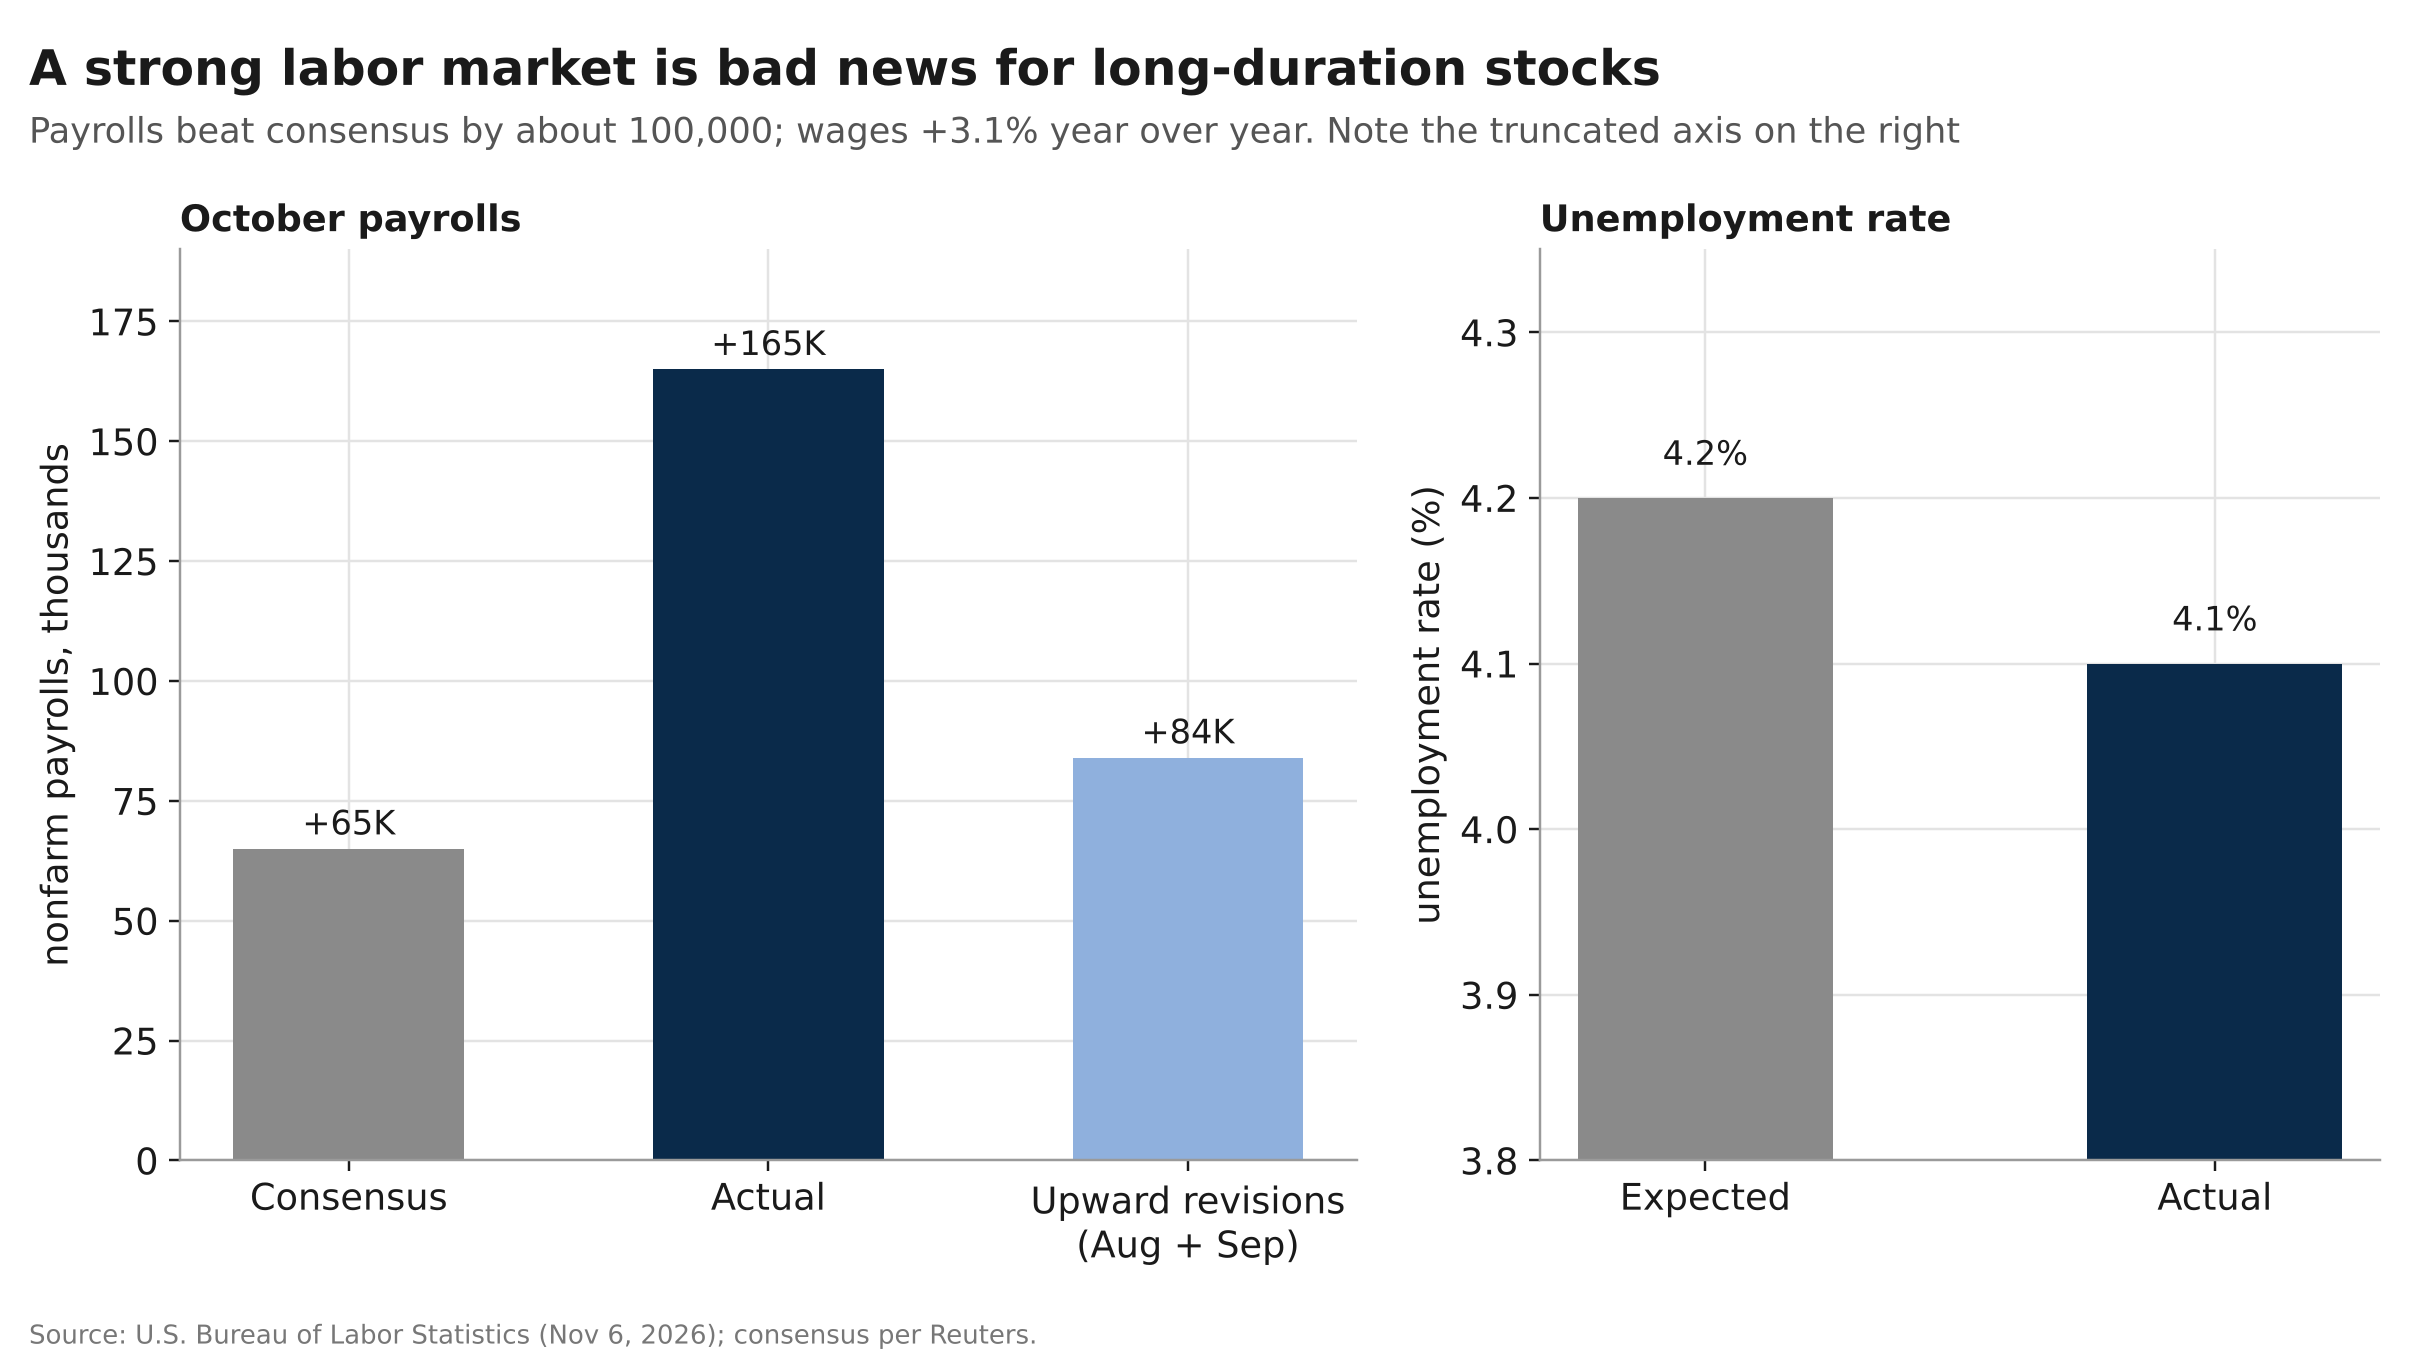
| October jobs report | Actual | Expected |
|---|---|---|
| Nonfarm payrolls | +165K | ~65K |
| Revisions to prior two months | +84K | n/a |
| Unemployment rate | 4.1% | 4.2% |
| Average hourly earnings, YoY | +3.1% | n/a |
For the economy, this is a good report. For long-duration equities, it is a problem.
The logic is simple and unforgiving. Most of the value in an AI-exposed stock sits in cash flows expected five, ten, fifteen years out. Those cash flows are discounted at a rate anchored to Treasury yields. A labor market strong enough to keep a December rate hike on the table, with the 10-year near 4.86%, raises that discount rate at exactly the point where valuations assumed it would fall.
A rough illustration: for a stock whose value behaves like a 20-year-duration asset, a 25bp rise in the discount rate takes about 5% off fair value, with nothing changing in the business. Rates markets are pricing only about 40bp of further tightening. If CPI comes in hot, that number has room to move, and the market has not fully priced it.
The private market is sending the same signal. Reports this week put Anthropic's IPO valuation at about $1–1.3 trillion, well below the roughly $2 trillion that had been discussed. Private marks move slowly and reluctantly. When they move down, public valuations built on similar assumptions tend to follow.
7. Crowding: why different businesses fell as one#↑ Contents

Consider what fell together on Thursday: a NAND maker, a GPU designer, a data-center landlord, a gas turbine manufacturer, a nuclear operator, an electric car company and Bitcoin. These businesses have different customers, different margin structures, different balance sheets and different cycles. On an ordinary day their correlations are modest.
On Thursday they behaved as one asset. That only happens when the marginal holder of all of them is the same investor, owning them for the same reason, funded the same way. Goldman Sachs prime-brokerage data earlier this year put hedge funds' net exposure to semiconductors near the 98th percentile of the past five years (July 2026). That figure is dated, and positioning has moved since, but nothing in this week's price action suggests the book had been cleaned up.
"They're shooting the generals." — Charlie McElligott, Nomura
"We are now seeing something of a buyers' strike in tech. The rubber band could get stretched further to the downside." — Keith Lerner, Truist
McElligott's phrase is exact. In a crowded unwind, funds sell what they can, not what they should. The most liquid, highest-quality winners get sold first because they are the easiest to sell in size. That is why Nvidia and AMD fell alongside companies with far weaker fundamentals.
The diversification that wasn't#
This is where the episode becomes a risk-management problem, not just a trading story.
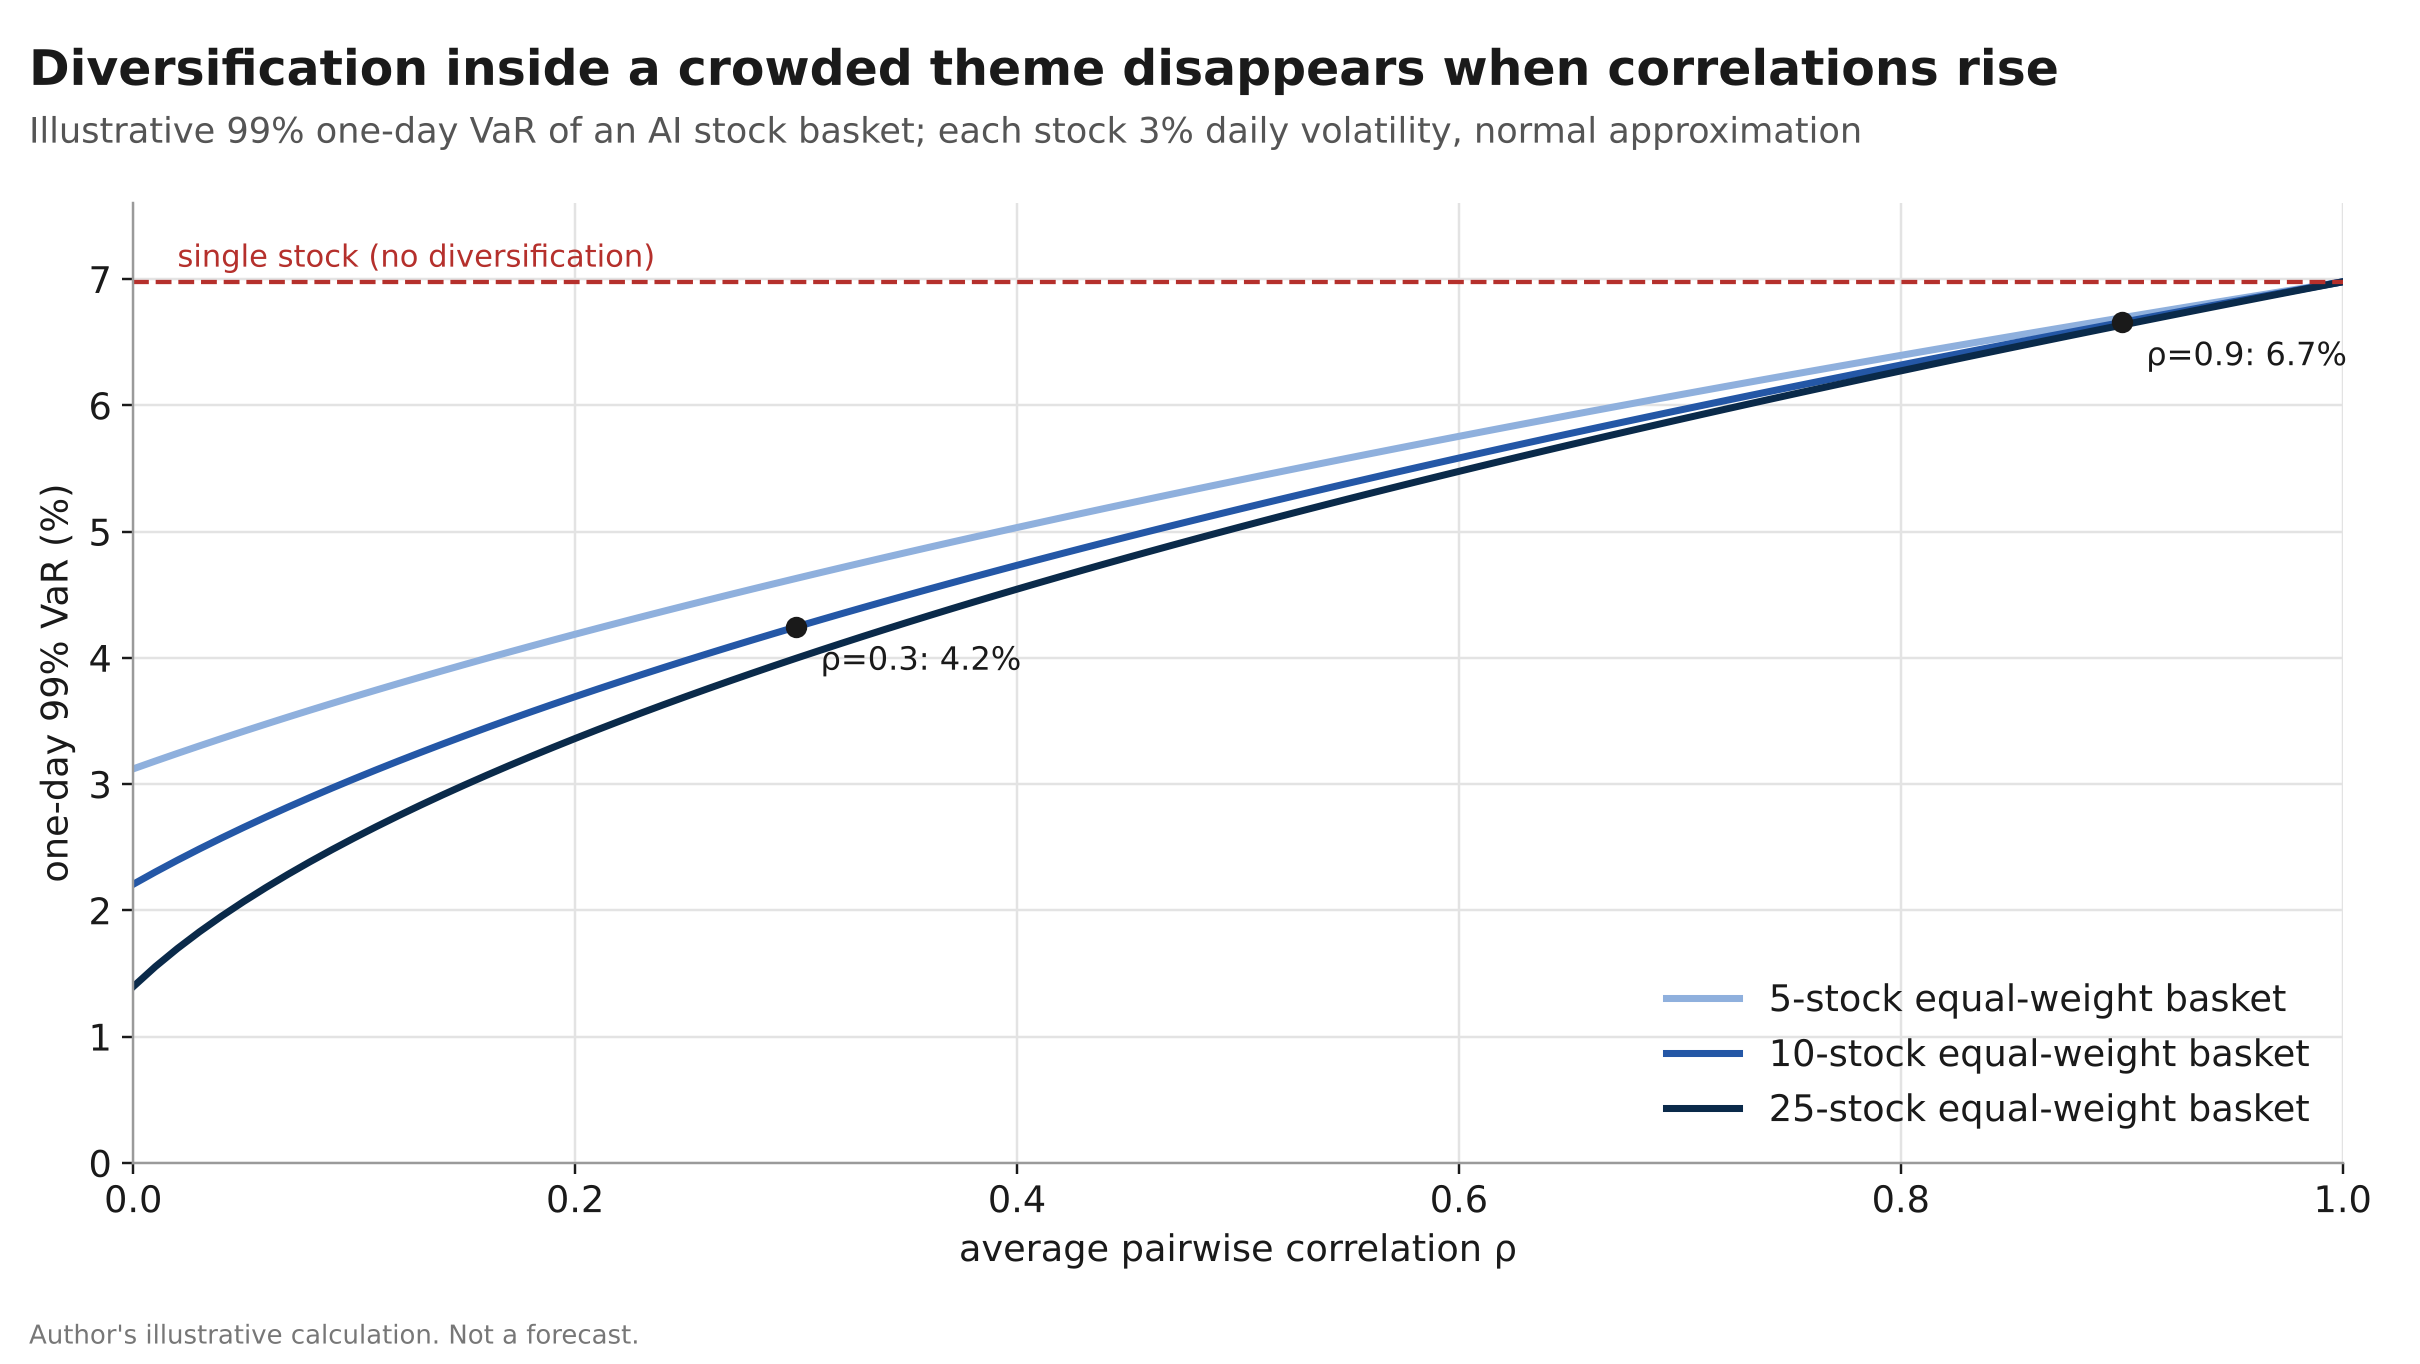
Take a 10-stock, equal-weight AI basket where each stock has 3% daily volatility. Using the standard formula for portfolio volatility, σ_p = σ·√(ρ + (1 − ρ)/n), and a normal 99% quantile of 2.326:
| Average pairwise correlation | Basket daily vol | One-day 99% VaR |
|---|---|---|
| 0.3 (an ordinary day) | 1.82% | 4.2% |
| 0.9 (a crowded unwind) | 2.86% | 6.7% |
| 1.0 (no diversification) | 3.00% | 7.0% |
Moving from ρ = 0.3 to ρ = 0.9 raises the VaR by about 57%, with no change in any individual stock's volatility. A portfolio manager who sized positions using the calm-day correlation was carrying roughly half again as much risk as the model reported. And the model would have reported it the day after the loss, once the new correlations had entered the estimation window.
This is the core of my research agenda. In Systemic Tail Episode Risk (STER) I show in simulation that when assets become more likely to crash together, the cumulative severity of synchronized stress episodes rises by about 45%, while standard portfolio VaR barely moves. Thursday is a live example of that gap.
8. What the risk models missed#↑ Contents
8.1 The tail has to be measured, not assumed#
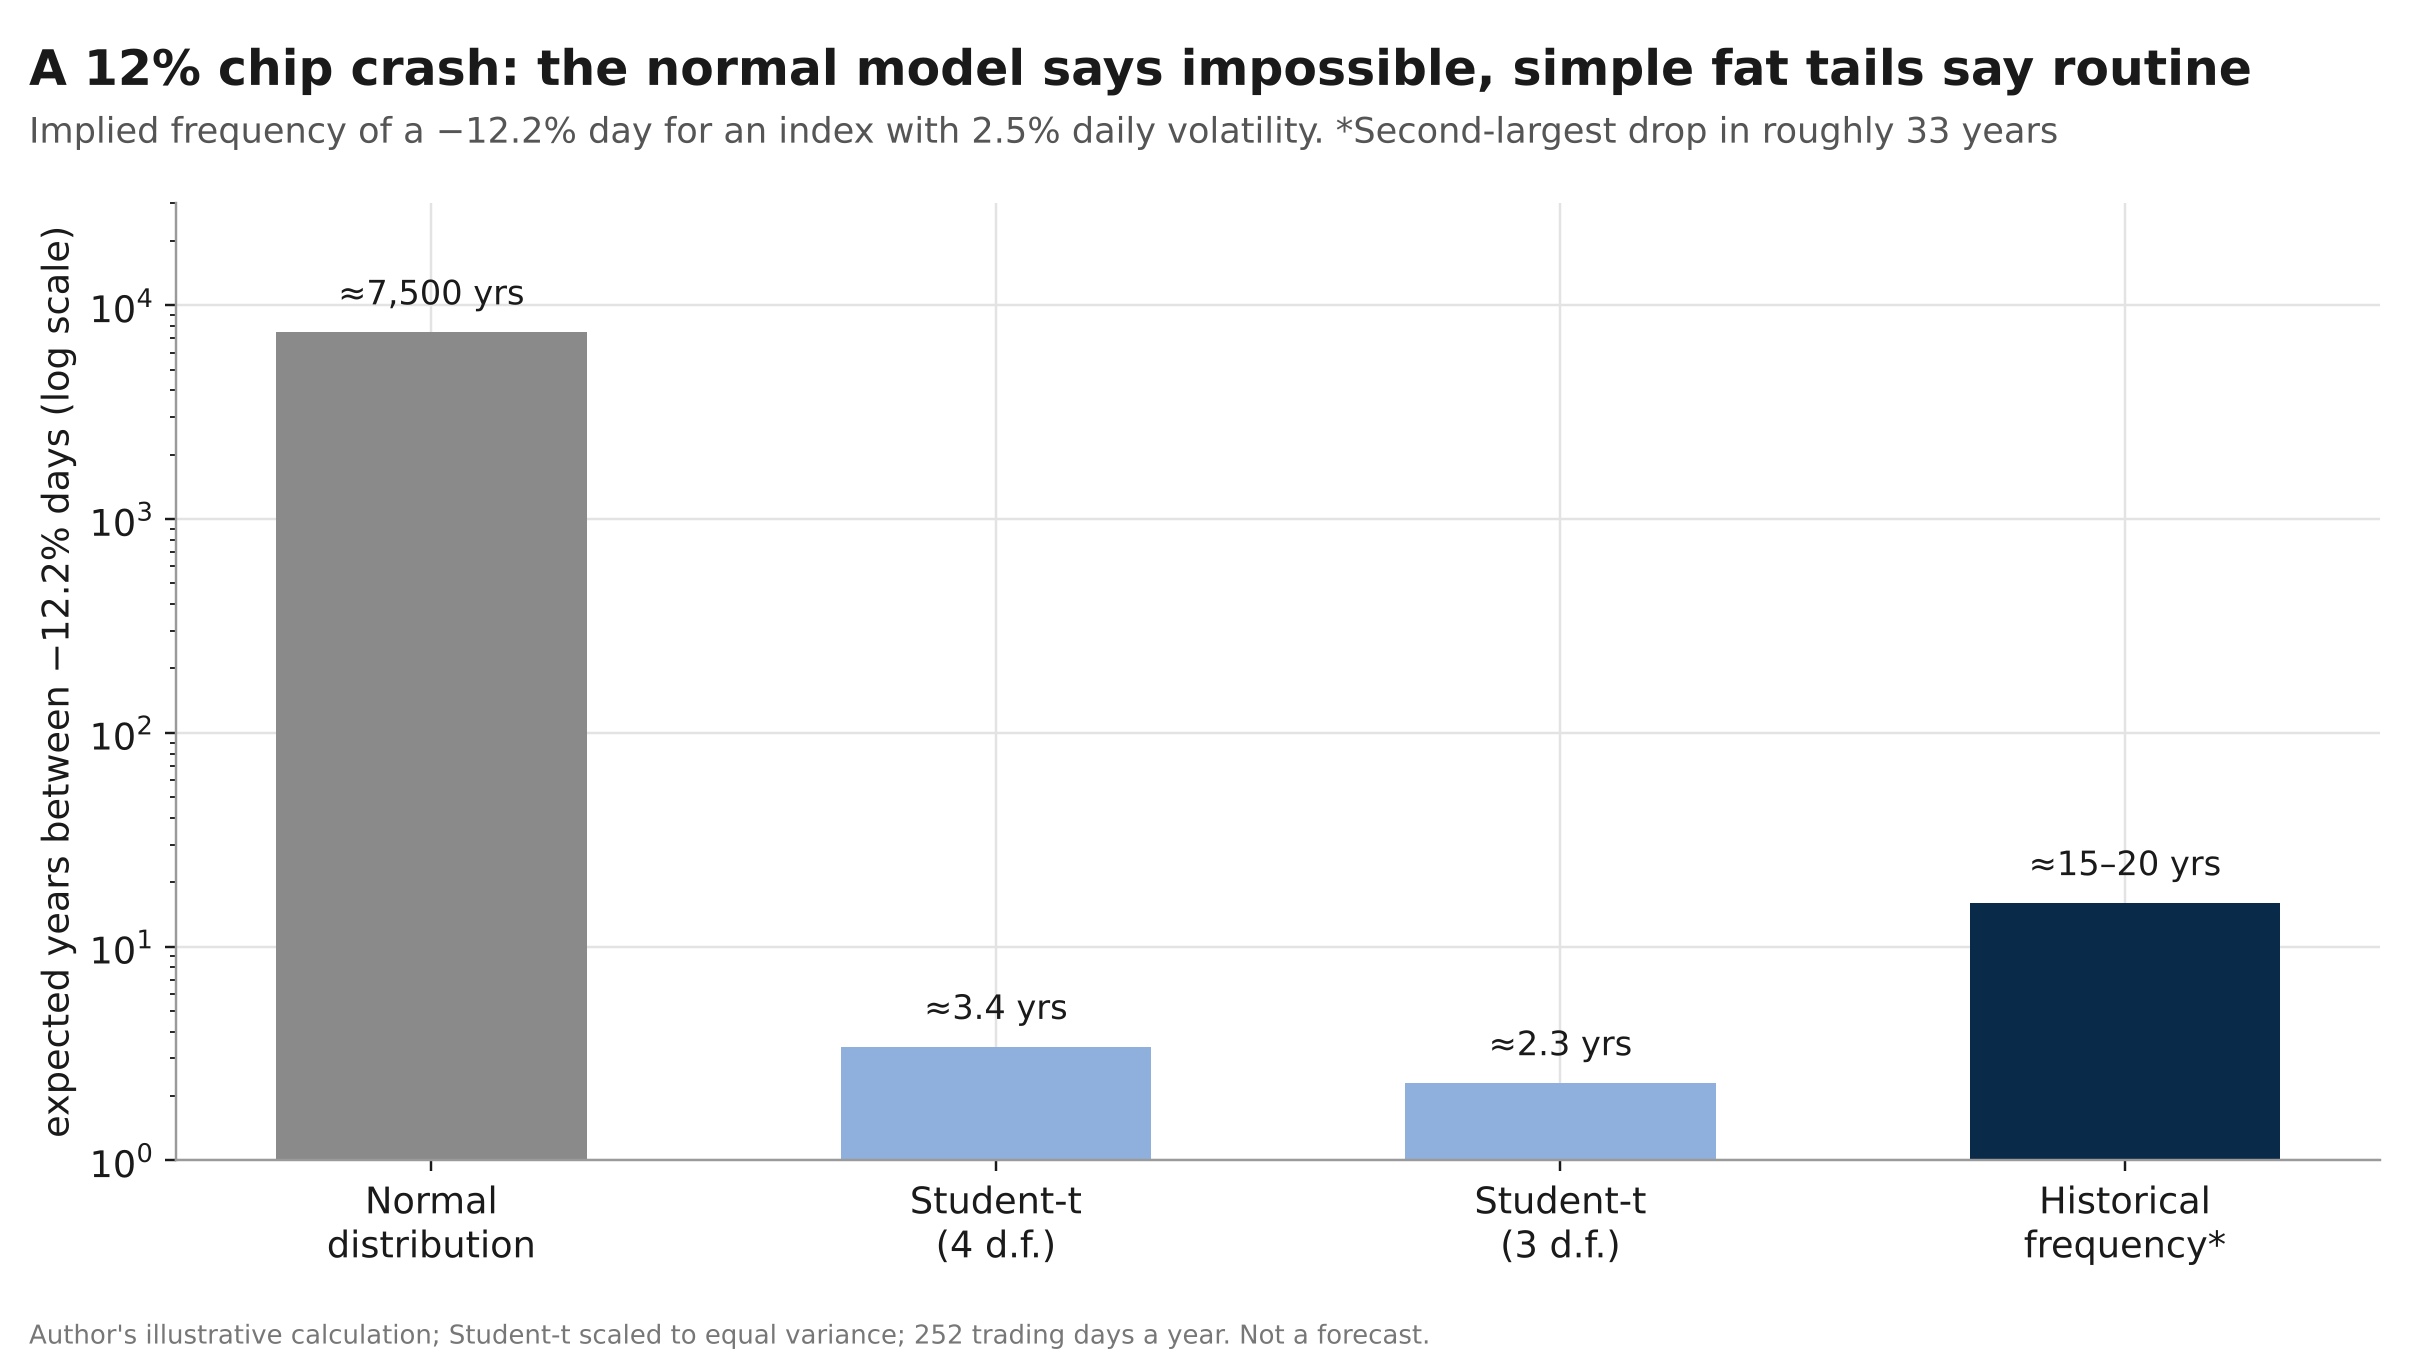
For an index with about 2.5% daily volatility, a −12.2% day is a 4.9-standard-deviation event.
| Model | Implied frequency of a −12.2% day |
|---|---|
| Normal distribution | about once every 7,500 years |
| Student-t, 4 degrees of freedom (equal variance) | about once every 3.4 years |
| Student-t, 3 degrees of freedom (equal variance) | about once every 2.3 years |
| SOX history | roughly once every 15–20 years |
Author's illustrative calculation, 252 trading days a year. Not a forecast.
Both textbook answers are wrong, in opposite directions. The normal model treats Thursday as impossible. A crude fat-tailed model treats it as routine. Neither is a basis for capital decisions. This is why my paper ML-LiqVaR calibrates the far tail with extreme-value theory: estimate the tail's shape from the data rather than choosing a convenient distribution and hoping.
8.2 The most dangerous day for a VaR model is the day after a calm rally#
Wednesday was a strong, low-stress session. Any volatility-scaled model entered Thursday with risk estimates near their lowest of the week. Then the VIX rose as much as 65% intraday.
In When Backtests Lie I find that entering a stress regime multiplies the odds of a VaR breach by 4.80 for historical simulation and 3.49 for a machine-learning model on the S&P 500, and that full-sample backtests can make a model look acceptable while it fails badly inside stress windows. A model validated on calm data and then hit with Thursday's regime switch is exactly the case that framework was built to catch.
8.3 A breach count tells you nothing about how bad the breach was#
In a regulatory VaR backtest, Thursday counts as one exception, whether the loss exceeded the limit by 1% or by 300%. My paper Backtesting VaR Models Under SR 11-7 works through the Kupiec, Christoffersen and Basel traffic-light tests on S&P 500 returns and shows where that blind spot sits. It is the main reason capital rules have moved toward Expected Shortfall, which measures the average size of the loss beyond the threshold, and it is the subject of my next paper.
8.4 Was Thursday systemic?#
Using the breadth-and-persistence lens from STER and CTER (a qualitative reading; I have not computed realized values):
| Test | Thursday | Reading |
|---|---|---|
| Breadth | All 11 sectors, chips, crypto, and Japan −1.8% the next session | Wide |
| Safe-haven hedge | Short-end yields fell about 12bp; bonds still hedged | Held |
| Persistence | Friday rebound broke the run | Short |
Close to systemic, but not systemic. It was the broadest stress day of this cycle, but two safeguards held: the stock–bond hedge and a fast rebound. Those are the two things I would watch if the selloff resumes. If Treasuries sell off alongside equities on the next leg, the episode changes character.
9. The steelman: what if the policy story is right?#↑ Contents
A critical piece should argue against itself, so here is the strongest case for the conventional explanation.
- Data-center operators did fall more than 14%. IREN, Applied Digital and Nebius depend on cheap power, permitting and financing. Policy risk is genuinely first-order for them, and they sold off hard.
- Power equipment fell too. GE Vernova and Constellation are not memory stocks. Their decline fits a story about slower data-center build-out better than a story about memory pricing.
- The Friday test is contaminated. IREN's bounce came on its own earnings, so it is not a clean read on how the market weighs policy risk.
- Timing. The selloff started the day after the result, not on any memory-specific news.
I accept all four points. My conclusion is that the policy shift was real, and it hit the most policy-exposed names hard. But it cannot explain why memory fell more than the operators, why AMD fell 17% after a 97% data-center print, why the Dow lost less than a third of what the Nasdaq lost, or why memory kept falling on Friday while everything else bounced. A complete explanation needs the fuel, not just the match.
10. Oil: the quieter macro story#↑ Contents
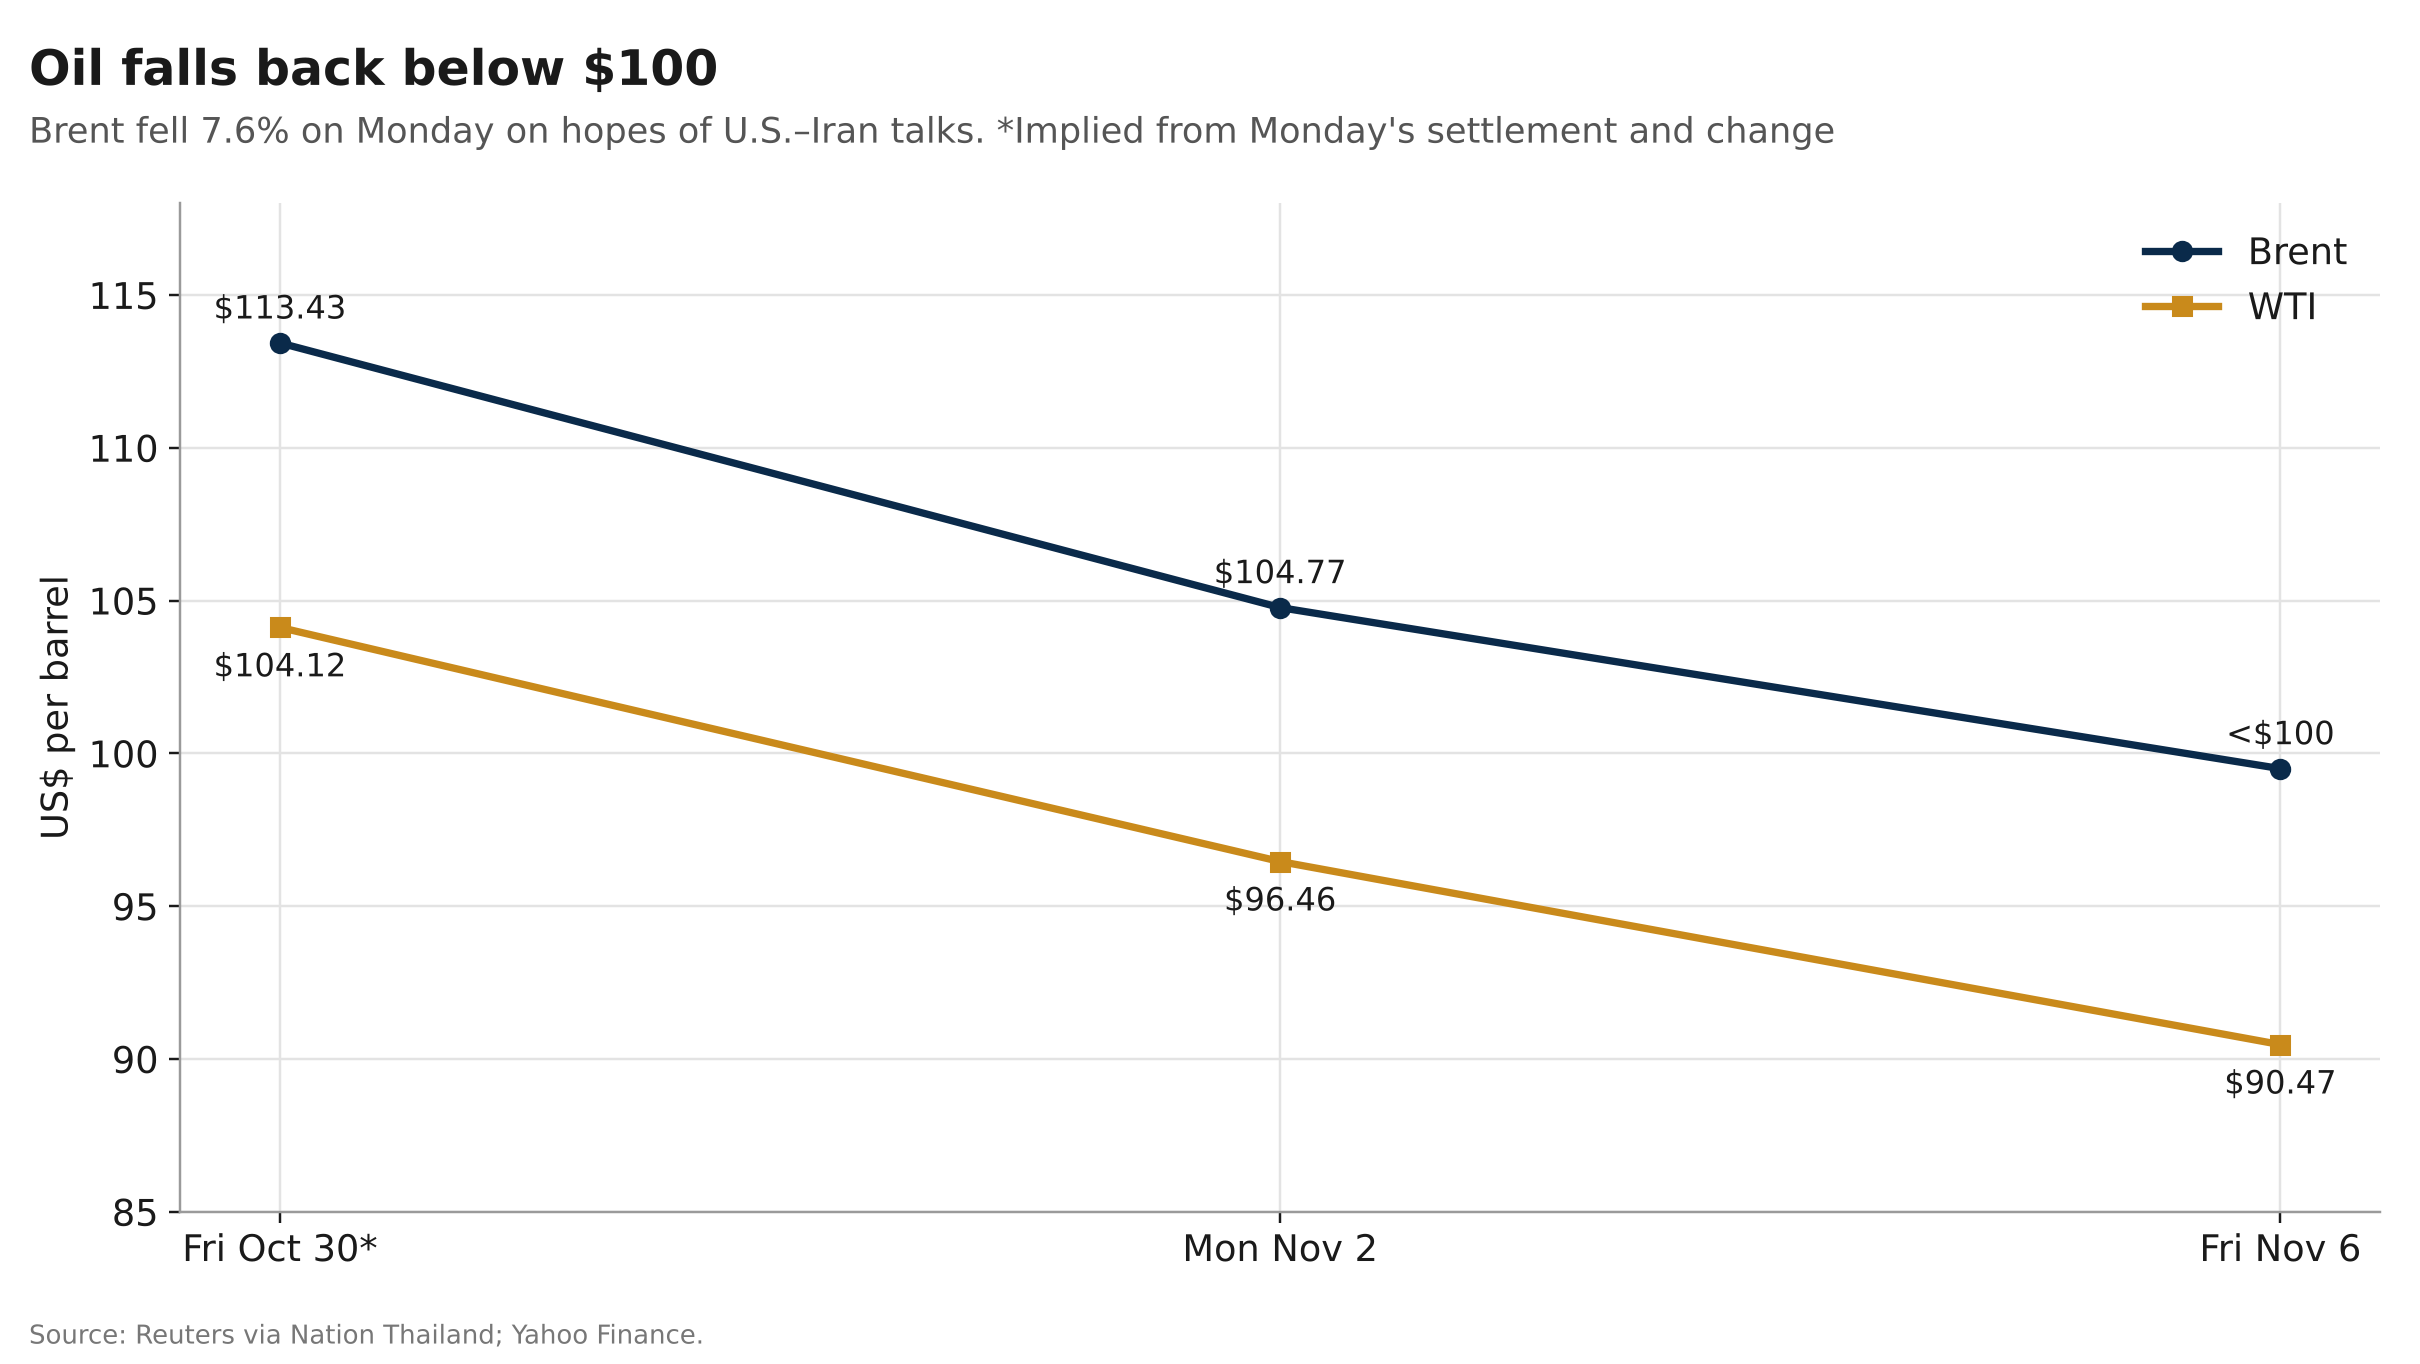
Brent fell 7.6% to $104.77 on Monday on hopes of U.S.–Iran talks and ended the week below $100. Lower oil should, in principle, ease inflation and help the Fed. In practice, paired with a payroll beat of about 100,000, it does not yet change the rates picture. Analysts were right to warn about false dawns. For equity valuations, the jobs report outweighs the oil move this week.
11. Bull case, bear case#↑ Contents

| The case for a healthy reset | The case for a deeper repricing |
|---|---|
| AI demand is accelerating; AMD guides to ~66% growth | Memory pricing is now hurting customers' margins and volumes |
| Friday: SOX +4%, AMD +8%, Nvidia +6% | Memory fell again into a sector-wide bounce |
| AMD and Palantir both raised outlooks | Private AI valuations are being cut |
| A 12% day flushes out weak hands | Rates are high and a December hike is still in play |
| No recession signal in the jobs data | Positioning is still crowded after a single bad day |
My assessment: both columns are true, but for different parts of the trade. Businesses with accelerating demand and genuine pricing power, such as AMD's data-center unit and Palantir, look like candidates for a reset rather than a regime change. Segments with cyclical margins, customers pushing back, or heavy dependence on external financing (memory and debt-funded infrastructure) look more exposed to a lasting repricing.
The biggest risk now is treating "the AI trade" as one thing. On Thursday it behaved as one. The fundamentals say it is at least three different businesses with three different cycles, and the next few months will probably separate them.
12. What I'm watching#↑ Contents
| Signal | Why it matters |
|---|---|
| Memory vs. the rest of semiconductors | Continued underperformance would confirm the cycle reading |
| More customer commentary on memory costs | Margin warnings spreading beyond Apple and Qualcomm would mean demand destruction |
| Correlation within AI names | If AI stocks start moving independently again, the crowding is clearing |
| The stock–bond hedge | Treasuries falling with equities on the next selloff would make this systemic |
| October CPI | A hot print plus strong payrolls would firm up a December hike |
| Follow-through on Friday's bounce | A relief rally that fades would point to a deeper repricing |
The bottom line#↑ Contents
It is tempting to pin a 12% chip crash on one headline. The data does not support that. AMD's growth accelerated and the stock fell 17%. Memory makers fell the most and kept falling while the rest of the sector rebounded. The largest buyers of memory spent the week warning about its cost. Private AI valuations moved down. And on Thursday, businesses with almost nothing in common fell together, because the same capital owned all of them.
The election lit the match. The fuel was crowding, valuations that left no room for disappointment, and a memory cycle that has begun to squeeze its own customers.
For investors, the takeaway is that the AI trade is splitting, and owning it as a single theme is now a concentrated bet that looks diversified. For risk managers, it is a reminder that diversification inside a crowded theme tends to vanish on exactly the day you need it.
Markets rarely crash on news alone. They crash when news meets a market with no room left to absorb it.
Your take#
Was Thursday a healthy reset in an overcrowded trade, or the first real crack in the memory cycle and AI valuations? I'd like to hear how you are reading it.
Read the research (all on SSRN)
When Backtests Lie: A Governance-Grade Validation Framework for Machine-Learning Value-at-Risk Models under Regime Shifts papers.ssrn.com/sol3/papers.cfm?abstract_id=7652318
Systemic Tail Episode Risk: Persistence and Cumulative Severity of Synchronized Extreme-Loss Episodes Across Markets papers.ssrn.com/sol3/papers.cfm?abstract_id=7534899
Conditional Tail Episode Risk: A Path-Dependent Framework for Extreme-Loss Episodes Beyond Value-at-Risk and Expected Shortfall papers.ssrn.com/sol3/papers.cfm?abstract_id=7502499
ML-LiqVaR: A Liquidity- and Regime-Aware, Extreme-Value-Calibrated Gradient-Boosting Value-at-Risk Model for US Equity Markets papers.ssrn.com/sol3/papers.cfm?abstract_id=7222958
Backtesting Value-at-Risk Models Under SR 11-7: A Comparative Analysis of Kupiec, Christoffersen, and Basel Traffic-Light Tests Applied to S&P 500 Returns (2018–2024) papers.ssrn.com/sol3/papers.cfm?abstract_id=7170418
All papers: SSRN author page
About the author#
Niraj Neupane, CA (ICAI), is a Quantitative Researcher at Korvane, a Financial Economist at Calderyn Institute, and the founder of Wall Street Feed. His research covers Value-at-Risk, tail risk and the validation of AI risk models, and is published on SSRN.
Views expressed are the author's own and are not investment advice.
Sources#
Markets
- Reuters via Investing.com, Trading Day: A November 5 market bonfire: https://www.investing.com/news/economy-news/trading-day-a-november-5-market-bonfire-5005919
- Fox Business, Stocks, Nov 5, 2026: https://www.foxbusiness.com/markets/stocks-nov-5-2026
- Yahoo Finance, Dow plunges 1,800 points, Nasdaq enters correction (Nov 5, 2026): https://finance.yahoo.com/markets/live/stock-market-today-thursday-november-5-dow-sp-500-nasdaq-plunge-chip-stocks-melt-down-193726491.html
- Yahoo Finance, Nasdaq and S&P 500 rebound, Dow slips (Nov 6, 2026): https://finance.yahoo.com/markets/live/stock-market-today-friday-november-6-dow-sp-500-nasdaq-jobs-report-earnings-135953863.html
- TNW, Hedge funds sold chip stocks for a fourth week (Goldman Sachs prime-brokerage data, July 2026): https://thenextweb.com/news/hedge-funds-sell-chip-stocks-fourth-week
Economy and energy
- U.S. Bureau of Labor Statistics, Employment Situation, October 2026: https://www.bls.gov/news.release/empsit.nr0.htm
- Nation Thailand (Reuters), Oil falls over 7% on November 2: https://www.nationthailand.com/news/world/40073041
Companies
- AMD, Third Quarter 2026 Financial Results: https://ir.amd.com/news-events/press-releases/detail/1303/amd-reports-third-quarter-2026-financial-results
- AI Weekly, Palantir Q3 revenue nearly doubles: https://aiweekly.co/alerts/palantir-q3-revenue-nearly-doubles-to-231b-guides-to-853b
- StockAnalysis, Apple fiscal Q4 2026 earnings: https://stockanalysis.com/news/apple-fiscal-q4-2026-earnings/
- Investing.com, Qualcomm falls as handset revenue misses estimates: https://www.investing.com/news/stock-market-news/qualcomm-falls-3-as-handset-revenue-misses-estimates-costs-rise-5001230