Financial Gurkha | Queens, New York | July 31, 2026
Disclaimer: This article is for educational purposes only and is not investment advice. Trading and investing are subject to volatility and market risk, including partial or entire loss of capital. Please consult your financial advisor before making investment decisions. Financial Gurkha and its writers are not liable for your losses, nor do we take credit for your gains. All figures below are drawn from Microsoft's fiscal year 2026 Form 10-K filing with the SEC (year ended June 30, 2026) and company guidance.
The Quarter Wall Street Will Be Studying for Years#
Microsoft (NASDAQ:MSFT) is up roughly 25% over the last two trading sessions. For most companies, a move like that means a takeover rumor. For a company of Microsoft's size, it means the market just repriced the entire AI trade in real time.
The internet, as usual, got there first. The running joke on finance Twitter and Reddit is that Microsoft has completed its rebrand to MacroHard — because after this filing, there is nothing "micro" or "soft" left in the numbers. $758 billion in assets. $313 billion of property and equipment. $183 billion of operating cash flow. The meme writes itself; the 10-K signs off on it.
We read that 10-K so you don't have to. Here is what fiscal 2026 actually looked like, in the company's own audited numbers — and why the forward guidance may matter even more than the results.
The Headline Numbers: Microsoft's FY26 by the Filing#
| Metric (Year Ended June 30) | FY2026 | FY2025 | Change |
|---|---|---|---|
| Total revenue | $331.8B | $281.7B | +17.8% |
| Gross margin | $225.5B | $193.9B | +16.3% |
| Operating income | $155.2B | $128.5B | +20.8% |
| Net income | $133.7B | $101.8B | +31.3% |
| Diluted EPS | $17.95 | $13.64 | +31.6% |
| Net cash from operations | $182.9B | $136.2B | +34.4% |
| Effective tax rate | 19.4% | ~17.6% | — |
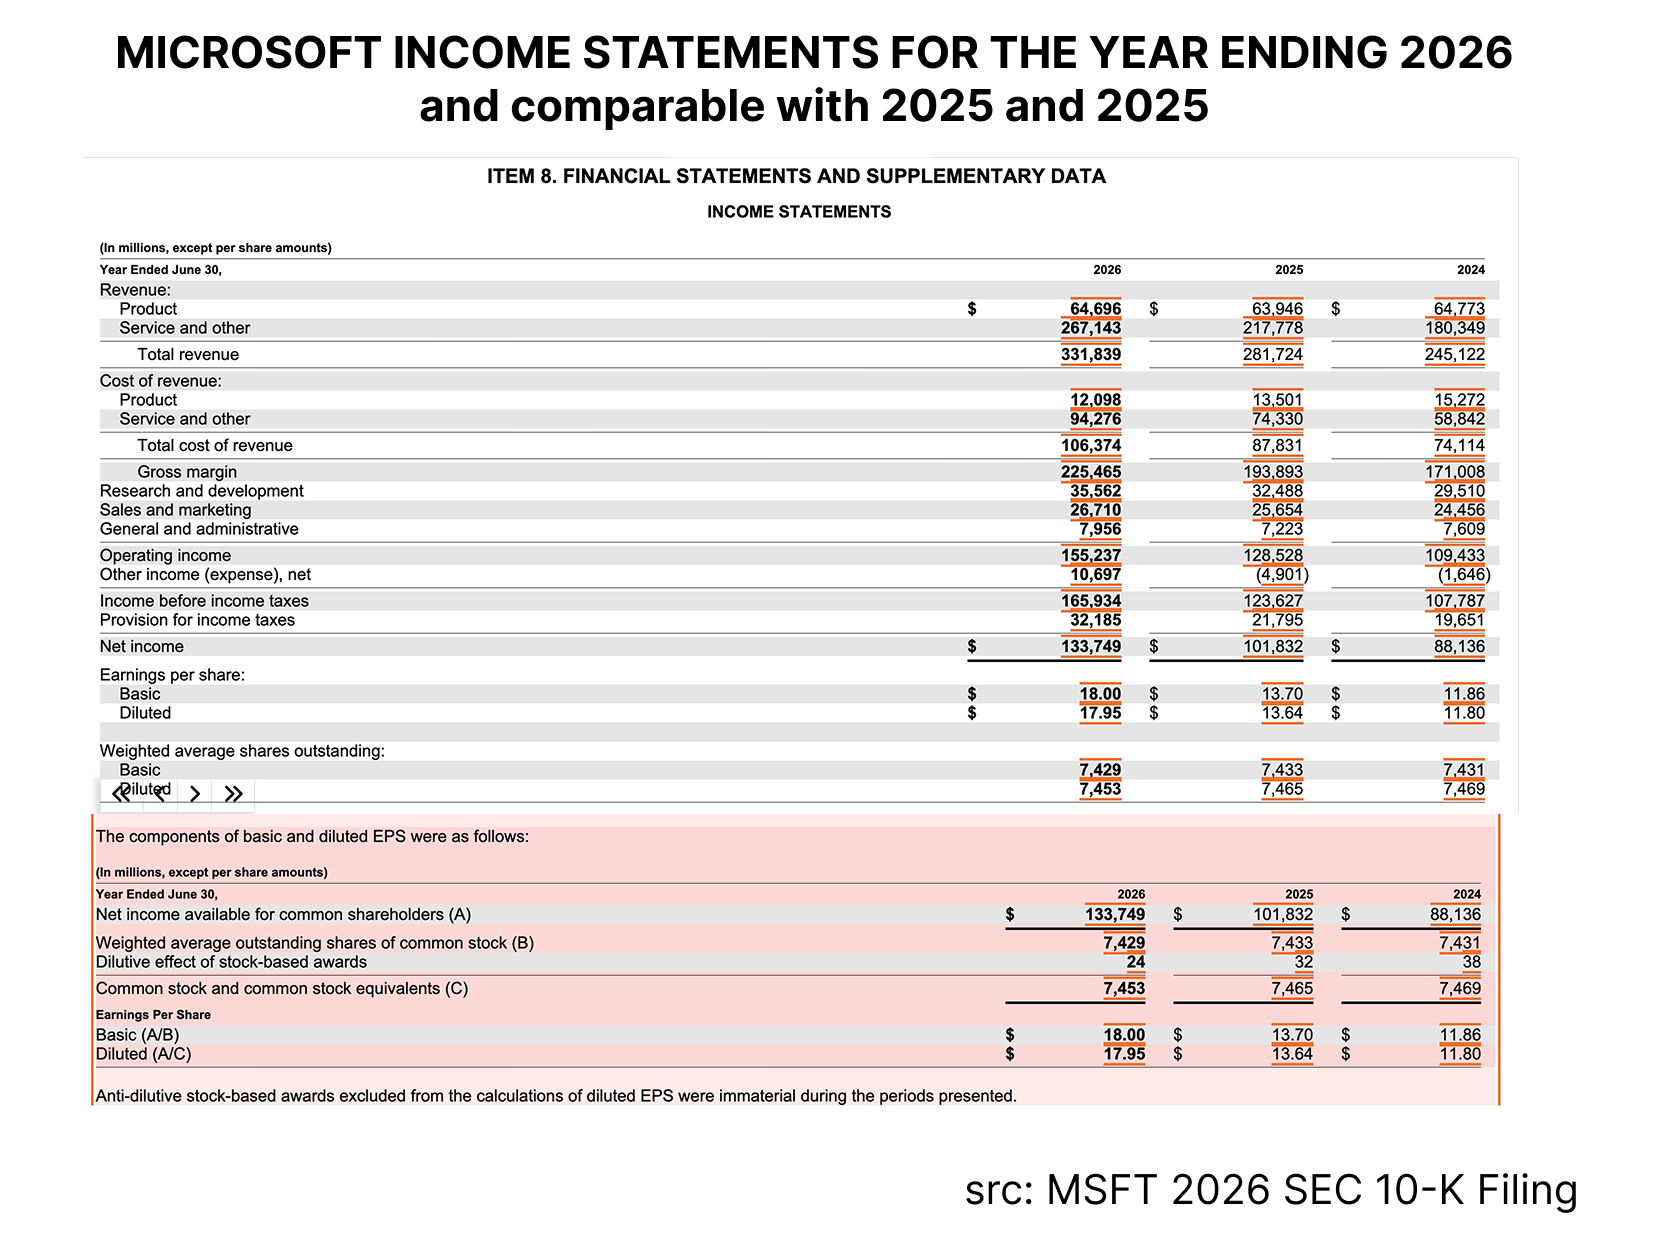
Microsoft's FY26 income statement, from the 2026 SEC 10-K filing.
Three things jump off the page.
First, revenue growth accelerated to 18% at a $330 billion scale. Companies this large are supposed to slow down. Microsoft sped up.
Second, net income grew nearly twice as fast as revenue. Operating leverage is real: operating income of $155.2 billion means Microsoft converts about 47 cents of every revenue dollar into operating profit, and 40 cents of it into net profit. A 40.3% net margin at a third of a trillion dollars in revenue has essentially no precedent in corporate history.
Third, the bottom line got a boost below the operating line. Other income swung from a $4.9 billion loss in FY25 to a positive $10.7 billion in FY26 — and the cash flow statement shows $11.0 billion in net recognized gains on investments and derivatives. That is the AI investment portfolio going from a drag to a tailwind, headlined by a reported $3.2 billion gain on Microsoft's investment in Anthropic and improving accounting impacts from the OpenAI stake. The frontier labs Microsoft backed are no longer just strategic bets; they are showing up in earnings.
The Three-Year Arc: From Cloud Company to AI Utility#
Zoom out and the transformation is starker than any single quarter:
| Fiscal Year | Revenue | Net Income | Operating Cash Flow | CapEx |
|---|---|---|---|---|
| FY2024 | $245.1B | $88.1B | $118.5B | $44.5B |
| FY2025 | $281.7B | $101.8B | $136.2B | $64.6B |
| FY2026 | $331.8B | $133.7B | $182.9B | $115.9B |
Revenue up 35% in two years. Net income up 52%. Operating cash flow up 54%. And capital expenditures up 161% — the steepest infrastructure ramp any company has ever executed, in absolute dollars, in the history of public markets.
Look at the revenue mix underneath it. Service and other revenue hit $267.1 billion — over 80% of total revenue — growing 22.7%, while product revenue sat essentially flat at $64.7 billion. The company that once sold you a box of Windows now sells metered intelligence, and the meter is spinning. The cost of that shift is visible too: service cost of revenue jumped 26.8% to $94.3 billion as AI infrastructure came online, compressing gross margin about 90 basis points to 67.9%. That is the price of feeding GPUs, and Microsoft is paying it gladly.
Q4 FY26: The Beat That Lit the Fuse#
The June quarter closed the year with revenue of $90.0 billion, up 18% year over year (17% in constant currency), and adjusted EPS of $4.74, up 23%, adjusted for OpenAI investment impacts. Results included a 27-cent-per-share benefit from discrete items — the Anthropic gain chief among them.
But the stock did not add hundreds of billions in market value because of a clean beat. It moved because of what CFO Amy Hood said about fiscal 2027.
FY27 Guidance: Demand Is Still Bigger Than the Datacenters#
The single most important sentence in the guidance: customer demand for Azure AI compute remains higher than available capacity. Microsoft's constraint is not sales. It is construction.
For the first quarter of FY27, Microsoft guided:
| Segment | Q1 FY27 Revenue Guidance | Implied Growth |
|---|---|---|
| Intelligent Cloud | $40.95B – $41.25B | +33% to +34% |
| Productivity and Business Processes | $36.70B – $37.00B | +11% to +12% |
| More Personal Computing | $12.20B – $12.70B | declining |
| Total revenue | $89.85B – $90.95B | +16% to +17% |
Inside those segment lines:
- Azure is guided to grow roughly 45% in constant currency Constant currencyGrowth recalculated as if exchange rates had not moved. A US company earning in euros reports lower dollar revenue when the dollar strengthens, even if it sold exactly the same amount. Constant currency strips that distortion out to show underlying performance. Where the two numbers differ, the gap tells you how much of the result is currency rather than business., with growth expected to accelerate through the first half of FY27 as new datacenter capacity comes online and is monetized essentially on arrival.
- M365 Commercial Cloud is expected to grow about 15% in constant currency, with premium-tier enterprise seats surpassing 30 million and M365 Copilot monetization scaling.
- LinkedIn is guided to high-single-digit growth and Dynamics 365 to low-teens growth.
- Windows OEM and Devices revenue is expected to decline in the low twenties — component costs, PC market dynamics, and a brutal comparison against the Windows 10 end-of-support refresh. Xbox content and services is guided down mid-single digits. The old Microsoft is shrinking inside the new one, and the market does not care.
For the full year, Microsoft expects double-digit revenue and operating income growth, operating margins down less than a point, operating expense growth held to 7–8%, an effective tax rate near 20%, and positive free cash flow throughout FY27.
The $115 Billion Question: What the Buildout Did to the Balance Sheet#
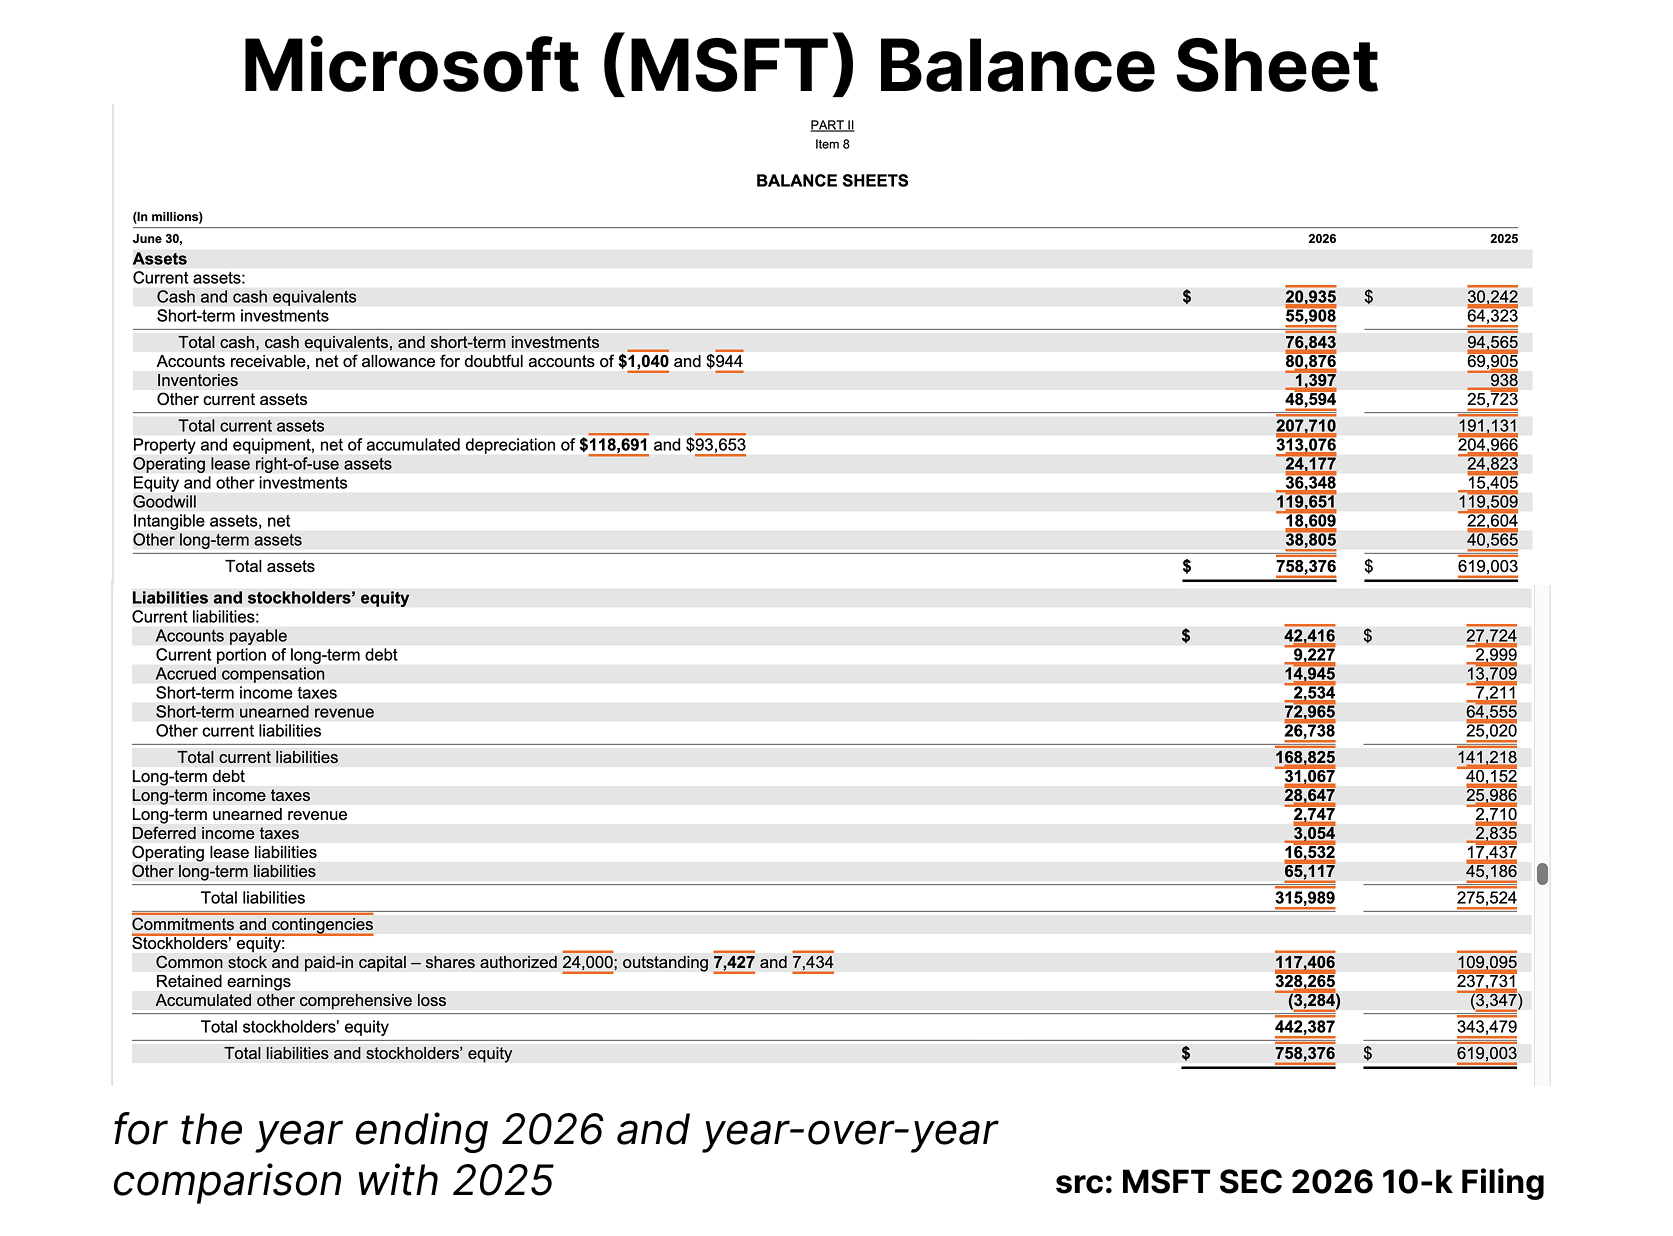
Microsoft's FY26 balance sheet: total assets crossed $758 billion. From the 2026 SEC 10-K filing.
Now to the part of the filing most coverage skips: what this buildout is doing to the balance sheet.
- Additions to property and equipment hit $115.9 billion in FY26 — up from $64.6 billion in FY25 and $44.5 billion in FY24. Microsoft nearly doubled its capex in a single year, and guided calendar year 2026 spend to roughly $115 billion.
- Net property and equipment now stands at $313.1 billion, up 53% in one year. Accumulated depreciation alone is $118.7 billion. Microsoft's datacenter footprint is now, by book value, one of the largest industrial asset bases on Earth — a software company with the balance sheet of a railroad.
- Equity and other investments more than doubled, from $15.4 billion to $36.3 billion. This is the line where the frontier AI stakes live, and it grew 136% in a year — part new investment, part the marked-up value of positions like Anthropic.
- Cash and short-term investments fell from $94.6 billion to $76.8 billion, while total debt sits near just $40 billion. Even mid-buildout, Microsoft remains net cash positive by roughly $36 billion. It is drawing down its fortress to build a bigger one out of concrete, silicon, and power contracts — without borrowing to do it.
- Even inventories tell the story: up 49% to $1.4 billion. When a software company's inventory jumps, it is stockpiling hardware components.
One accounting note investors should not skim past: effective FY27, Microsoft extended the estimated useful lives of its datacenters (to 15–25 years, from 6–15). Useful life and depreciationCompanies spread the cost of a big asset across the years they expect to use it. Stretch that period and the annual charge falls, which raises reported profit without anything changing in the business. It is a legitimate accounting estimate, not a trick — but it is an estimate management chooses, so it deserves scrutiny. Here it embeds an assumption that GPU-filled datacenters stay economically useful for up to 25 years. The net effect on FY27 operating income is minimal, but it shifts future datacenter leases from finance leases toward operating leases and smooths depreciation on an asset base that is now larger than the GDP of most countries. Depreciation and amortization already jumped 31% to $38.5 billion in FY26. Watch this line.
Follow the Cash: $183 Billion In, and Where It Went#
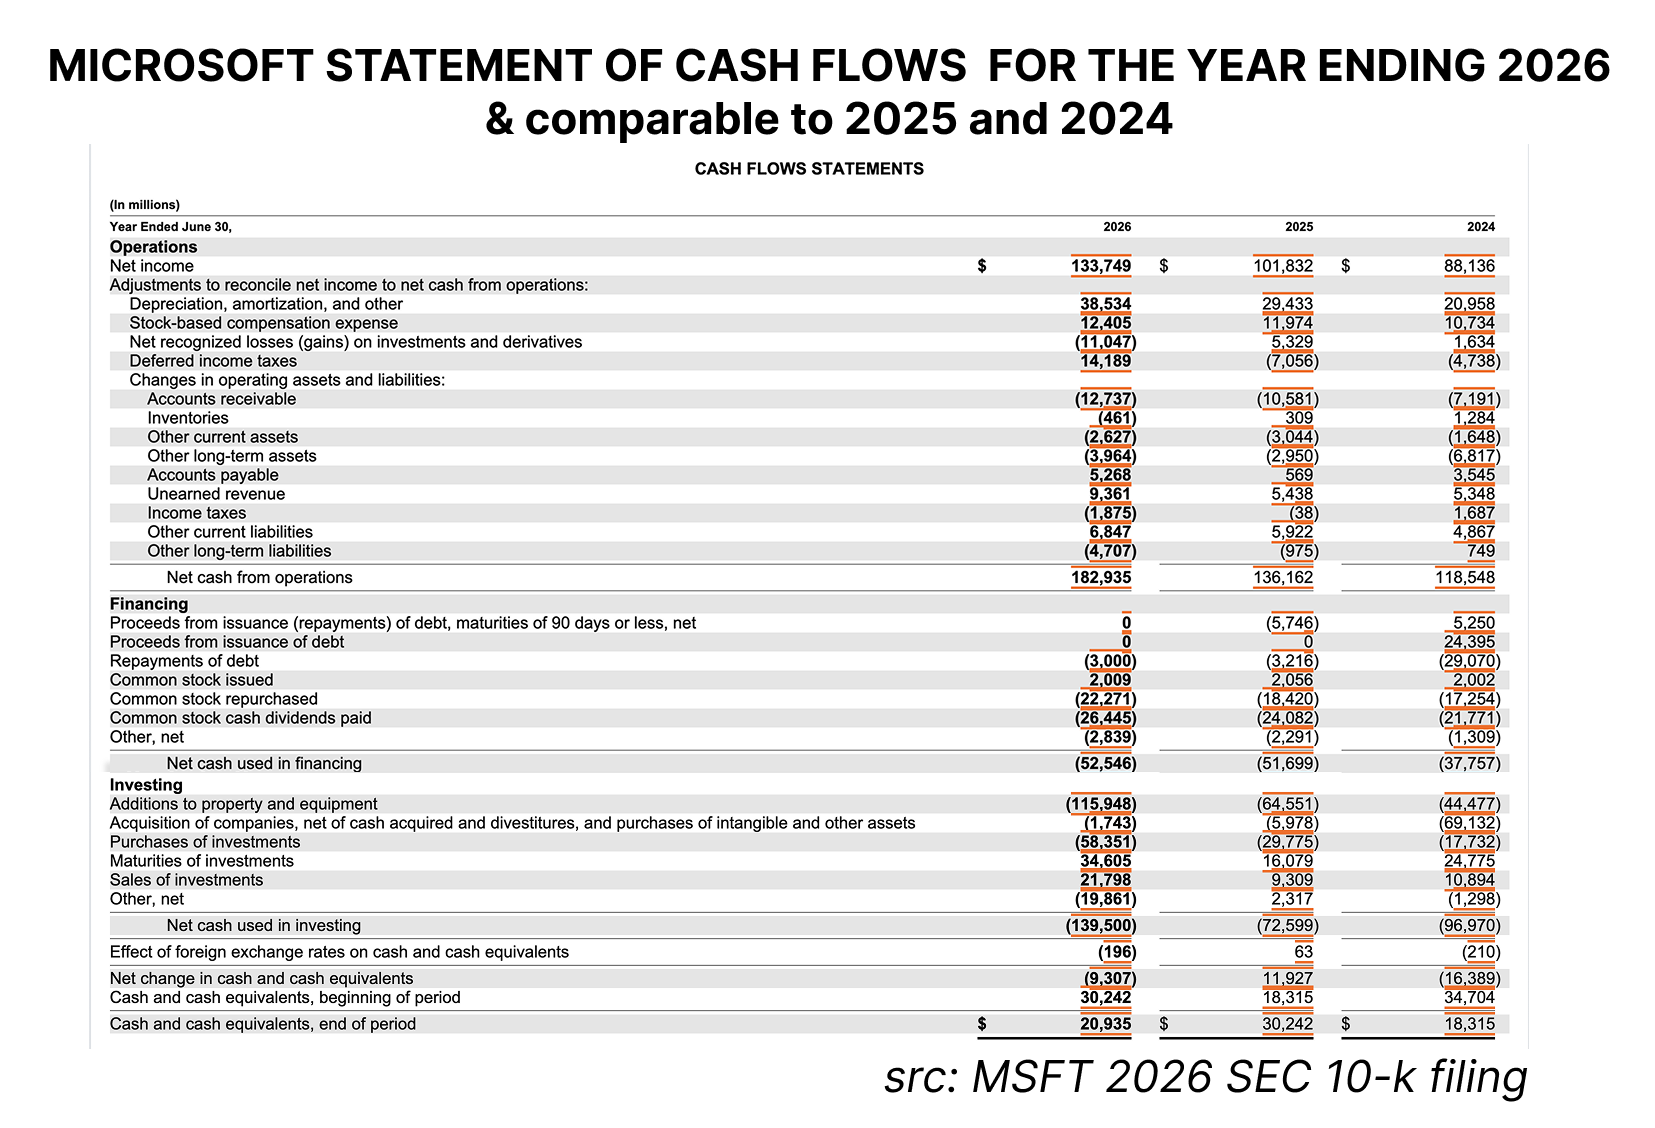
Microsoft's FY26 cash flow statement: $182.9 billion from operations, $115.9 billion into datacenters. From the 2026 SEC 10-K filing.
Operating cash flow of $182.9 billion grew 34% — faster than net income, which is the signature of high-quality earnings. Two details deserve attention:
Unearned revenue is the demand signal nobody talks about. Short-term unearned revenue Unearned revenueAlso called deferred revenue. Cash a customer has already paid for a service not yet provided — a year of Microsoft 365 billed up front, for example. Accounting rules say you cannot call it revenue until you deliver the service, so it sits on the balance sheet as a liability. For subscription businesses it is one of the best forward indicators available: money already collected against future quarters. — cash customers have already paid for services not yet delivered — rose 13% to $73.0 billion. That is $73 billion of next year's revenue already sitting in the bank. When customers prepay at that scale, churn risk is theoretical.
Free cash flow Free cash flowCash from operations minus what was spent on property and equipment. It is the money genuinely left over for dividends, buybacks, acquisitions or debt repayment. Profit is an accounting result that includes non-cash items; free cash flow is closer to what actually landed in the bank — which is why it is the right lens on a company spending $116 billion a year on construction. survived the capex avalanche. $182.9 billion in, $115.9 billion into the ground, leaves roughly $67 billion of free cash flow — down from ~$72 billion the prior year despite capex nearly doubling. The buildout is being funded entirely from operations, with room left over for shareholders.
Shareholder Returns: $48.7 Billion Out the Door, Share Count Still Falling#
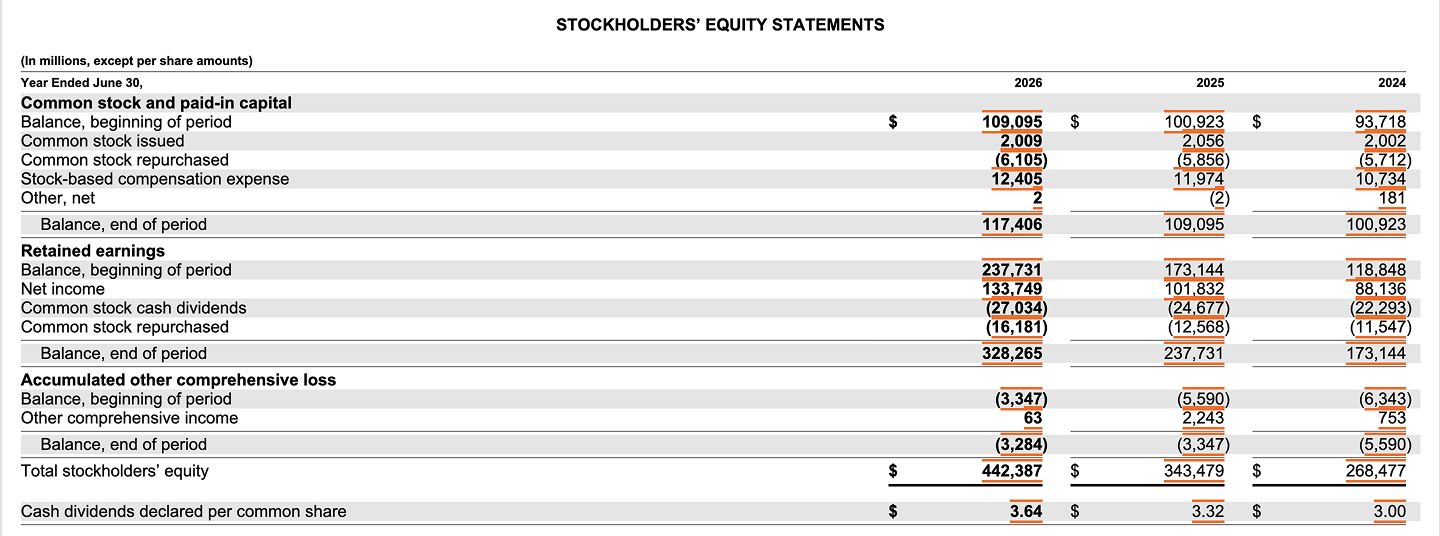
Microsoft's FY26 stockholders' equity statement. From the 2026 SEC 10-K filing.
In a year when it spent $116 billion on infrastructure, Microsoft still returned $48.7 billion to shareholders: $26.4 billion in dividends paid (with the declared dividend rising to $3.64 per share, from $3.32) and $22.3 billion in buybacks. Shares outstanding ticked down from 7,434 to 7,427 million — the buyback is still outrunning stock-based compensation, which came in at $12.4 billion.
Total stockholders' equity grew 29% to $442.4 billion, and retained earnings crossed $328 billion. Run the profitability math and Microsoft earned a ~34% return on average equity in FY26 — while carrying a third of a trillion dollars of infrastructure on the books. That is the number that separates this buildout from the dot-com era's: this time, the spend is being financed by the most profitable operating machine ever assembled.
The Tax Table Tells Its Own Story#
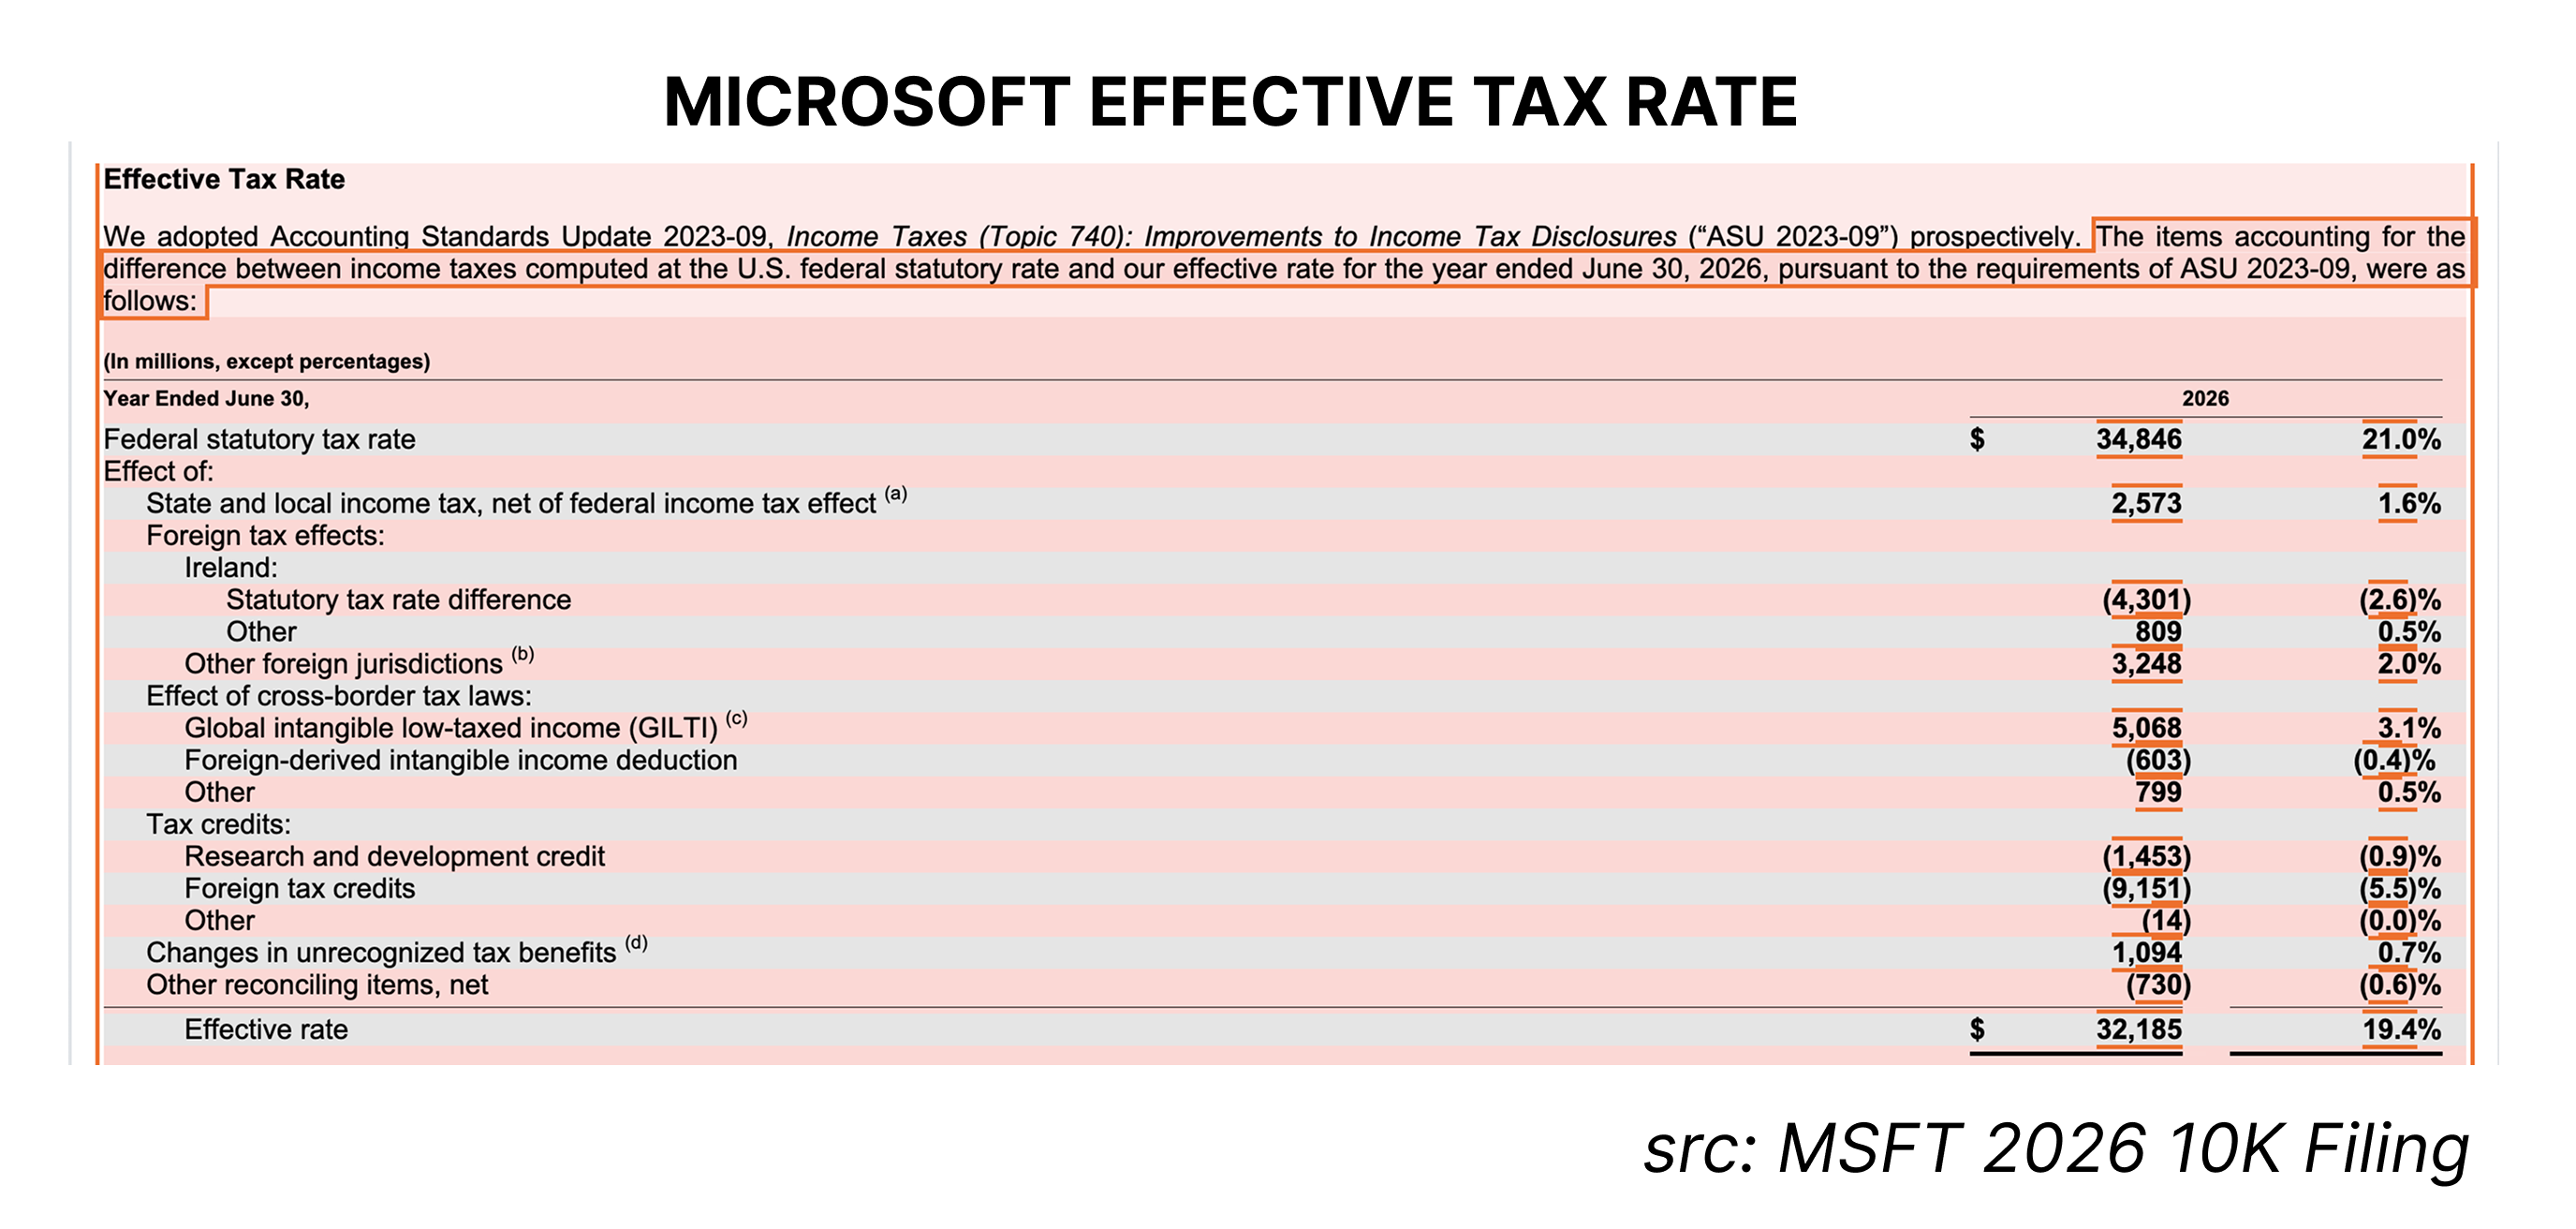
Microsoft's FY26 effective tax rate reconciliation, disclosed under ASU 2023-09. From the 2026 SEC 10-K filing.
Under the new ASU 2023-09 disclosure rules, Microsoft's effective rate reconciliation is unusually transparent this year: a 21% federal statutory rate Statutory vs effective tax rateThe statutory rate is the headline rate written in law. The effective rate is what the company actually paid as a percentage of pre-tax profit, after credits, deductions and the mix of countries it earns in. The gap between the two is where tax strategy lives, and new SEC rules (ASU 2023-09) now force companies to show the reconciliation line by line. becomes a 19.4% effective rate, with foreign tax credits (-5.5 points) and the Irish statutory rate difference (-2.6 points) offsetting GILTI (+3.1 points) and state taxes (+1.6 points). On $165.9 billion of pre-tax income, Microsoft booked a $32.2 billion provision. The structure is efficient, disclosed, and — at these profit levels — politically visible.
What Could Break the Thesis#
We are not in the business of writing victory laps, so here is the bear case, from the same filing:
The depreciation wave is coming. $313 billion of PP&E depreciates no matter what demand does. D&A is already $38.5 billion and compounding at 30%+. The useful-life extension softens the slope, but if AI compute demand ever plateaus, Microsoft will be running these charges against flat revenue — and the extension itself embeds an assumption that today's GPU-dense datacenters stay economically useful for up to 25 years. Hardware history argues for humility on that.
Power, not chips, is the new constraint. Guidance says capacity comes online through FY27 — but datacenter timelines now hinge on grid interconnects and energy contracts, which Microsoft does not fully control.
The market has pre-paid. A 25% two-day move front-runs the ~45% Azure growth. Guidance is now the floor, not the target. Any quarter where capacity or demand wobbles gets amplified on the way down exactly as this one was amplified on the way up.
Gross margin is quietly bending. 90 basis points of compression is manageable; the question is whether AI revenue scales faster than the cost of serving it. FY27's flat-margin guidance says yes. It has to keep being yes.
Financial Gurkha Takeaways#
1. The constraint is supply, not demand. Every megawatt Azure adds is monetized immediately. Until capacity catches up to demand, Azure's growth rate is a construction schedule, not a sales forecast.
2. Margins survived the buildout. A near-doubling of capex with operating margins roughly flat and opex growth at 7–8% is the most disciplined mega-scale expansion we have seen since the cloud era began.
3. The AI portfolio flipped from cost to profit center. OpenAI accounting impacts once dragged EPS. In FY26, investment gains added billions — including the $3.2 billion Anthropic gain — and the equity investments line on the balance sheet more than doubled to $36.3 billion, while the core business compounded underneath.
4. The demand is already banked. $73 billion of prepaid, unearned revenue and enterprise Copilot seats past 30 million mean FY27's growth is substantially contracted before it begins.
5. The multiple now depends on FY27 execution. After a 25% two-day move, the market has pre-paid for the ~45% Azure growth. The risk is no longer whether AI demand exists. It is whether MacroHard — sorry, Microsoft — can pour foundations fast enough.
Frequently Asked Questions#
How much revenue did Microsoft make in fiscal year 2026? Microsoft reported total revenue of $331.8 billion for the fiscal year ended June 30, 2026, up 17.8% from $281.7 billion in FY25, per its SEC 10-K filing.
What was Microsoft's net income and EPS in FY26? Net income was $133.7 billion, up 31% year over year — a 40.3% net margin. Diluted EPS was $17.95, versus $13.64 in FY25.
Why did MSFT stock jump 25%? A combination of a Q4 beat ($90.0 billion revenue, +18%) and aggressive FY27 guidance — Azure growth of roughly 45% in constant currency with demand still exceeding datacenter capacity — drove the two-day repricing.
Why is Microsoft being called "MacroHard"? It is a long-running internet nickname that inverts "Microsoft" — and after FY26, investors are using it earnestly: with $758 billion in assets, $313 billion in datacenters, and $183 billion in operating cash flow, nothing about the company is micro or soft anymore.
How much is Microsoft spending on AI infrastructure? Capital expenditures reached $115.9 billion in FY26, nearly double FY25's $64.6 billion, with calendar year 2026 capex guided to approximately $115 billion.
What is Microsoft's dividend? Microsoft declared $3.64 per share in cash dividends in FY26, up from $3.32 in FY25, paying out $26.4 billion in cash during the year.
What is Microsoft's return on equity? Approximately 34% on average equity in FY26 — $133.7 billion of net income against average stockholders' equity of about $393 billion.
About This Analysis#
Financial Gurkha is an independent markets research publication run by Kanchan Sharma from New York City, operating a frontier-AI-assisted research desk that reads the filings other coverage summarizes. We cover the best companies in the world from the ground up — most of our work is researched and written from Wall Street and the surrounding Financial District.
Financial Gurkha covers earnings from the filings, not the press releases. Reported from Queens and Wall Street, New York City.